

ChIP-seq Data Processing and Relative and Quantitative Signal Normalization for Saccharomyces cerevisiae
酿酒酵母ChIP-seq数据处理及信号的相对与定量标准化方法
(*contributed equally to this work) 发布: 2025年05月05日第15卷第9期 DOI: 10.21769/BioProtoc.5299 浏览次数: 2959
评审: Hemant Kumar PrajapatiPriyanka MittalAakanksha J. Sane
Advertisement


Abstract
Chromatin immunoprecipitation with high-throughput sequencing (ChIP-seq) is a widely used technique for genome-wide analyses of protein–DNA interactions. This protocol provides a guide to ChIP-seq data processing in Saccharomyces cerevisiae, with a focus on signal normalization to address data biases and enable meaningful comparisons within and between samples. Designed for researchers with minimal bioinformatics experience, it includes practical overviews and refers to scripting examples for key tasks, such as configuring computational environments, trimming and aligning reads, processing alignments, and visualizing signals. This protocol employs the sans-spike-in method for quantitative ChIP-seq (siQ-ChIP) and normalized coverage for absolute and relative comparisons of ChIP-seq data, respectively. While spike-in normalization, which is semiquantitative, is addressed for context, siQ-ChIP and normalized coverage are recommended as mathematically rigorous and reliable alternatives.
Key features
• ChIP-seq data processing workflow for Linux and macOS integrating data acquisition, trimming, alignment, processing, and multiple forms of signal computation, with a focus on reproducibility.
• ChIP-seq signal generation using siQ-ChIP to quantify absolute IP efficiency—providing a rigorous alternative to spike-in normalization—and normalized coverage for relative comparisons.
• Broad applicability demonstrated with Saccharomyces cerevisiae (experimental) and Schizosaccharomyces pombe (spike-in) data but suitable for ChIP-seq in any species.
• In-depth notes and troubleshooting guide users through setup challenges and key concepts in basic bioinformatics, data processing, and signal computation.
Keywords: Bioinformatics (生物信息学)Graphical overview
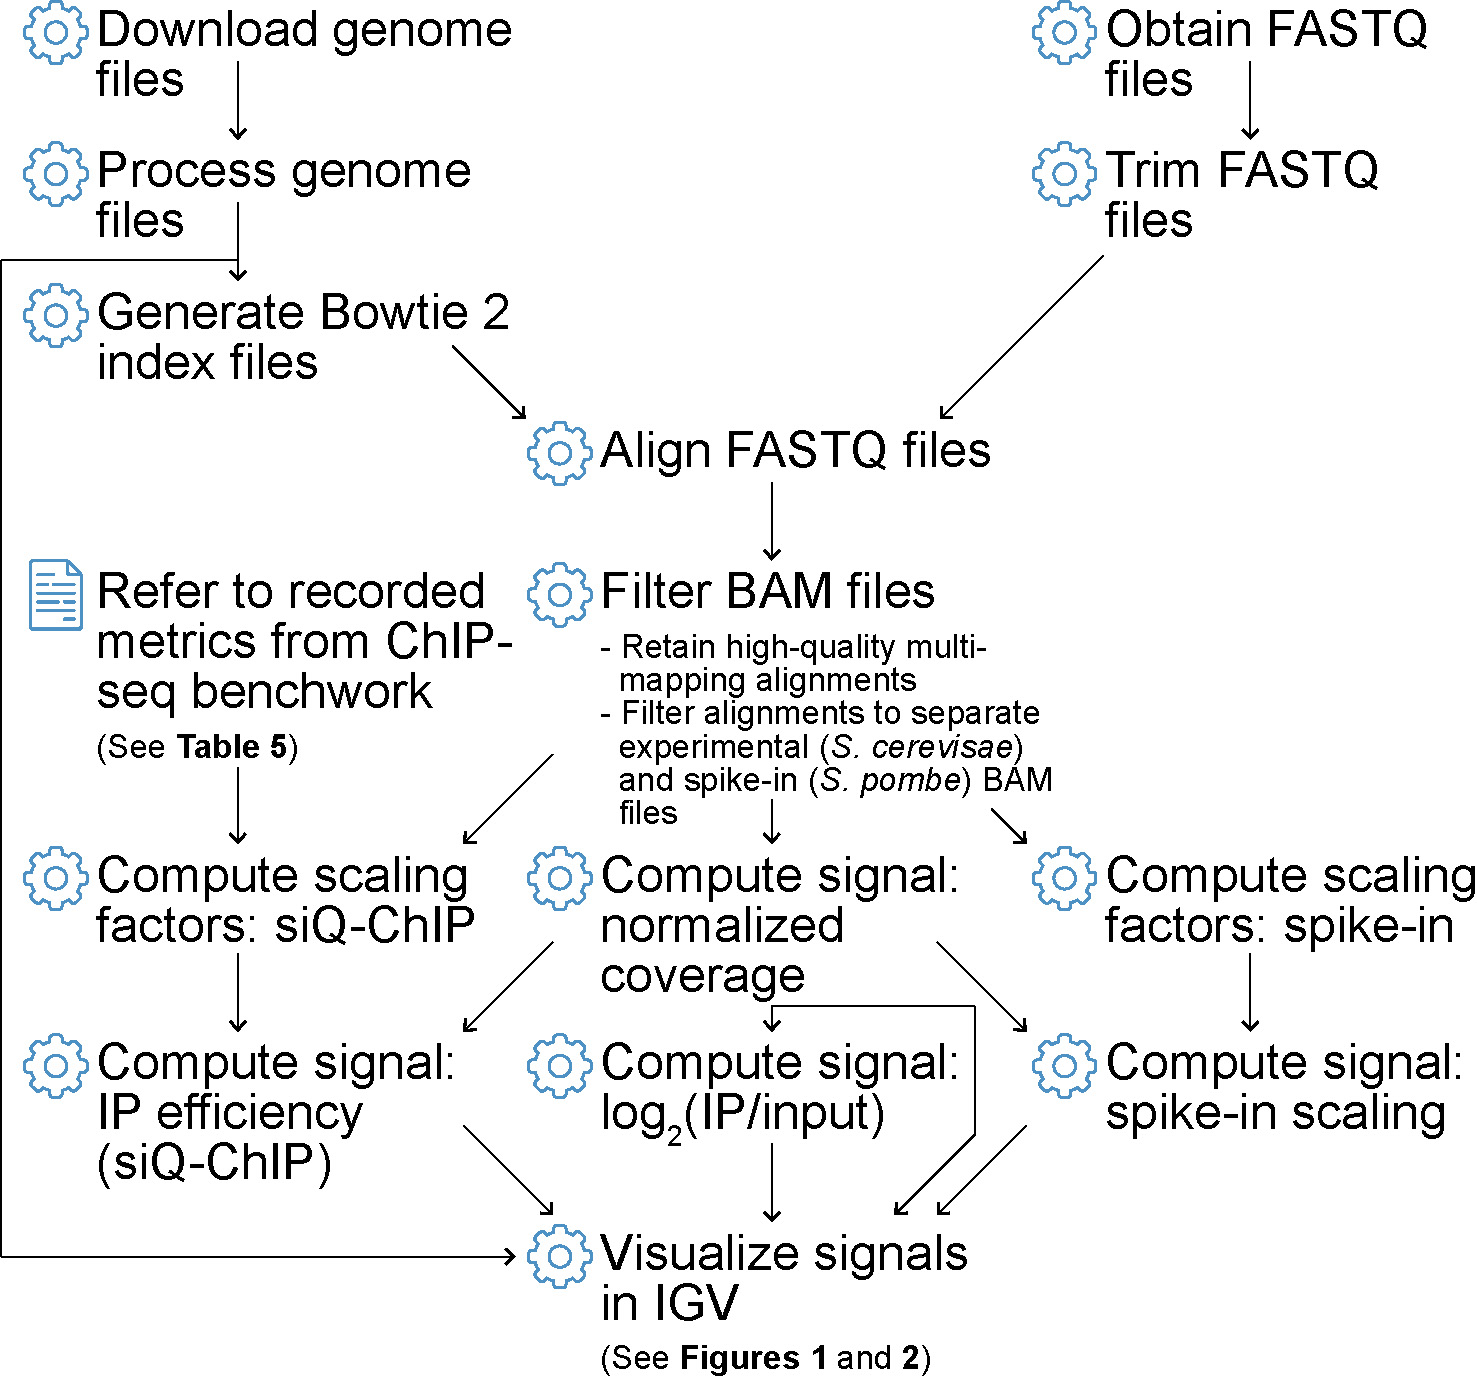
Flowchart depicting ChIP-seq data processing steps covered in this protocol
Background
Chromatin immunoprecipitation followed by high-throughput DNA sequencing (ChIP-seq) is a widely used technique for studying protein–DNA interactions across the genome [1–4]. ChIP-seq identifies regions bound by proteins such as histones, transcription factors, and other chromatin-associated factors, making it central to chromatin biology, epigenetics, and other fields. The method begins with the cross-linking of chromatin to capture DNA–protein interactions. The cross-linked chromatin is then isolated, fragmented, and immunoprecipitated using antibodies specific to the target protein. The associated DNA is recovered and sequenced with next-generation sequencing (NGS) technology. Sequenced reads (see General notes 1 and 2) are aligned to a reference genome (see General note 3) and processed into a genome-wide “signal” reflecting the frequency of protein–DNA interactions.
ChIP-seq signal, typically represented as a histogram of fragments along the genome (x-axis; see General note 4), lends itself to comparisons of protein distributions within and across samples. However, signal variability makes it difficult to link enrichment levels (y-axis) to the biological activity of proteins, particularly across different experimental conditions. Factors such as cell state, cell number, cross-linking, fragmentation, DNA amplification, library preparation, and sequencing conditions make it challenging to establish a consistent scale for comparing protein enrichment, while poor antibody specificity can further undermine accuracy [5–10].
To address this variability, researchers developed various normalization methods (see General note 5), including spike-in controls [11–15]. Spike-in normalization involves adding a known quantity of exogenous chromatin to experimental samples as a reference for signal scaling. However, evidence indicates that spike-ins often fail to reliably support comparisons within and between samples [5,16], as discussed below. The recently developed sans spike-in quantitative ChIP (siQ-ChIP) method overcomes these limitations by measuring absolute protein–DNA interactions [i.e., immunoprecipitation (IP) efficiency] genome-wide, without relying on exogenous chromatin as a reference [5,16]. Importantly, siQ-ChIP does not introduce additional experimental requirements beyond those already inherent to ChIP-seq. Rather, it explicitly highlights fundamental factors—such as antibody behavior, chromatin fragmentation, and input quantification—that influence signal interpretation, reinforcing best practices intrinsic to ChIP-seq (see General notes 6 and 7). This protocol introduces the computation of siQ-ChIP-adjusted signal for absolute, quantitative comparisons of ChIP-seq data within and between samples, as well as normalized coverage for relative comparisons [16] (see General note 8). Although steps for computing semiquantitative spike-in scaled signals are included for context [15], siQ-ChIP and normalized coverage are strongly recommended as mathematically rigorous and more effective tools for ChIP-seq analyses.
Designed for researchers with minimal bioinformatics experience (see General note 9), this protocol covers computational setup, read processing, and signal visualization. The Procedure section covers program installations and computational environment setup, while the Data analysis section provides guidance on data acquisition and processing. The protocol focuses on Saccharomyces cerevisiae and discusses data processing and signal interpretation relevant to its ribosomal DNA (rDNA) locus, a site of high biological interest [17] with specific computational considerations (see General note 10). However, the data processing methods apply to genome-wide analysis, not just the rDNA. While the examples and applications use S. cerevisiae data, the principles and processing steps are broadly applicable to ChIP-seq data from any organism, including widely studied models such as Homo sapiens and Mus musculus.
Software and datasets
A. Computational and experimental resources
This section provides an overview of the computational and experimental resources used in the protocol, including system requirements, software tools, yeast strains, reference genomes, and key experimental parameters. Table 1 lists the operating systems used for implementation and testing. Table 2 details the primary programs required to execute the workflow, along with recommended versions for compatibility. Table 3 describes the yeast strains used for ChIP-seq data generation (see General note 11), specifying their genotypes and references. This protocol uses data from an engineered system in which FLAG epitope sequences were integrated with S. cerevisiae HHO1 (histone H1) [18], S. cerevisiae HMO1 (chromatin-associated high mobility group protein), and S. pombe abp1 (ARS binding protein 1, a CENP-B homolog) [19,20], resulting in FLAG-tagged proteins. This system promotes uniform antibody affinity across endogenous (S. cerevisiae) and spike-in (S. pombe) chromatin, minimizing variability in binding efficiency (discussed in later sections and notes). All yeast strains used in this protocol are available upon request from the Tsukiyama Lab (ttsukiya@fredhutch.org). Table 4 presents the reference genomes used for read alignment and data processing. Table 5 documents ChIP-seq experimental parameters for S. cerevisiae samples, including input and IP volumes, chromatin masses, and cell cycle states, which are needed to compute siQ-ChIP α proportionality constants. ChIP-seq data are available in the Gene Expression Omnibus (GEO) via accession number GSE288548.
Table 1. Operating systems (os) and respective versions used to implement, test, and run the protocol.
| os | Version |
|---|---|
| macOS | 15.1.1 24B91 |
| Ubuntu (Linux) | 18.04.6 LTS (Bionic Beaver) |
Table 2. Programs used to implement, test, and run the protocol, excluding dependencies and libraries. The table also includes program version numbers, associated operating systems (os), and relevant references. While most program versions do not need strict adherence, the following version guidelines are recommended for compatibility: Atria [21] 4.0.0 or later, installed with Julia [22,23] 1.8.5; Bash 3.2.0 or later; GNU Parallel [24] 20150222 or later; Python [25] 3.6.0 or later.
| Program | Version | os | Reference(s) |
|---|---|---|---|
| Atria | 4.0.3 | macOS, Linux | [21] |
| Awk (GNU) | 5.3.1 | macOS, Linux | [26,27] |
| Bash | 3.2.57(1) | macOS | |
| Bash | 4.4.20(1) | Linux | |
| bc | 1.07.1 | macOS, Linux | |
| Bowtie2 | 2.5.4 | macOS, Linux | [28–30] |
| Conda | 24.7.1 | macOS, Linux | |
| Git | 2.39.5 | macOS | |
| Git | 2.17.1 | Linux | |
| IGV (“with Java Included”) | 2.19.1 | macOS | [31–34] |
| Julia | 1.8.5 | macOS, Linux | [22,23] |
| Mamba | 1.5.9 | macOS, Linux | |
| Miniforge3 | 24.7.1-2 | macOS, Linux | |
| Parallel (GNU) | 20170422 | macOS, Linux | [24] |
| Python | 3.12.7 | macOS, Linux | [25] |
| Samtools | 1.21 | macOS, Linux | [35,36] |
| SLURM | 24.05.4 | Linux | [37] |
Table 3. S. cerevisiae and S. pombe strains used for ChIP-seq data generation. “Organism” indicates whether the strain is S. cerevisiae or S. pombe. “strain_full” represents the complete strain identifier; for S. cerevisiae, that includes a three-letter prefix indicating the lab of origin (e.g., “yTT” represents “yeast Toshio Tsukiyama”). “genotype_full” specifies that the S. cerevisiae HHO1 and HMO1 genes were separately tagged with sequences encoding 3×FLAG epitopes, including flexible linkers (2L-3FLAG), generating HHO1-2L-3FLAG and HMO1-2L-3FLAG strains; and the S. pombe gene abp1 was tagged with a 3×FLAG epitope sequence, generating abp1-3FLAG. The final column lists the studies in which the strains were described. For more details, see General note 11.
| Organism | strain_full | genotype_full | Reference |
|---|---|---|---|
| Saccharomyces cerevisiae | yTT6336 | HHO1-2L-3FLAG | [18] |
| Saccharomyces cerevisiae | yTT6337 | HHO1-2L-3FLAG | [18] |
| Saccharomyces cerevisiae | yTT7750 | HMO1-2L-3FLAG | This protocol |
| Saccharomyces cerevisiae | yTT7751 | HMO1-2L-3FLAG | This protocol |
| Schizosaccharomyces pombe | Sphc821 | abp1-3FLAG | [19] |
Table 4. Species genomes used for alignment, data processing, and signal visualization. “Species” specifies whether the genome is for S. cerevisiae or S. pombe. “Genome” refers to the reference genome assembly strain/name. “Version” indicates the assembly version used. “Database” refers to the source of the genome assembly. Assembly versions do not need to be strictly followed. For more information, refer to Data analysis A, B, E, and J.
| Species | Genome | Version | Database |
|---|---|---|---|
| S. cerevisiae | S288C | R64-5-1 20240529 | Saccharomyces Genome Database |
| S. pombe | 972h- | 2024-11-01 | Pombase |
Table 5. S. cerevisiae ChIP-seq experimental parameters, including those needed to compute siQ-ChIP α proportionality constants. Parameters include input volumes (“vol_in”) and total volumes before the removal of input (“vol_all”) in microliters, as well as input and IP chromatin masses (“mass_in” and “mass_ip”) in nanograms, measured during ChIP-seq benchwork [5,16]. Average fragment lengths in base pairs (bp; “length_in” and “length_ip”) are required but do not need to be included in the table, as they can be calculated from sample BAM files during α computation (see Data analysis H). “genotype_full” and “genotype”: Genetic constitution of S. cerevisiae sample. As there is no indication that the tag compromises the function of either Hho1 or Hmo1, these strains are labeled “WT” (wild type) in filenames. “State”: Cell-cycle phase. “G1” represents cells in the first gap phase of the cell cycle, preparing for DNA synthesis. “G2/M” includes cells in the second gap phase (G2), undergoing DNA synthesis, and mitosis (M), representing the cell cycle substages leading to and including cell division. “Q” represents quiescent cells in a reversible state of cell cycle withdrawal. “Factor”: Protein immunoprecipitated using mouse monoclonal anti-FLAG M2 antibody (Sigma, F1804). “Hho1” corresponds to S. cerevisiae histone H1, and “Hmo1” to S. cerevisiae chromatin-associated high mobility group family member protein. “strain_full”: Full S. cerevisiae strain identifier. “Strain”: Abbreviated S. cerevisiae strain identifier, which may be substituted with “replicate” (or “rep”).
| genotype_full | Genotype | State | Factor | strain_full | Strain | vol_in | vol_all | mass_in | mass_ip |
|---|---|---|---|---|---|---|---|---|---|
| HHO1-2L-3FLAG | WT | G1 | Hho1 | yTT6336 | 6336 | 20 | 300 | 72.5 | 2.7 |
| HHO1-2L-3FLAG | WT | G1 | Hho1 | yTT6337 | 6337 | 20 | 300 | 81.1 | 5 |
| HHO1-2L-3FLAG | WT | G2M | Hho1 | yTT6336 | 6336 | 20 | 300 | 104.9 | 6.6 |
| HHO1-2L-3FLAG | WT | G2M | Hho1 | yTT6337 | 6337 | 20 | 300 | 85.2 | 6.1 |
| HHO1-2L-3FLAG | WT | Q | Hho1 | yTT6336 | 6336 | 20 | 300 | 72.7 | 116.9 |
| HHO1-2L-3FLAG | WT | Q | Hho1 | yTT6337 | 6337 | 20 | 300 | 69.6 | 70.6 |
| HMO1-2L-3FLAG | WT | G1 | Hmo1 | yTT7750 | 7750 | 20 | 300 | 79.9 | 8.4 |
| HMO1-2L-3FLAG | WT | G1 | Hmo1 | yTT7751 | 7751 | 20 | 300 | 63.6 | 3.2 |
| HMO1-2L-3FLAG | WT | G2M | Hmo1 | yTT7750 | 7750 | 20 | 300 | 32.4 | 5.4 |
| HMO1-2L-3FLAG | WT | G2M | Hmo1 | yTT7751 | 7751 | 20 | 300 | 93.4 | 3.4 |
| HMO1-2L-3FLAG | WT | Q | Hmo1 | yTT7750 | 7750 | 20 | 300 | 67.9 | 27.4 |
| HMO1-2L-3FLAG | WT | Q | Hmo1 | yTT7751 | 7751 | 20 | 300 | 106.6 | 14.8 |
B. Companion GitHub repository for protocol implementation
This protocol is accompanied by the GitHub repository protocol_chipseq_signal_norm (github.com/kalavattam/protocol_chipseq_signal_norm), which contains tools, scripts, and resources for implementing the workflow described in this tutorial. protocol_chipseq_signal_norm includes driver and utility scripts, functions, and a Markdown notebook, workflow.md, that provides code examples with explanatory text for the steps outlined in the Procedure and Data analysis sections. All content is organized and documented following the principles in [38,39]. Key features include the following:
• Initializing variables for directory paths, files, and computational environments, among other things.
• Defining script arguments.
• Organizing input and output files within structured directory systems.
• Validating paths, files, dependencies, etc.
• Automating experiments with driver scripts that coordinate processes like read trimming, alignment, post-processing, and signal track generation. Most driver scripts accept serialized lists (e.g., comma-delimited strings) of FASTQ, BAM, or bedGraph input files, which can be generated using the utility script find_files.sh (see General note 12).
• Parallelizing tasks on high-performance computing clusters configured to use SLURM [37] or on local or remote systems using GNU Parallel [24].
• Capturing detailed logs for all commands to support troubleshooting and reproducibility.
Additionally, the protocol_chipseq_signal_norm repository includes tab-separated value (TSV) files for downloading experimental datasets (see Data analysis C) and a TSV file with metadata and parameters required for running siQ-ChIP (see Data analysis H).
Procedure
文章信息
稿件历史记录
提交日期: Feb 10, 2025
接收日期: Apr 2, 2025
在线发布日期: Apr 16, 2025
出版日期: May 5, 2025
版权信息
© 2025 The Author(s); This is an open access article under the CC BY-NC license (https://creativecommons.org/licenses/by-nc/4.0/).
如何引用
Alavattam, K. G., Dickson, B. M., Hirano, R., Dell, R. and Tsukiyama, T. (2025). ChIP-seq Data Processing and Relative and Quantitative Signal Normalization for Saccharomyces cerevisiae. Bio-protocol 15(9): e5299. DOI: 10.21769/BioProtoc.5299.
分类
生物信息学与计算生物学
系统生物学 > 基因组学 > 染色质免疫共沉淀测序(ChIP-seq)
分子生物学 > DNA > DNA-蛋白质相互作用
您对这篇实验方法有问题吗?
在此处发布您的问题,我们将邀请本文作者来回答。同时,我们会将您的问题发布到Bio-protocol Exchange,以便寻求社区成员的帮助。