

A Guide to Basic RNA Sequencing Data Processing and Transcriptomic Analysis
基础RNA测序数据处理与转录组分析指南
发布: 2025年05月05日第15卷第9期 DOI: 10.21769/BioProtoc.5295 浏览次数: 7915
评审: Prashanth N SuravajhalaPayton Tung-On YauAnonymous reviewer(s)
参见作者原研究论文
The authors used this protocol in:
Oct 2024
Advertisement


Abstract
RNA sequencing (RNA-Seq) has transformed transcriptomic research, enabling researchers to perform large-scale inspection of mRNA levels in living cells. With the growing applicability of this technique to many scientific investigations, the analysis of next-generation sequencing (NGS) data becomes an important yet challenging task, especially for researchers without a bioinformatics background. This protocol offers a beginner-friendly step-by-step guide to analyze NGS data (starting from raw .fastq files), providing the required codes with an explanation of the different steps and software used. We outline a computational workflow that includes quality control, trimming of reads, read alignment to the genome, and gene quantification, ultimately enabling researchers to identify differentially expressed genes and gain insights on mRNA levels. Multiple approaches to visualize this data using statistical and graphical tools in R are also described, allowing the generation of heatmaps and volcano plots to represent genes and gene sets of interest.
Key features
• Provides a beginner-friendly protocol for RNA-Seq analysis to obtain insights into gene expression.
• Pipeline starts with raw .fastq files and involves analysis in command line/terminal and R (via RStudio).
• Yields a variety of output files that represent mRNA levels amongst different samples. Output files include count files, heatmaps, ordered lists of DEGs, and volcano plots.
Keywords: RNA-Seq (RNA测序)Graphical overview
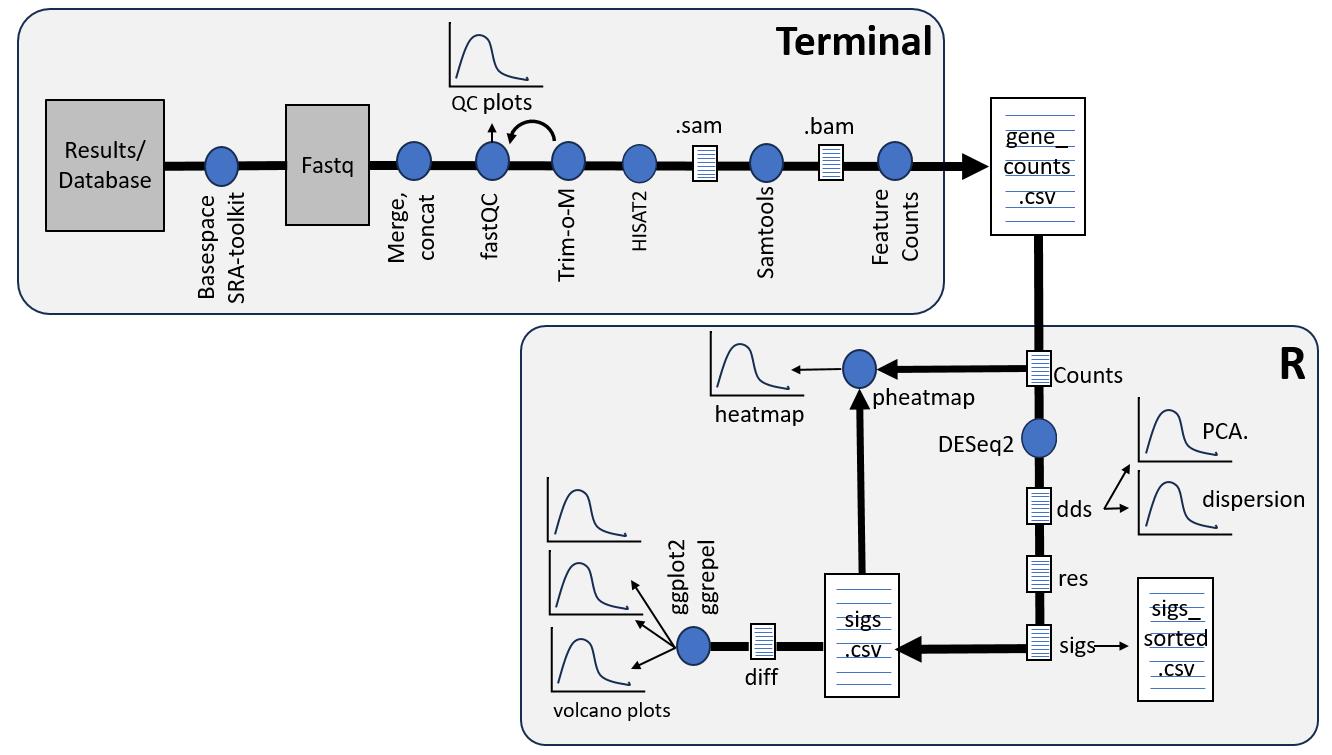
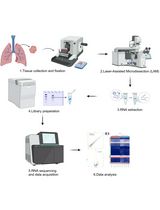
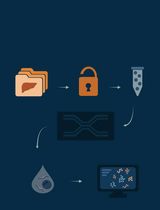
RNA-Seq workflow. Terminal (upper panel) is used to run the indicated programs with the output file (gene_counts.cvs) indicating the counts of each gene in a given sample. R (lower panel) run via RStudio provides statistical analysis of the counts. Details of the Terminal and RStudio scripts and the application of each program are described in the text. The blue dots represent the different software used and the arrows indicate the sequence of analysis. Furthermore, the different data outputs are shown as paper-like icons (for data tables) or graph-like icons (for graphical representations/figures of the data).
Background
To understand the functional importance of genes of interest, biologists have turned to the analysis of the whole genome transcriptome, which involves quantifying the total mRNA content of a cell. In recent years, omics technologies have offered a novel approach to obtaining high-throughput data in biological systems in response to different conditions and experimental treatments. One such technology, RNA sequencing (RNA-Seq), involves the utilization of next-generation sequencing (NGS) and allows for large-scale examination of the RNA content of cells [1]. This has allowed for its widespread use to assess gene expression patterns and also for the identification of novel RNA transcripts.
In transcriptomic RNA-Seq—the focus here—the mRNA content of cells is examined quantitatively through the specific selection of mRNA poly(A) tails or through the depletion of ribosomal RNA (rRNA). This is followed by reverse transcription of the mRNA into cDNA. Every cDNA synthesized subsequently gets sequenced by short NGS reads, and the number of reads per transcript gets quantified. We used the workflow presented in the graphical overview to analyze RNA-Seq data obtained from stimulated airway epithelial cells [2]. For this study, gene signatures related to inflammation and cellular trafficking were the specific analyses of interest, but the pipeline is amenable to many explorations of differential gene expression in response to different treatments and perturbations.
Output from NGS platforms is typically in the format of FASTQ files, which consist of sequenced reads. These reads must be mapped or aligned to the reference genome of the samples, which may be performed using software such as HISAT2, STAR, or TopHat. The pipeline described in this method uses HISAT2 for alignment. Information on the counts of each transcript can be obtained using featureCounts software. This can then be followed by differentially expressed genes (DEG) analysis and plotting of gene expression data. All of these steps require a computational pipeline, which is described here in detail for DESeq2. The first part of this computational pipeline is performed in Terminal, also known as Shell, which runs code from the command line, ideally using a high-capacity computer for faster data processing. Then, DEG analysis is performed in RStudio. Note that coding in Terminal and RStudio is case-sensitive, and slight differences in code spacing or capitalization can render it invalid.
In this protocol, RNA quality control and library preparation steps performed prior to NGS are not discussed; rather, a straightforward computational pipeline to analyze RNA-Seq data is provided. Specifically, detailed steps are outlined that allow researchers with little to no previous expertise with RNA-Seq data analysis or bioinformatics to go from raw FASTQ-format files obtained from NGS sequencing, or obtained from online databases, to information on differential gene expression levels and different modes to present such data such as volcano plots and heatmaps.
An example analysis using data from the GEO is provided as Supplementary Information.
Software and datasets
1. Conda
2. FastQC [3]
3. Trimmomatic [4]
4. HISAT2 [5]
5. Samtools [6]
6. featureCounts (part of the Subread package) [7]
7. R and R Studio (https://cran.r-project.org/web/packages/litteR/vignettes/litteR-installation.html)
8. Bioconductor (R package) [8]
9. pheatmap package (R package) [9]
10. ggplot2 (R package) [10] and ggrepel (R package) [11]
Procedure
文章信息
稿件历史记录
提交日期: Feb 2, 2025
接收日期: Mar 30, 2025
在线发布日期: Apr 15, 2025
出版日期: May 5, 2025
版权信息
© 2025 The Author(s); This is an open access article under the CC BY license (https://creativecommons.org/licenses/by/4.0/).
如何引用
Shouib, R., Eitzen, G. and Steenbergen, R. (2025). A Guide to Basic RNA Sequencing Data Processing and Transcriptomic Analysis. Bio-protocol 15(9): e5295. DOI: 10.21769/BioProtoc.5295.
分类
生物信息学与计算生物学
系统生物学 > 转录组学 > RNA测序
您对这篇实验方法有问题吗?
在此处发布您的问题,我们将邀请本文作者来回答。同时,我们会将您的问题发布到Bio-protocol Exchange,以便寻求社区成员的帮助。