

Cell-Sonar, an Easy and Low-cost Method to Track a Target Protein by Expression Changes of Specific Protein Markers
Cell-Sonar:通过特定蛋白标志物表达变化追踪目标蛋白的简便低成本方法
发布: 2025年02月05日第15卷第3期 DOI: 10.21769/BioProtoc.5206 浏览次数: 1851
评审: Alessandro DidonnaXin XuAnonymous reviewer(s)
参见作者原研究论文
The authors used this protocol in:

Aug 2024
Advertisement


Abstract
Different research methods aim to clarify the intracellular trafficking of target proteins or unknown pathways. Currently, existing methods are mostly complex and expensive, requiring expert knowledge. Detailed microscopy for protein co-localization detection or omic technologies, which provide holistic network data, are elaborate, mostly complex, and expensive to apply. Our protocol illustrates a method to track a target protein by detecting expression changes of user-selected marker proteins that directly or indirectly interact with the target. Modulation of protein expression indicates interactions between the target and marker protein. Even without co-localization analysis, the results of the protein expression change are the first insights into the target's fate. Moreover, the use of the cell-sonar is straightforward and affordable, and the results are rapidly available. Furthermore, this method could also be used to determine if and how pathways are affected by compounds added to the cells. In conclusion, our method is adaptable to a wide range of proteins, easy to apply, inexpensive, and expandable with substances that affect proteins.
Key features
• Easy-to-implement method to track intracellular proteins.
• Marker protein expression change demonstrates protein interaction.
• Combined data of all marker proteins is used to give an indirect overview of protein localization.
• This method is also applicable to different compounds and thus provides information about protein induction or influence on pathways.
Keywords: Protein expression changes (蛋白表达变化)Graphical overview
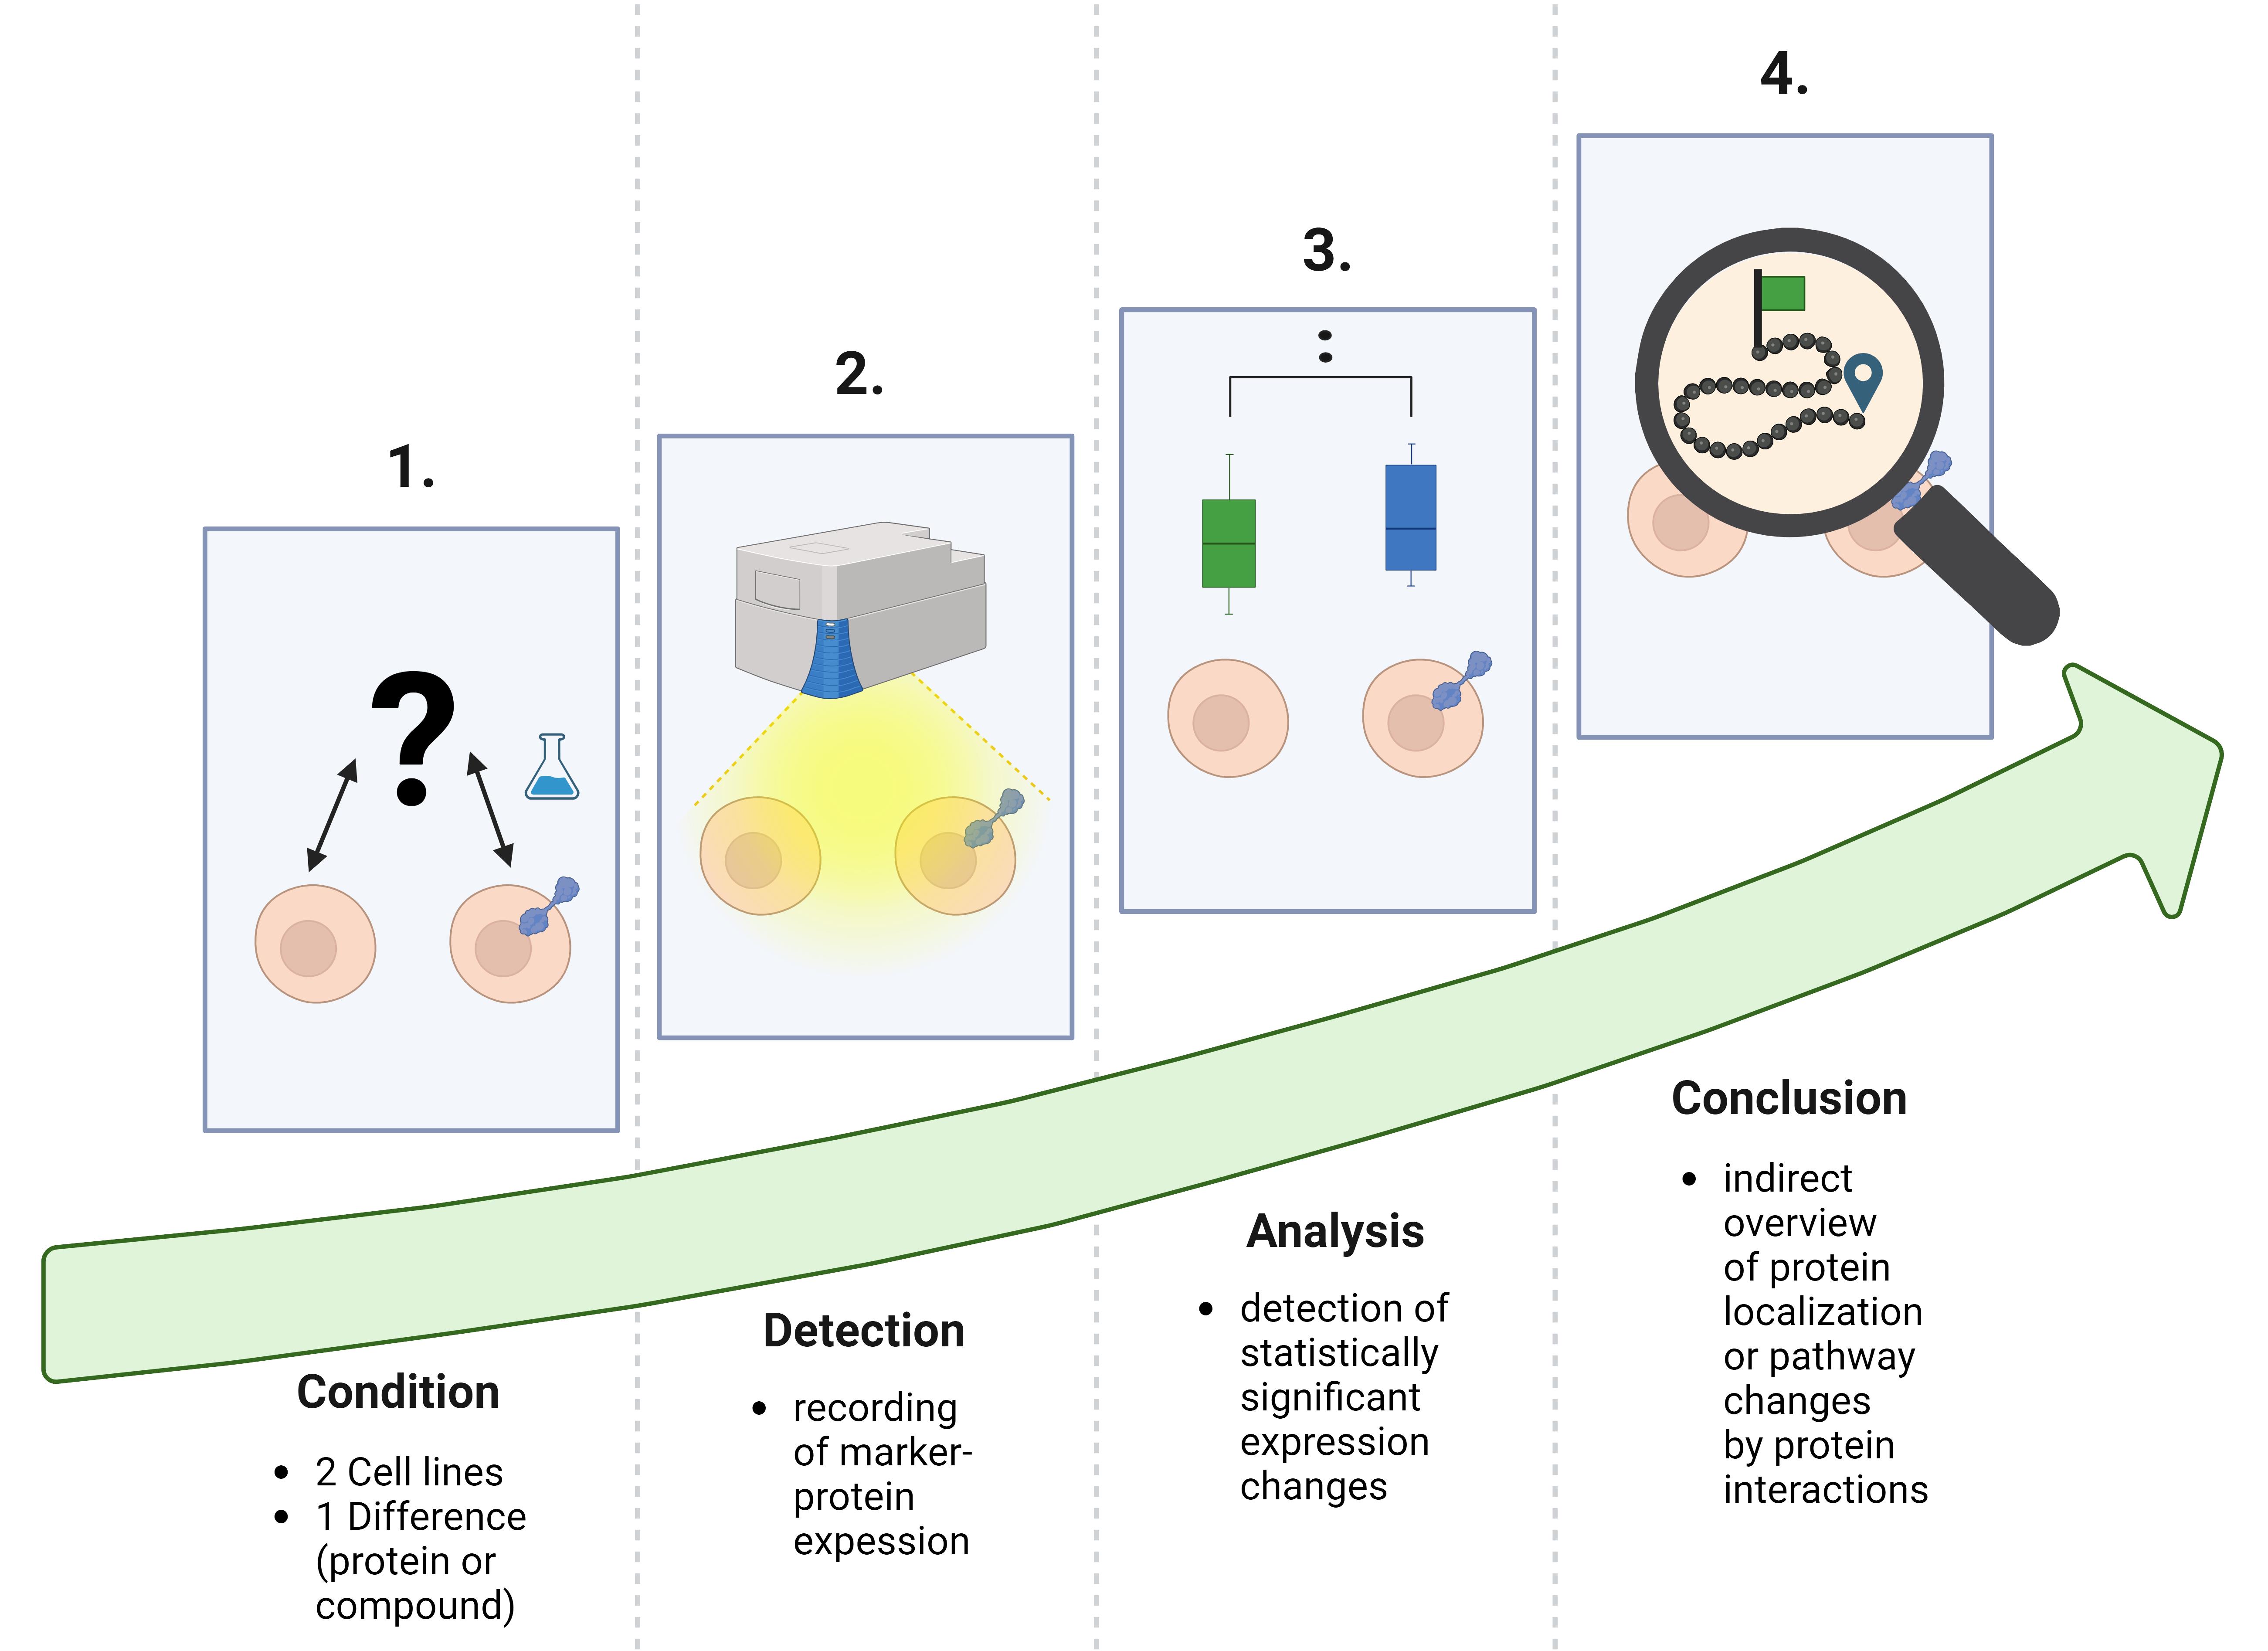
Workflow of cell-sonar
Background
Cell-sonar is an easy-to-implement method that allows indirect intracellular tracking of target proteins. The elucidation of secretory pathways has long been the primary objective of most research fields. Available methods for this are diverse microscopy techniques [1–4] or “omic” screenings [5]. These specific procedures result in high-definition data but, in almost all applications, they are complex, complicated, expensive, and elaborate. Our illustrated protocol is an alternative to these existing techniques, with the difference that cell-sonar is inexpensive, simple, and quick to apply. The results provide a first insight into protein localization.
The cell-sonar concept works universally for any application due to the principle of proteostasis, which regulates the protein balance in cells [6]. Several evolutionarily conserved signaling cascades for protein expression are controlled by proteostasis [6–8]. These protein networks are organized via signaling by recognition of stress responses and the maintenance of cellular proteins [7–9]. Internally, the endoplasmic reticulum (ER) controls the unfolded protein response (UPR) to each protein change [7] during its biosynthesis by regulating the ER capacity of nascent protein levels [7]. Signaling to the nucleus for the expression of required proteins is also orchestrated by UPR [10–12]. The signaling network located outside the ER is controlled by the mitogen-activated protein kinase (MAPK), and they interact in a synergistic manner [7]. The recognition of intracellular stress by MAPK-induced nucleus signaling is essential for gene expression [13]. This ability to dynamically detect changes, such as transgenic protein insertion or compound exposure, allows the detection of induced cellular protein expression. Exposure to a compound or expression of a transgenic target protein serves as an initiator of a stress response. Comparison of two cell lines that differ only in compound exposure or protein expression allows the detection of expression changes of interacting proteins, as shown in Figure 1. Altered intracellular protein levels provide a tracking indicator to observe secretory or other pathways of interest.
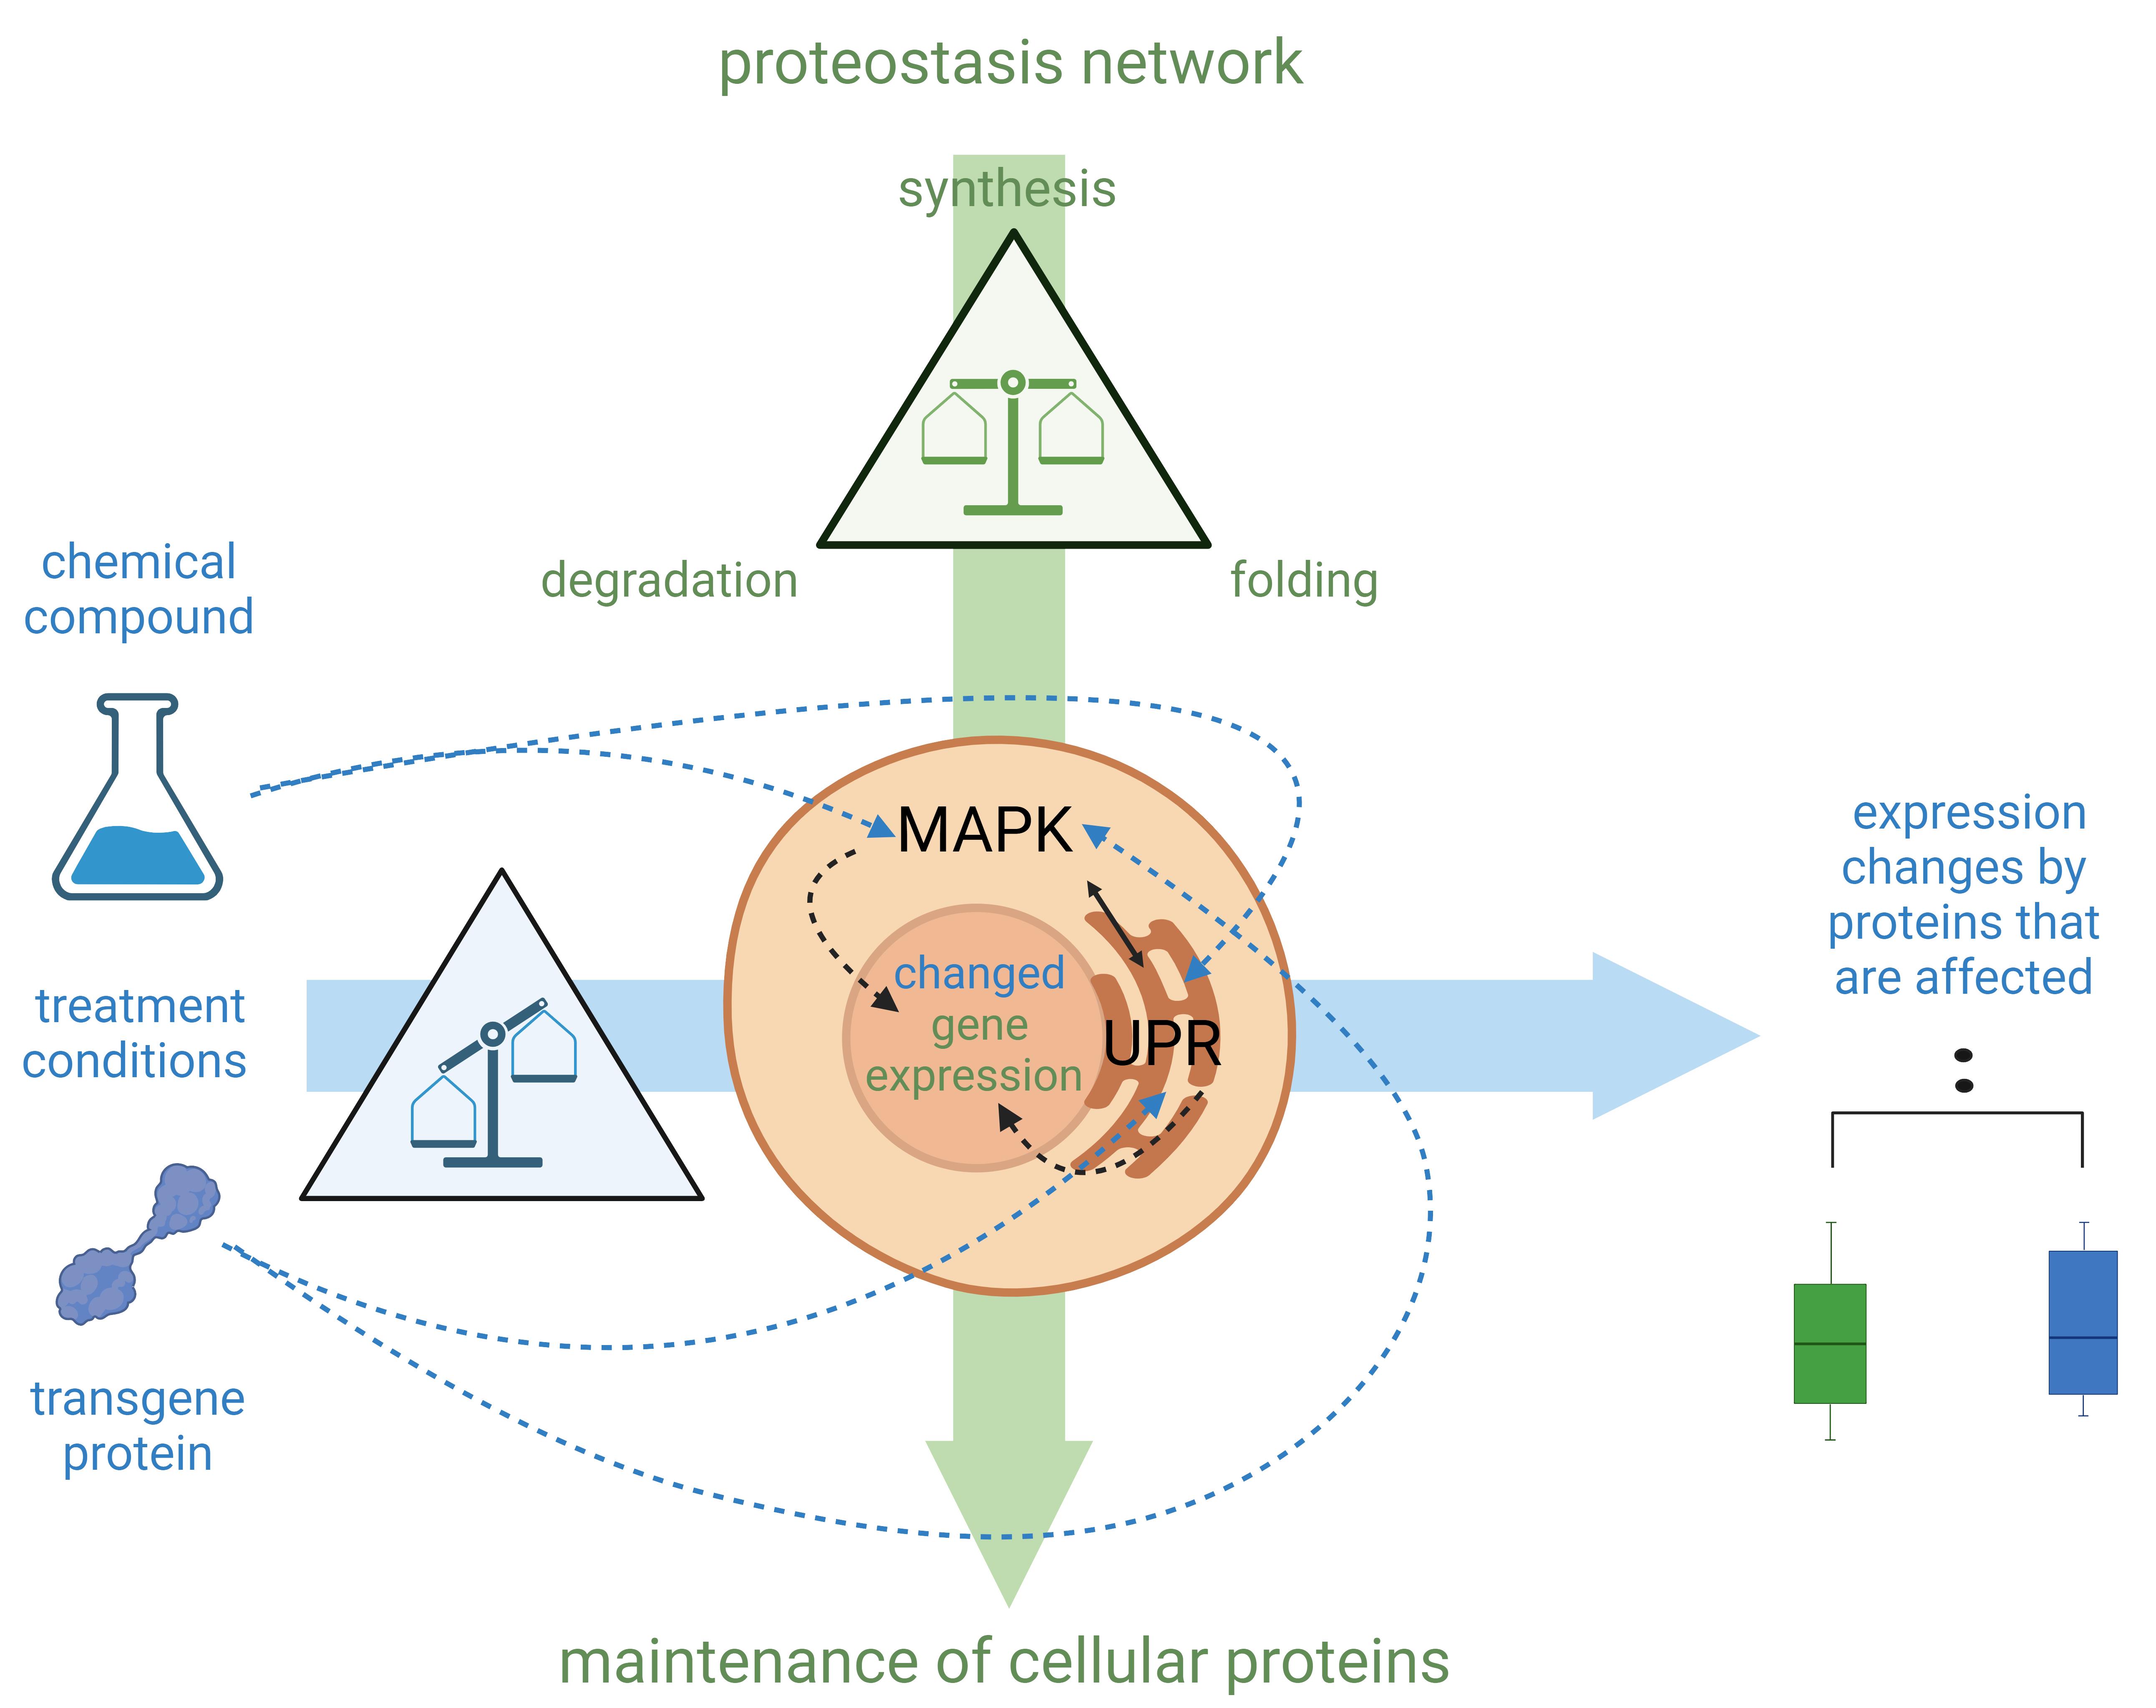
Figure 1. Schematic explanation of the cell-sonar principle. Mitogen-activated protein kinase (MAPK) and unfolded protein response (UPR) synergistically orchestrate signaling throughout the cell with subsequent induction of gene expression in the nucleus. (See details in Background section.) Highlighted in green are the components of the proteostasis network, which balances the synthesis, folding, and degradation of proteins to maintain the count of cellular proteins. MAPK and UPR are signaling networks that regulate any protein change that affects proteostasis processes. Highlighted in blue are the treatments that affect these balances. Chemical compounds or transgene proteins, which are not typically present in the cell, can result in an imbalance of the affected proteins as they interact (represented by blue dashed arrows). The proteostasis network regulates by altering gene expression to restore the balance. This is the reason why expression changes of interacting protein levels can be observed in direct comparison with untreated (green boxplot) and treated (blue boxplot) cellular proteins.
If there is a detectable expression change, it is the result of a protein interaction; if there is none, no protein interaction has happened. The results obtained from a few selected marker proteins provide a comprehensive overview of the fate of the target protein without the need to demonstrate the co-localization between a target and a marker protein. The advantages of cell-sonar are that it is adaptable to a wide range of proteins, easy to apply, and applicable to almost any cell line while it provides insights into the secretory pathway tracking in a short time.
The limitations include the fact that cell-sonar remains an overview. In order to make a reliable statement, it is crucial to use at least two marker proteins for one aspect and possess a detailed knowledge of the pathway and the proteins involved.
Materials and reagents
The following protocol instructions refer to the ER as the selected cellular area. Depending on the research question, the method can be expanded to additional cellular areas or various cellular pathways. In the following, we describe the basic principle and application of the method. We illustrate our protocol with two different cell lines, two different target proteins, and one compound to demonstrate the versatility of the cell-sonar method. Furthermore, we use the in-cell western method for the detection of protein expression changes but, of course, other methods such as on-cell western, western blot, or fluorescence-activated cell sorting analysis can also be used for this detection.
Biological materials
1. Chinese hamster ovary (CHO) cell line (Leibniz Institute DSMZ, ACC 110) and GH4C1 (Rattus norvegicus) cells (Genionics, Schlieren, Switzerland); both cell lines stably express different recombinant nicotinic acetylcholine receptors (nAChR). That means there are a) CHO cells, b) CHO cells expressing α12β1δϵ nAChR, [14], c) GH4C1 cells, and d) GH4C1 cells expressing α7 nAChR. Using identical cell lines for both host cells and genetically modified cells enables a direct comparison of protein levels
Reagents
1. MeOH (Merck/Sigma-Aldrich, catalog number: 1.06011.2500L)
2. Blocking buffer (LiCor, catalog number: 927-70001)
3. PBS pH 7.4, 1× dilution, without Mg and Ca (Gibco, catalog number: 10010-015)
4. Tween 20 (Merck/Sigma-Aldrich, catalog number: P1379-100mL)
5. Cell tag stain 700 (LiCor, catalog number: 926-41090)
6. Nicotine (Merck/Sigma-Aldrich, catalog number: N3876-25mL)
7. Primary antibodies: calnexin (CN) (Abcam, catalog number: ab133615), BiP (Abcam, catalog number: ab213258), Sil1 (Abcam, catalog number: ab228868), Hrd1 (Abcam, catalog number: ab249578), UGGT1 (Abcam, catalog number: ab124879), and GAPDH (Abcam, catalog number: ab8245)
8. Secondary antibodies: IRDye 800 rabbit (LiCor, catalog number: 92632211) and IRDye 800 mouse (LiCor, catalog number: 2632210)
9. Culture medium F-12 Nut Mix + GlutaMaxTM (Gibco, catalog number: 31765-027)
10. Fetal calf serum (FCS) (Gibco, catalog number: 10270-106)
Solutions
1. PBST (0.1% Tween-20 in PBS)
2. Primary antibody dilution 1:200 in blocking buffer
3. Secondary antibody dilution 1:800 in blocking buffer
4. Nicotine cell treatment (see Recipes)
Recipes
1. Nicotine cell treatment
| Reagent | Final concentration | Exposure time |
|---|---|---|
| Nicotine | 30 μM | 24 h |
Laboratory supplies
1. Black 96-well microplates with clear bottoms (Greiner Bio one, catalog number: 655986)
Equipment
Odyssey CLx Imager (LiCor, catalog number: 9140)
Note: Odyssey CLx is no longer available, the successor model is Odyssey DLx Imager, catalog number: 9142.
2. KS 260 control IKA (Sigma-Aldrich, catalog number: Z341835)
3. Fume hood HERA Safe KSP (Thermo Scientific, catalog number: 17168075)
Software and datasets
1. Image Studio software (version 5.2 LiCor)
2. Prism [version 9.5.1 (733) GraphPad]
3. Excel (version 16.0.10415.20025 Microsoft Excel 2019 MSO)
4. BioRender (https://www.biorender.com/). The following figures were created using BioRender: Graphical overview, BioRender.com/s04v667; Figure 1, BioRender.com/w21c279; Figure 2, BioRender.com/i62d658
Procedure
文章信息
稿件历史记录
提交日期: Oct 15, 2024
接收日期: Dec 19, 2024
在线发布日期: Jan 14, 2025
出版日期: Feb 5, 2025
版权信息
© 2025 The Author(s); This is an open access article under the CC BY license (https://creativecommons.org/licenses/by/4.0/).
如何引用
Brockmöller, S., Molitor, L. M., Worek, F. and Rothmiller, S. (2025). Cell-Sonar, an Easy and Low-cost Method to Track a Target Protein by Expression Changes of Specific Protein Markers. Bio-protocol 15(3): e5206. DOI: 10.21769/BioProtoc.5206.
分类
生物化学 > 蛋白质 > 表达
生物化学 > 蛋白质 > 相互作用 > 蛋白质-蛋白质相互作用
您对这篇实验方法有问题吗?
在此处发布您的问题,我们将邀请本文作者来回答。同时,我们会将您的问题发布到Bio-protocol Exchange,以便寻求社区成员的帮助。