

An Imaging-Based Assay to Measure the Location of PD-1 at the Immune Synapse for Testing the Binding Efficacy of Anti-PD-1 and Anti-PD-L1 Antibodies
用于测试抗PD-1和抗PD-L1抗体结合效力的基于成像的免疫突触PD-1定位检测方法
发布: 2024年09月05日第14卷第17期 DOI: 10.21769/BioProtoc.5057 浏览次数: 2495
评审: Emilie BesnardPaurvi ShindeKerui Huang
参见作者原研究论文
The authors used this protocol in:
Sep 2024


Abstract
PD-1 is an immune checkpoint on T cells. Antibodies to PD-1 or its ligand PD-L1 are gaining popularity as a leading immunotherapy approach. In the US, 40% of all cancer patients will be treated with anti-PD-1 or anti-PD-L1 antibodies but, unfortunately, only 30% will respond, and many will develop immune-related adverse events. There are nine FDA-approved anti-PD-1/PD-L1 antibodies, and approximately 100 are in different stages of clinical development. It is a clinical challenge to choose the correct antibody for a given patient, and this is critical in advanced malignancies, which often do not permit a second-line intervention. To resolve that, an in vitro assay to compare the performance of the different anti-PD-1/PD-L1 antibodies is not only a critical tool for research purposes but also a possible tool for personalized medicine. There are some assays describing the binding affinity and function of anti-PD-1/PD-L1 antibodies. However, a significant limitation of existing assays is that they need to consider the location of PD-1 in the immune synapse, the interface between the T cell and tumor cells, and, therefore, ignore a critical component in its biology. To address this, we developed and validated an imaging-based assay to quantify and compare the ability of different anti-PD-1/PD-L1 antibodies to remove PD-1 from the immune synapse. We correlated that with the same antibodies' ability to increase cytokine secretion from the targeted cells. The strong correlation between PD-1 location and its function in vitro and in vivo within the antibody treatment setting validates this assay's usability, which is easily recordable and straightforward.
Key features
• Live-cell imaging quantifies and compares how anti-PD-1 and anti-PD-L1 antibodies disrupt PD-1 localization, causing the removal of PD-1 during immune synapse formation.
• Hao et al. [1] validated the protocol, and the findings were extended to a live confocal microscopy method.
• It requires a Zeiss LSM 900 confocal microscope and appropriate imaging software and is optimized for the latest version of Zen Blue.
• Anti-PD-1 antibodies are commonly used in cancer therapies, and this protocol optimizes the analysis of their effectiveness.
Keywords: PD-1 (PD-1)Graphical overview
Background
PD-1, or programmed cell death protein 1, is a protein found on the surface of T cells. PD-1 acts as a brake on T cells, preventing them from overreacting and attacking healthy tissues. This is important for maintaining immune tolerance and preventing autoimmune diseases. However, cancer cells can sometimes exploit the PD-1 pathway to evade immune attacks. They can do this by expressing high levels of PD-L1 (programmed cell death ligand 1), the ligand for PD-1 that inhibits T-cell activity, and in some cases also PD-L2, a higher-affinity ligand for PD-1 [2].
This is where PD-1 inhibitors come in. These drugs block the interaction between PD-1 and PD-L1, allowing T cells to recognize and destroy cancer cells [3,4]. PD-1 and PD-L1 inhibitors have revolutionized cancer treatment, and they are now used to treat a variety of cancers including melanoma, lung cancer, and head and neck cancer. Unlike traditional chemotherapy, which often has short-lived effects, anti-PD-1/PD-L1 antibodies can induce long-lasting tumor shrinkage and even complete remission in some patients. Compared to chemotherapy, anti-PD-1/PD-L1 antibodies have a more favorable side effect profile. While they can cause immune-related adverse events, these are generally less severe and more manageable than the toxicities associated with chemotherapy. Therefore, anti-PD-1/PD-L1 antibodies have become the standard of care for many cancer types, and their use is rapidly expanding to new applications. This provides more treatment options for patients with advanced or aggressive cancers who may not have had many choices before. Unfortunately, not all patients respond to anti-PD-1 therapy [5]. The reasons for this are complex and not fully understood. Still, it highlights the need for further research to identify biomarkers and in vitro assays that can predict who will benefit most from this treatment.
There are currently nine FDA-approved anti-PD-1/PD-L1 antibodies [6], each with its specific indications and potential side effects: pembrolizumab (Keytruda), nivolumab (Opdivo), cemiplimab (Libtayo), atezolizumab (Tecentriq), avelumab (Bavencio), durvalumab (Imfinzi), dostarlimab (Jemperli), toripalimab (Loqtorzi), and tislelizumab (Tevimbra). It is important to note that this is a partial list, and the number of anti-PD-1 and PD-L1 antibodies in clinical trials continually evolves. Still, over 100 different anti-PD-1 and PD-L1 antibodies are currently in various stages of clinical development, according to the ClinicalTrials.gov database [7]. This number encompasses multiple anti-PD-1/PD-L1 agents, including monoclonal antibodies, bispecific antibodies, and antibody-drug conjugates (ADCs).
With so many different anti-PD-1/PD-L1 antibodies in development, there are several reasons why in vitro assays are crucial for studying them. In vitro assays offer a safe and relatively inexpensive way to test the properties of these antibodies before moving to complex and expensive animal or human studies. In vitro assays provide a controlled environment to study antibodies' specific mechanisms of action [8]. They can help understand how these antibodies interact with PD-1/PD-L1, T, and cancer cells, ultimately leading to better drugs and treatment strategies. In vitro assays can also identify biomarkers that predict which patients are more likely to respond to specific anti-PD-1/PD-L1 therapy [9]. This personalized approach can help optimize treatment for individual patients and avoid unnecessary side effects for those unlikely to benefit. In vitro assays help compare different formulations or combinations of antibodies, allowing the optimization of their efficacy and safety before clinical trials.
Promega developed an assay to measure the ability of anti-PD-1/PD-L1 antibodies to block immune checkpoint signals [10]. The assay consists of two genetically engineered cell lines, PD-1 effector cells and PD-L1 aAPC/CHO-K1 cells. When cocultured, the PD-1/PD-L1 interaction inhibits T-cell receptor (TCR)-mediated luminescence. When the PD-1/PD-L1 interaction is disrupted, TCR activation induces luminescence via activation of the NFAT pathway, which can be detected by adding bio-glo reagent and quantitation with a luminometer. Another report described a flow cytometry assay to evaluate the T-cell binding status of the anti-PD-1 antibodies using a single drop of peripheral blood [11]. Another group established a PD-1/PD-L1 blockade assay based on surface plasmon resonance (SPR) biosensors [12]. This assay immobilizes human PD-1 on a sensor chip, where the binding kinetics of PD-L1 to PD-1 and the blockade rates of PD-1 inhibitors are determined. Compared to other techniques, such as PD-1/PD-L1 pair ELISA, this method offers real-time and label-free detection with advantages including shorter experimental runs and more minor sample quantity requirements. We and others have published in vitro assays used to study the effects of anti-PD-1 antibodies on T-cell proliferation, cytotoxicity (to assess the killing ability of T cells activated by PD-1 blockade against cancer cell lines), and cytokine secretion [13], providing insights into the immune response triggered by PD-1. While in vitro assays are valuable tools, they have limitations. They cannot fully replicate the complex interactions in the human body, and validating findings with in vivo studies and clinical trials is crucial.
The formation of a synapse between a T cell and a tumor cell is a crucial initiator of the immune response, with interactions between the major histocompatibility complex (MHC) and TCR being essential for T-cell activation and killing [14]. Synapse formation causes the clustering of proteins in different regions of the contact area, called supramolecular activation complexes (SMACs). SMACs can be further separated into different subregions: the central SMAC (cSMAC), the peripheral SMAC (pSMAC), and the distal-SMAC (dSMAC), where the cSMAC contains the proteins and checkpoint receptors of interest for this assay [15]. PD-1 and PD-L1 are a part of the group of molecules that centralize to the cSMAC during the formation of the synapse [16]. Interactions between PD-1 and PD-L1 activate the phosphatase SHP2, causing suppression of T-cell activity and overall immune response by preventing stable T-cell interactions from forming. PD-L1 and PD-1 can also develop microclusters within the cSMAC, contributing to their suppressive function [17]. The localization of PD-1 in the synapse when bound or unbound by antibodies allows it to be a prime target for studying the efficacy of different antibodies. Specifically, antibody binding mislocalizes PD-1 and prevents interaction with PD-L1 [1]. The exclusion of antibody-bound PD-1 can be considered size-based, as the immune synapse is observed to exclude molecules above a specific size limit [18]. Removing PD-1 from the synapse prevents PD-1/PD-L1 clustering within the cSMAC and interactions with PD-L1 for inhibitory function. As such, antibodies with different characteristics may affect the localization of PD-1 in the immune synapse to different degrees.
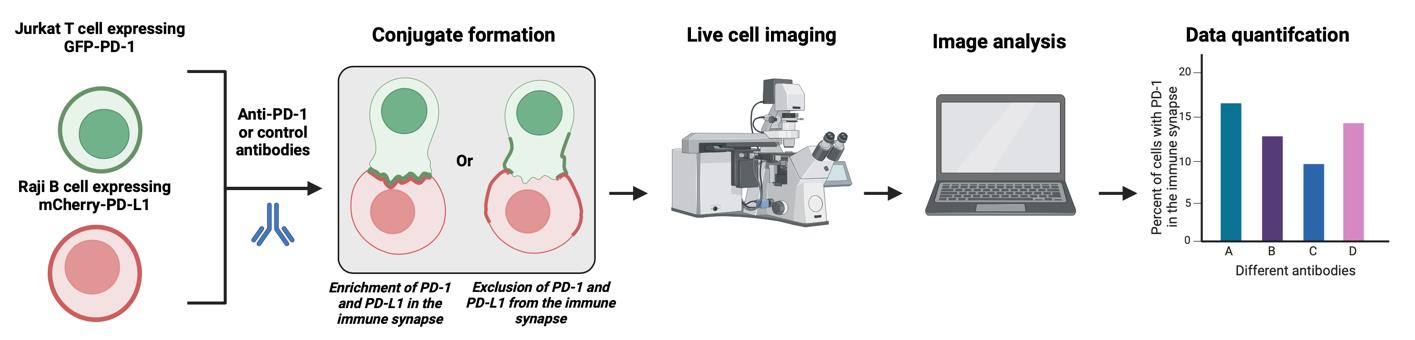
Previously, we reported an in vitro assay to study PD-1 signaling in primary human T cells [13], based on the phospho-flow cytometry method to determine how PD-1 ligation alters the levels of CD3ζ phosphorylation on Tyr142, which can be easily applied to other proximal signaling proteins. We also reported a plate-bound assay to examine the long-term consequences of PD-1 ligation, such as cytokine production and T-cell proliferation. We also described an in vitro superantigen-based assay to evaluate T-cell responses to therapeutic agents targeting the PD-1/PD-L1 axis and immune synapse formation in the presence of PD-1 engagement [13]. Based on this, we developed an imaging-based assay, described here. This protocol utilizes PD-1 GFP-expressing Jurkat T cells and PD-L1-/PD-L2 mCherry-expressing Raji B cells, yielding a model to study the function and location of anti-PD-1/PD-L1/PD-L2 antibodies in real time. This study design requires a Zeiss LSM 900 confocal microscope and an updated version of Zen Blue software, at least version 3.3. Compared with other methods of quantifying PD-1 antibody strength, such as flow cytometry, this method allows for both visual and numerical analysis of synapse formation between B and T cells, simultaneously providing qualitative and quantitative data. Furthermore, it enables live-cell imaging, captures temporal data, and gives insights into the dynamics of these interactions over time. This protocol was validated by Hao et al., 2024.
Materials and reagents
Biological materials
Jurkat T cells (ATCC, catalog number: TIB-152)
Raji B cells (ATCC, catalog number: CCL-86)
Staphylococcus enterotoxin E (SEE) ET404 1 mg (Toxin Technology, catalog number: NC1467973)
Reagents
RPMI 1640 (Thermo Fisher Scientific, GibcoTM, catalog number: 31800)
Opti-MEM (Thermo Fisher Scientific, catalog number: 11058021)
Heat-inactivated fetal bovine serum (FBS) (Thermo Fisher Scientific, GibcoTM, catalog number: 10082147)
Penicillin/streptomycin (P/S) (Thermo Fisher Scientific, GibcoTM, catalog number: 15140)
Human CD3/CD28/CD2 T-cell activator (StemCell Technologies, ImmunoCultTM, catalog number: 10970) (optional; see protocol)
10× Poly-L-Lysine (PLL) solution (0.1% w/v in H2O) (Sigma-Aldrich, Millipore, catalog number: P8920)
Trypan Blue stain (0.4%) (Thermo Fisher Scientific, InvitrogenTM, catalog number: T10282)
Molecular biology grade water (Corning, catalog number: 46-000-CI)
pHR-PD-1-GFP vector and pHR-PD-L1-mCherry vector (AddGene, catalog number: 180819) [19]
Solutions
1× Poly-L-Lysine solution (see Recipes)
RPMI (w/ FBS) media (see Recipes)
Staphylococcus enterotoxin E (SEE) working stock (see Recipes)
Recipes
1× Poly-L-Lysine solution
Reagent Final concentration Amount 10× PLL [0.1 % (w/v) in H2O] 1× 100 µL ddH2O n/a 900 µL Total n/a 1,000 µL RPMI (w/ FBS) media
Reagent Final concentration Amount RPMI 1640 n/a 500 mL FBS 10% 55 mL P/S 1% 5.5 mL Total n/a 560.5 mL Staphylococcus enterotoxin E (SEE) working stock (stored at -20 °C)
Reagent Final concentration Amount Staphylococcus enterotoxin E 1 mg/mL 20 µg ddH2O n/a 20 µL Total n/a 20 µL
Laboratory supplies
15 mL and 50 mL conical tube (Falcon, catalog numbers: 38009, 38010)
12-well cell culture plate (Thermo Fisher Scientific, catalog number: 150200)
Untreated cell culture flask with vent cap (Thermo Fisher Scientific, CorningTM, catalog number: 431463)
MatTek Plates (50 mm dish, No. 0 coverslip, 14 mm glass diameter, uncoated) (MatTek, catalog number: P50G-0-14-F)
Single-channel pipette, Pipetman 0.2–2 µL, 1–10 µL, 2–20 µL, 20–200 µL, 100–1,000 µL (Gilson, catalog numbers: F144054M, F144055M, F144058M, F144059M)
Filtered pipette tips (USA Scientific)
1.5 mL microcentrifuge tubes (Fisher Scientific, catalog number: 05-408-129)
Immersol autofluorescence-free immersion oil 518 F (Zeiss, catalog number: 444960-0000-000)
Aluminum foil (Amazon brand)
Cell counting chamber slides (CountessTM, catalog number: C10228)
KOVATM GlassticTM slide 10 with grids (Fisher Scientific, catalog number: 22-270141)
Cell culture multiwell plate 24 wells (Grenier Bio-One, catalog number: 662160)
Equipment
Confocal microscope (Zeiss, model: LSM 900)
Heracell 150i CO2 incubator (37 °C, 5% CO2) (Thermo Fisher Scientific, catalog number: 50116048)
Digital miniblock heater (VWR, catalog number: 460-0334)
Automated cell counter (InvitrogenTM, CountessTM, catalog number: AMQAX2000)
FisherbrandTM manual differential counter (Fisher Scientific, catalog number: 13-684-141)
5425 centrifuge (Eppendorf, catalog number: 5405000646)
5810R centrifuge (Eppendorf, catalog number: 022625501)
Software and datasets
Image J (Version 1.54)
Zen (Version 3.3 Blue Edition)
Procedure
文章信息
稿件历史记录
提交日期: Apr 12, 2024
接收日期: Jul 14, 2024
在线发布日期: Aug 8, 2024
出版日期: Sep 5, 2024
版权信息
© 2024 The Author(s); This is an open access article under the CC BY-NC license (https://creativecommons.org/licenses/by-nc/4.0/).
如何引用
Zhong, J. C., Lerrer, S. and Mor, A. (2024). An Imaging-Based Assay to Measure the Location of PD-1 at the Immune Synapse for Testing the Binding Efficacy of Anti-PD-1 and Anti-PD-L1 Antibodies. Bio-protocol 14(17): e5057. DOI: 10.21769/BioProtoc.5057.
分类
免疫学 > 抗体分析 > 抗体-抗原相互作用
细胞生物学 > 细胞成像 > 共聚焦显微镜
免疫学 > 免疫疗法
您对这篇实验方法有问题吗?
在此处发布您的问题,我们将邀请本文作者来回答。同时,我们会将您的问题发布到Bio-protocol Exchange,以便寻求社区成员的帮助。