

Streamlining Protein Fractional Synthesis Rates Using SP3 Beads and Stable Isotope Mass Spectrometry: A Case Study on the Plant Ribosome
利用SP3珠和稳定同位素质谱技术优化蛋白质合成速率:植物核糖体的案例研究
发布: 2024年05月05日第14卷第9期 DOI: 10.21769/BioProtoc.4981 浏览次数: 3078
评审: Alba BlesaPiao YangOm Prakash Narayan
参见作者原研究论文
The authors used this protocol in:

Nov 2022
Advertisement


Abstract
Ribosomes are an archetypal ribonucleoprotein assembly. Due to ribosomal evolution and function, r-proteins share specific physicochemical similarities, making the riboproteome particularly suited for tailored proteome profiling methods. Moreover, the structural proteome of ribonucleoprotein assemblies reflects context-dependent functional features. Thus, characterizing the state of riboproteomes provides insights to uncover the context-dependent functionality of r-protein rearrangements, as they relate to what has been termed the ribosomal code, a concept that parallels that of the histone code, in which chromatin rearrangements influence gene expression. Compared to high-resolution ribosomal structures, omics methods lag when it comes to offering customized solutions to close the knowledge gap between structure and function that currently exists in riboproteomes. Purifying the riboproteome and subsequent shot-gun proteomics typically involves protein denaturation and digestion with proteases. The results are relative abundances of r-proteins at the ribosome population level. We have previously shown that, to gain insight into the stoichiometry of individual proteins, it is necessary to measure by proteomics bound r-proteins and normalize their intensities by the sum of r-protein abundances per ribosomal complex, i.e., 40S or 60S subunits. These calculations ensure that individual r-protein stoichiometries represent the fraction of each family/paralog relative to the complex, effectively revealing which r-proteins become substoichiometric in specific physiological scenarios. Here, we present an optimized method to profile the riboproteome of any organism as well as the synthesis rates of r-proteins determined by stable isotope-assisted mass spectrometry. Our method purifies the r-proteins in a reversibly denatured state, which offers the possibility for combined top-down and bottom-up proteomics. Our method offers a milder native denaturation of the r-proteome via a chaotropic GuHCl solution as compared with previous studies that use irreversible denaturation under highly acidic conditions to dissociate rRNA and r-proteins. As such, our method is better suited to conserve post-translational modifications (PTMs). Subsequently, our method carefully considers the amino acid composition of r-proteins to select an appropriate protease for digestion. We avoid non-specific protease cleavage by increasing the pH of our standardized r-proteome dilutions that enter the digestion pipeline and by using a digestion buffer that ensures an optimal pH for a reliable protease digestion process. Finally, we provide the R package ProtSynthesis to study the fractional synthesis rates of r-proteins. The package uses physiological parameters as input to determine peptide or protein fractional synthesis rates. Once the physiological parameters are measured, our equations allow a fair comparison between treatments that alter the biological equilibrium state of the system under study. Our equations correct peptide enrichment using enrichments in soluble amino acids, growth rates, and total protein accumulation. As a means of validation, our pipeline fails to find “false” enrichments in non-labeled samples while also filtering out proteins with multiple unique peptides that have different enrichment values, which are rare in our datasets. These two aspects reflect the accuracy of our tool. Our method offers the possibility of elucidating individual r-protein family/paralog abundances, PTM status, fractional synthesis rates, and dynamic assembly into ribosomal complexes if top-down and bottom-up proteomic approaches are used concomitantly, taking one step further into mapping the native and dynamic status of the r-proteome onto high-resolution ribosome structures. In addition, our method can be used to study the proteomes of all macromolecular assemblies that can be purified, although purification is the limiting step, and the efficacy and accuracy of the proteases may be limited depending on the digestion requirements.
Key features
• Efficient purification of the ribosomal proteome: streamlined procedure for the specific purification of the ribosomal proteome or complex Ome.
• Accurate calculation of fractional synthesis rates: robust method for calculating fractional protein synthesis rates in macromolecular complexes under different physiological steady states.
• Holistic ribosome methodology focused on plants: comprehensive approach that provides insights into the ribosomes and translational control of plants, demonstrated using cold acclimation [1].
• Tailored strategies for stable isotope labeling in plants: methodology focusing on materials and labeling considerations specific to free and proteinogenic amino acid analysis [2].
Keywords: Ribo-proteome (核糖体蛋白质组)Graphical overview
Some of the illustrations in the graphical abstract were created and exported under a paid license with BioRender
Background
Throughout the tree of life (TOL), ribosomes play a pivotal role in synthesizing all proteins by decoding mRNA [3]. The most precise representations of the TOL to date have been crafted using aligned genomic sequences of ribosomal RNA (rRNA) and ribosomal proteins (r-proteins) [4–7]. This centrality underscores the significance of ribosomal components, many of which feature prominently in the universal gene set of life (UGSL) [8]. The UGSL comprises orthologous genes conserved across the phylogenetic TOL, altered only through speciation while retaining their fundamental functions [9–11]. The interaction of r-proteins and rRNAs throughout the TOL has necessitated a conserved, basic, structural riboproteome. In opisthokonts, the complex has significantly increased in size, both in terms of rRNA expansion segments and in number of associated r-proteins [3]. The r-proteins themselves have become more complex and, in many cases, acquired new functions. Among acquired functionality, ribosomes have gained the ability to selectively decide which transcripts to translate, a concept known as ribosome specialization [12,13]. For example, ribosomal populations enriched in RPL10 translate transcripts subsets [14], and ribosomes lacking RPS26 preferentially translate transcripts from stress-response pathways [15]. To what extent and what proportion of the r-proteome has acquired these types of adaptations remains unknown. Nevertheless, it is becoming increasingly clear that the composition of riboproteomes at a given time reflects structural and functional features of ribosomes [15–17] and grants them the ability to control translational output and shape protein expression.
The field of structural systems biology has progressed greatly in recent years due to the convergence of atomic structures, which provide an average scaffold of macromolecular complexes, and omics studies, which elucidate the relative or absolute abundances of their structural components in vivo [18]. Ribosomes have driven the convergence of these methods due to their ubiquitous and essential nature in the cellular environment. Ribosome structures can currently be highly resolved, reaching near-atomic resolution [19–21]. On the other hand, omics methods lag in providing tailored solutions to fully decipher the general status of riboproteomes. Although methods such as transcriptomics or translatomics can monitor gene expression in a significant percentage of the expressed genome, a gap remains between transcriptional regulation and the abundance of active protein pools [22]. Recent efforts include advanced mass spectrometry methods to elucidate different features of r-proteins [23], such as absolute quantification using synthetic peptide standards [14]. These examples make it clear that multiplexing methods will help to overcome the limitation of studying riboproteomes at the ribosome population level.
We focused on three major obstacles that currently prevent the thorough investigation of r-proteins. First, multiplexing requires the purification of riboproteomes in a pseudo-native state that conserves protein features to elucidate different aspects of their biology. Second, the analysis of r-proteins following protease digestion requires careful consideration of the amino acid composition, which includes many basic peptide stretches required for interacting with rRNA. Finally, many translational studies often fail to bridge the gap between translatome and proteome. Currently, the best method to monitor the translational output from ribosomes is Ribo-Seq [24], which has been optimized in plant systems [25] but fails to provide measurements of de novo synthesized proteins. Moreover, typical translational studies deal with organisms that transition between biological steady states. These transitions complicate the use of technologies such as in vivo stable-isotope labeling and mass spectrometry to monitor protein synthesis, as quantification of tracer incorporation assumes steady-state conditions.
Here, we set out to provide a standardized methodology to overcome these three limitations while addressing a previously unsolved biological question in plant translation [1]. To deal with the first limitation, we developed a strategy to purify the r-proteome as close as possible to its native state by using a chaotropic agent to dissociate r-proteins from rRNA. Our purification strategy enhances both top-down and bottom-up proteomics methods, as previously described by others [23], by capturing r-proteins with paramagnetic SP3 beads [26–28]. To bypass the second limitation, we carefully consider our choice of an optimal protease to digest ribosomal proteins across the TOL. We validate that our protease yields larger peptides and thus allows for a more comprehensive profiling of the r-proteome from bacteria to higher metazoans. To address the third limitation, we provide an R package called ProtSynthesis (https://github.com/MSeidelFed/ProtSynthesis), in which we developed physiological and data-based assumptions required to quantify tracer incorporation and fractional protein synthesis rates in organisms shifting between biological states, using plant cold acclimation as an example [1,29,30]. Our method uses organismal physiology in the treated vs. non-treated condition to make fractional synthesis rates comparable. First, we quantify the enrichment percentage in soluble amino acid pools and use them to constrain the maximum amount of nitrogen atoms that could have incorporated the label in specific peptide sequences, thus correcting for biases in 15N incorporation into soluble amino acid pools across conditions. Secondly, treatments often induce differences in growth, and we calculate relative growth rates to normalize fractional protein synthesis. Finally, because the most direct measurement of translation is protein content, we correct our relative growth rates to reflect the percentage of protein accumulated per unit of time. In summary, our calculations comprehensively incorporate organism physiology to enhance the comparison between fractional protein synthesis rates across different biological steady states, such as cold-acclimated plants vs. plants reared at optimal temperatures. Beyond cold acclimation, there are plant examples in which biological steady state shifts occur concomitantly to surmised translational reprogramming, which could profit from our methodology. For instance, 3',5'-cAMP supplementation induces spatially constrained rearrangements of the r-proteome in Arabidopsis [31]. Similarly, flg22 induces dissociation of the P-Stalk via the activation of Mitogen-activated protein kinase 6 pathway, influencing plant immunity to bacteria [16]. These examples set an ideal stage for inquiring about changes in the synthesis and assembly of the r-proteome and how it affects protein synthesis, i.e., what is the functional translational implication of remodeling the r-proteome. To summarize, we provide a comprehensive methodology to couple the most accurate methodology to study translational efficiencies (Ribo-Seq) to r-protein and proteome-wide fractional protein synthesis rates.
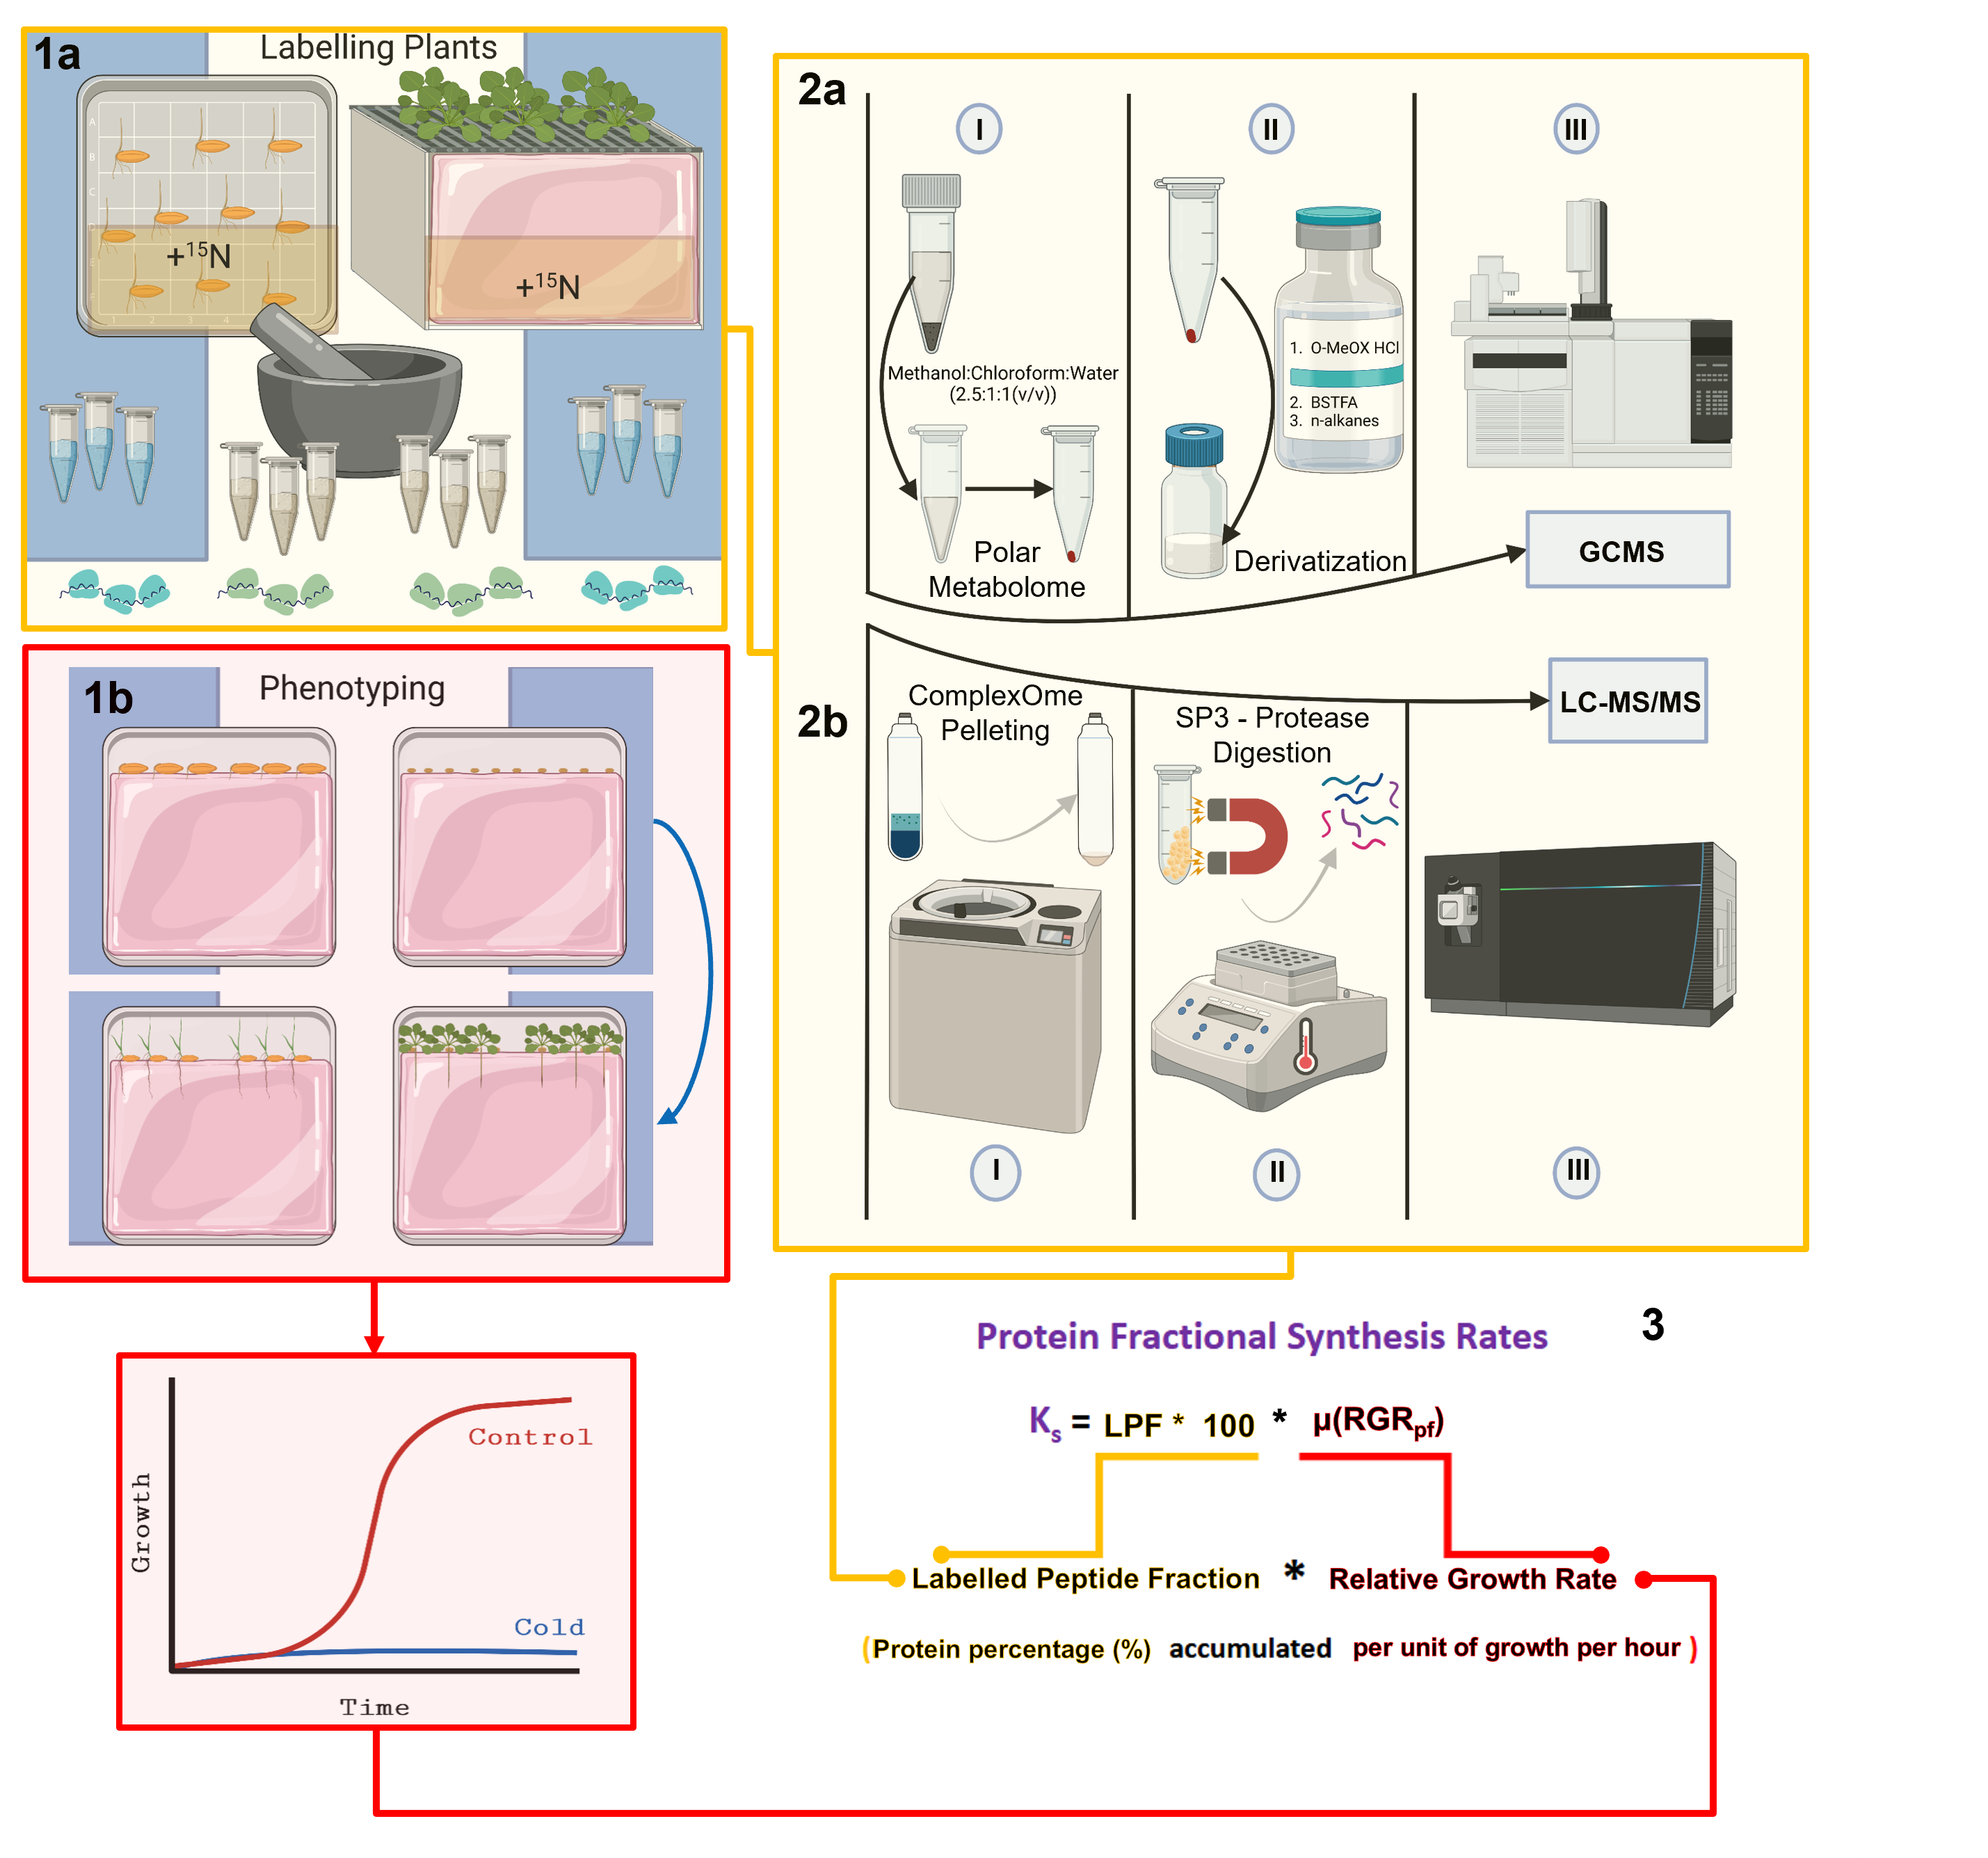
Summary
Our method contains five steps that are depicted in the graphical abstract. Step 1a entails labeling the biological specimens in a manner tailored to each organism. The required methodology, including materials and labeling considerations for plants, is discussed in detail elsewhere [2]. Step 1b entails a detailed phenotypic analysis of the organism of interest upon applying a specific treatment that produces a shift from the previous biological steady state. For phenotyping and growth analyses of plants, we use and recommend the classical definition of relative growth rates that has been discussed extensively in the literature over the last century [32–34] based on the first postulation of an efficiency index by Blackman, 1919 [35], which is equivalent to the relative growth rate. Step 2a accounts for differential labeling efficiency in soluble amino acid pools at the onset of the investigated physiological transition. The methodology for obtaining the primary metabolome and measuring metabolite abundances by gas chromatography–mass spectrometry has been described elsewhere [2]. The contents of the manuscript detail the procedure to purify and profile a complexOme or ribosomal proteome (Step 2b) and elaborate on the data analyses and further considerations needed to calculate protein fractional synthesis rates from protein components of isolated complexes (Step 3).
Materials and reagents
Biological materials
Apical root meristems of germinating seedlings from Barley (Hordeum vulgare cultivar Keel) obtained from The University of Melbourne from previous studies [36] (Note 1)
Escherichia coli 70S ribosomes (New England BioLabs, catalog number: P0763S); one tube of 1 mg is enough as internal standard for the protocol detailed below
Guanidine hydrochloride (GuHCl) (Sigma-Aldrich, catalog number: G3272)
Trifluoracetic acid (TFA) (Thermo Fisher Scientific, catalog number: 85183)
PierceTM BCA Protein Assay kit (Thermo Fisher Scientific, catalog number: 23227)
Water, molecular biology grade, DNase and RNase free (Research Products International, catalog number: 248700)
Triethylammonium bicarbonate buffer (TEAB) (Sigma-Aldrich, catalog number: T7408)
Tris(2-carboxyethyl) phosphine hydrochloride (TCEP) (Macherey-Nagel, catalog number: 740395.107)
Iodoacetamide (IAA) (Sigma-Aldrich, catalog number: I5161)
Acetonitrile (Acn) (Sigma-Aldrich, catalog number: 271004)
Sera-MagTM SpeedBad carboxilated-modified magnetic particles [GE Healthcare, catalog number: 45152105050250 (hydrophilic); 65152105050250 (hydrophobic)]
Ethanol absolute, suitable for HPLC, ≥99.8% (Sigma-Aldrich, catalog number: 34852-M)
Endoproteinase Lys-C (New England Biolabs, catalog number: P8109S)
Trizma(R)-hydrochloride solution, pH 9.0, RNase free (Sigma-Aldrich, catalog number: 1185-53-1)
Nuclease-Free Water, for Molecular Biology (Sigma-Aldrich, 7732-18-5)
Potassium chloride (KCl) (2 M), RNase free (Sigma-Aldrich, catalog number: AM9640G)
EGTA (sigma-Aldrich, catalog number: 324626)
Magnesium chloride solution (MgCl2) (1 M), RNase free (Sigma-Aldrich, catalog number: M1028)
Chloramphenicol (Cm) (Sigma-Aldrich, catalog number: C0378)
Cycloheximide (CHX) (Research Products International, catalog number: 50488631)
Dithiothreitol (DTT) (Sigma-Aldrich, catalog number: D0632)
Protease inhibitor cocktail (Pi) (Sigma, catalog number: P9599)
Phenylmethylsulphonyl fluoride (PMSF) (Thermo Fisher Scientific, catalog number: 36978)
Resuspension buffer (see Recipes)
6 M GuHCl (see Recipes)
50% (v/v) TFA (see Recipes)
500 mM TCEP (see Recipes)
55 mM IAA (see recipes)
Digestion buffer and endoproteinase Lys C working solution (see Recipes)
80% Acn, 0.1% TFA (v/v) (see Recipes)
Recipes
Resuspension buffer (10 mL)
*Prepare all necessary stocks before starting the protocol. The recommendation is to prepare a pre-resuspension buffer and store at 4 °C; all stocks, except for the small molecules, must be filtered through a 0.22 μm filter or autoclaved. Subsequently, just before usage in resuspension, add the translational stallers and reducing agents, i.e., Cm, CHX, DTT, PMSF, and Pi.
Reagent Final concentration Volume TRIS HCl (1 M, pH 9.0) 200 mM 2 mL KCl (2 M) 200 mM 1 mL EGTA (500 mM, pH 8.0) 25 mM 500 μL MgCl2 (1 M) 35 mM 350 μL RNase-free water n/a 5.94 mL CHX (180 mM) 0.18 mM 10 μL DTT (1 M) 5 mM 50 μL PMSF (200 mM) 1 mM 50 μL Pi (100×) 1× 100 μL Total n/a 10 mL 6 M GuHCl (10 mL)
*Prepare fresh every time.
Reagent Final concentration Quantity GuHCl 6 M 5.73 g RNase-free water n/a Up to 10 mL Total n/a 10 mL 50% TFA (1 mL)
*Prepare fresh every time. Caution: prepare in fume hood.
Reagent Final concentration Volume TFA 50% 500 μL RNase-free water n/a 500 μL Total n/a 1 mL 500 mM TCEP (750 μL)
*Prepare working solution of reducing agent TCEP according to manufacturer instructions. Dissolving the material in water might take several minutes; mix several times. After reconstitution, the solution should be stored at -20 °C and is stable for at least six months.
Reagent Final concentration Quantity TCEP 500 mM 107 mg RNase-free water n/a 750 μL Total n/a 750 µL 55 mM IAA (3 mL)
* IAA is light sensitive. The solution should be freshly prepared, and the incubations should be performed in the dark.
Reagent Final concentration Quantity IAA 55 mM 56 mg TEAB (1 M) 25 mM 3 mL Total n/a 3 mL Digestion buffer and endoproteinase Lys-C
*The quantity of endoproteinase Lys-C needed depends on the number of samples and the protein amount in each sample. Consider that, even if the Lys-C protease stock is the same, the volume of 25 mM TEAB can be different if the amount of protein in the samples is different.
Reagent Final concentration Quantity or Volume TEAB (1 M) 25 mM 10:1 (v/w) TEAB/protein Endoproteinase Lys-C (20 µg) n/a 1:20 (w/w) Lys-C/protein Total n/a n/a 80 % Acn, 0.1 % TFA (75 mL)
Reagent Final concentration Quantity or Volume Acn 80% 60 mL TFA (50 %) 0.1% 150 µL RNase-free water n/a 14,850 µL Total n/a 75 mL
Laboratory supplies
Ice
Ice bucket
Pipettes: 10 μL, 200 μL, 1,000 μL
Tips: 10 μL, 200 μL, 1,000 μL
Ultracentrifugation tubes, 1 mL, open-top thickwall polycarbonate (Beckman Coulter, catalog number: 343778)
Ultracentrifugation tubes (Beckman Coulter, catalog number: 326819)
2 mL safe-lock tubes (Eppendorf, catalog number: 0030120094)
1.5 mL safe-lock tubes (Eppendorf, catalog number: 0030120086)
96-well plates (Sarstedt, catalog number: 1581100)
Aluminum foil
pH indicator paper (Macherey-Nagel, catalog number: 90204)
Solid phase extraction (SPE) cartridges (Waters, catalog number: 186000383)
Equipment
-80 °C deep freezer (SANYO, model: MDF-U 72 V)
Balance XS105 (Mettler-Toledo, catalog number: 30132870)
SW55 Ti rotor (Beckman Coulter, Krefeld, model: 55 Ti)
Ultracentrifuge (Beckman Coulter, Krefeld, model: Optima XPN)
Optima MAX-XP ultracentrifuge (Beckman Coulter, catalog number: 393315)
MLA-130 fixed angle rotor (Beckman Coulter, model: Krefeld, model: MLA-130)
Vortex mixer (Bender & Hobein, model: G560-E)
Fume hood (Waldner, model: Airflow Controller AC2)
High-speed centrifuge (Eppendorf, model: 5417R)
Incubation room set to 37 °C (Note 2)
Thermomixer (Eppendorf, catalog number: 5382000015)
Microplate reader (BioTek Elisa ELx808, model: 25-315S)
Magnetic rack (Invitrogen, DynaMag-2, model: 12321D)
Speed-vac (LaboGene, model: SCANVAC CoolSafe100-9 PROSuperior XS)
Freeze-dryer (Christ, model: Alpha 2-4 LSCbasic)
Orbitrap mass spectrometer (Thermo Fisher Scientific, model: Eclipse) equipped with a nanoflow HPLC (Ultimate 3000 RSLC, Dionex)
Software and datasets
Absorbance plate reader software (BioTek, Gen5 2.09, 04/2022)
Microsoft Office software (Microsoft)
MaxQuant (above version 2.4, 04/2022)
R statistical language (above version 3.10, 06/2023)
R package ProtSynthesis (https://github.com/MSeidelFed/ProtSynthesis) (Access date, 05/2022)
Python (above version 3, 04/2021)
Python Script IsotopeEnrichment (https://github.com/mgleeming/isotopeEnrichment) (Access date, 05/2022)
Procedure
文章信息
版权信息
© 2024 The Author(s); This is an open access article under the CC BY-NC license (https://creativecommons.org/licenses/by-nc/4.0/).
如何引用
Gentry-Torfer, D., Murillo, E., Barrington, C. L., Nie, S., Leeming, M. G., Suwanchaikasem, P., Williamson, N. A., Roessner, U., Boughton, B. A., Kopka, J. and Martinez-Seidel, F. (2024). Streamlining Protein Fractional Synthesis Rates Using SP3 Beads and Stable Isotope Mass Spectrometry: A Case Study on the Plant Ribosome. Bio-protocol 14(9): e4981. DOI: 10.21769/BioProtoc.4981.
分类
植物科学 > 植物生物化学 > 蛋白质 > 分离和纯化
系统生物学
您对这篇实验方法有问题吗?
在此处发布您的问题,我们将邀请本文作者来回答。同时,我们会将您的问题发布到Bio-protocol Exchange,以便寻求社区成员的帮助。