

Absolute Quantification of mRNA Isoforms in Adult Stem Cells Using Microfluidic Digital PCR
使用微流控数字 PCR 对成体干细胞中 mRNA 亚型进行绝对定量
发布: 2023年09月05日第13卷第17期 DOI: 10.21769/BioProtoc.4811 浏览次数: 1857
评审: Philipp WörsdörferSébastien GillotinHeng Sun
参见作者原研究论文
The authors used this protocol in:

Nov 2019


Abstract
Adult stem cells play key roles in homeostasis and tissue repair. These cells are regulated by a tight control of transcriptional programs. For example, muscle stem cells (MuSCs), located beneath the basal lamina, exist in the quiescent state but can transition to an activated, proliferative state upon injury. The control of MuSC state depends on the expression levels of myogenic transcription factors. Recent studies revealed the presence of different mRNA isoforms, with distinct biological regulation. Quantifying the exact expression levels of the mRNA isoforms encoding these myogenic transcription factors is therefore key to understanding how MuSCs switch between cell states. Previously, quantitative real-time polymerase chain reaction (qRT-PCR) has been used to quantify RNA expression levels. However, qRT-PCR depends on large amounts of RNA input and only measures relative abundance. Here, we present a protocol for the absolute quantification of mRNA isoforms using microfluidic digital PCR (mdPCR). Primary MuSCs isolated from individual skeletal muscles (gastrocnemius and masseter) are lysed, and their RNA is reverse-transcribed into cDNA and copied into double-stranded DNA. Following exonuclease I digestion to remove remaining single-stranded DNA, the samples are loaded onto a mdPCR chip with TaqMan probes targeting the mRNA isoforms of interest, whereupon target molecules are amplified in nanoliter chambers. We demonstrate that mdPCR can give exact molecule counts per cell for mRNA isoforms encoding the myogenic transcription factor Pax3. This protocol enables the absolute quantification of low abundant mRNA isoforms in a fast, precise, and reliable way.
Graphical overview
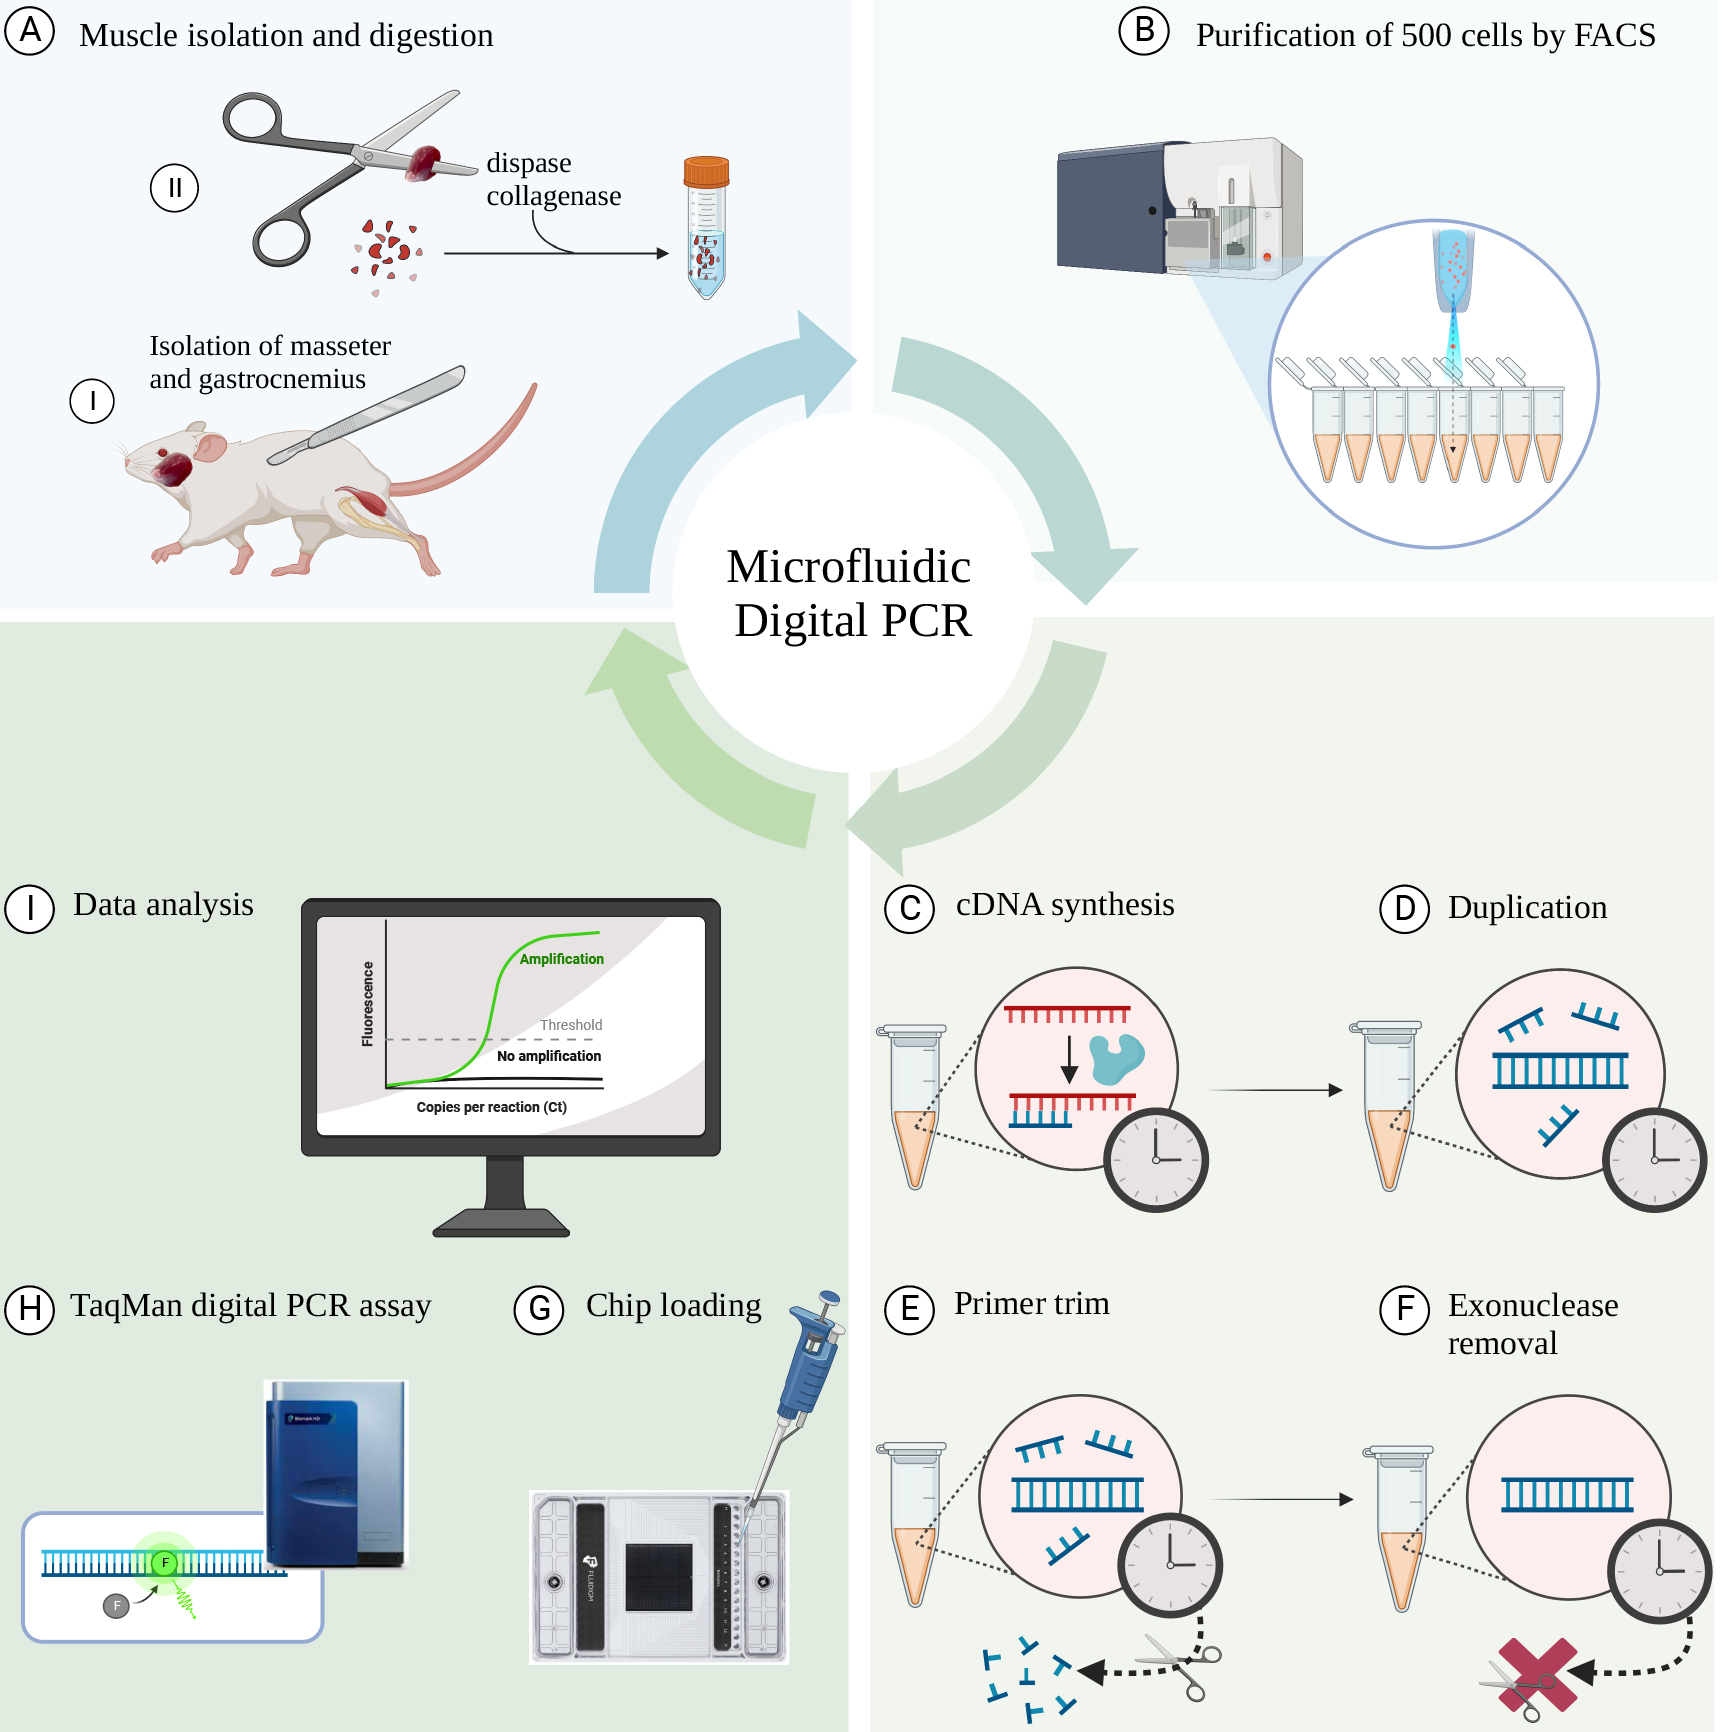
Schematic overview of the workflow. (A) Isolation of individual muscles (gastrocnemius and masseter) from C57/BL6 mice followed by digestion using collagenase II and dispase. (B) Sorting of 500 cells directly into PCR tubes using fluorescence-activated cell sorting (FACS). (C) Reverse transcription of mRNA to cDNA. (D) Polymerase reaction to generate a duplicated cDNA product. (E) Exonuclease I digestion to remove remaining single-stranded DNA and the non-hybridized primers. (F) Denaturation step to inactivate exonuclease I. (G) Loading the samples into the microfluidic chip. (H) Running the TaqMan Digital PCR assay in the Fluidigm Biomark HD real-time PCR machine. (I) Data analysis using the Digital PCR software.
Background
Muscle stem cells (MuSCs) reside beneath the basal lamina of skeletal muscle fibers and maintain a state of quiescence (de Morree and Rando, 2023). Upon injury, the MuSCs switch from quiescence to activation, giving rise to proliferating progenitors that will eventually differentiate and fuse with myofibers (Yin et al., 2013;Relaix et al., 2021). To understand the exit from quiescence and how the myogenic fate is determined, it is important to understand the factors that maintain or break the quiescent state The transcription factor Pax3 plays a key role in myogenesis. In the absence of Pax3, embryonic MuSCs fail to expand and migrate, and no muscle is formed, resulting in embryonic lethality (Relaix et al., 2005). Recent work revealed that thePax3gene generates multiple mRNA isoforms with different 3′UTRs in MuSCs from adult mice (Boutet et al., 2012; de Morree et al., 2019). One of the isoforms of Pax3 mRNA has a long 3′UTR containing microRNA binding sites, is translationally repressed by the microRNA 206, and is linked to quiescence (Figure 1). The other has a short 3′UTR lacking the microRNA binding sites, is not translationally repressed, and is linked to activation and cell cycle entry of MuSCs (de Morree et al., 2019). Therefore, it is important to understand Pax3 isoform expression patterns in MuSCs, as quantifying the two isoforms of Pax3 will contribute to understanding its role in MuSCs quiescence and activation.
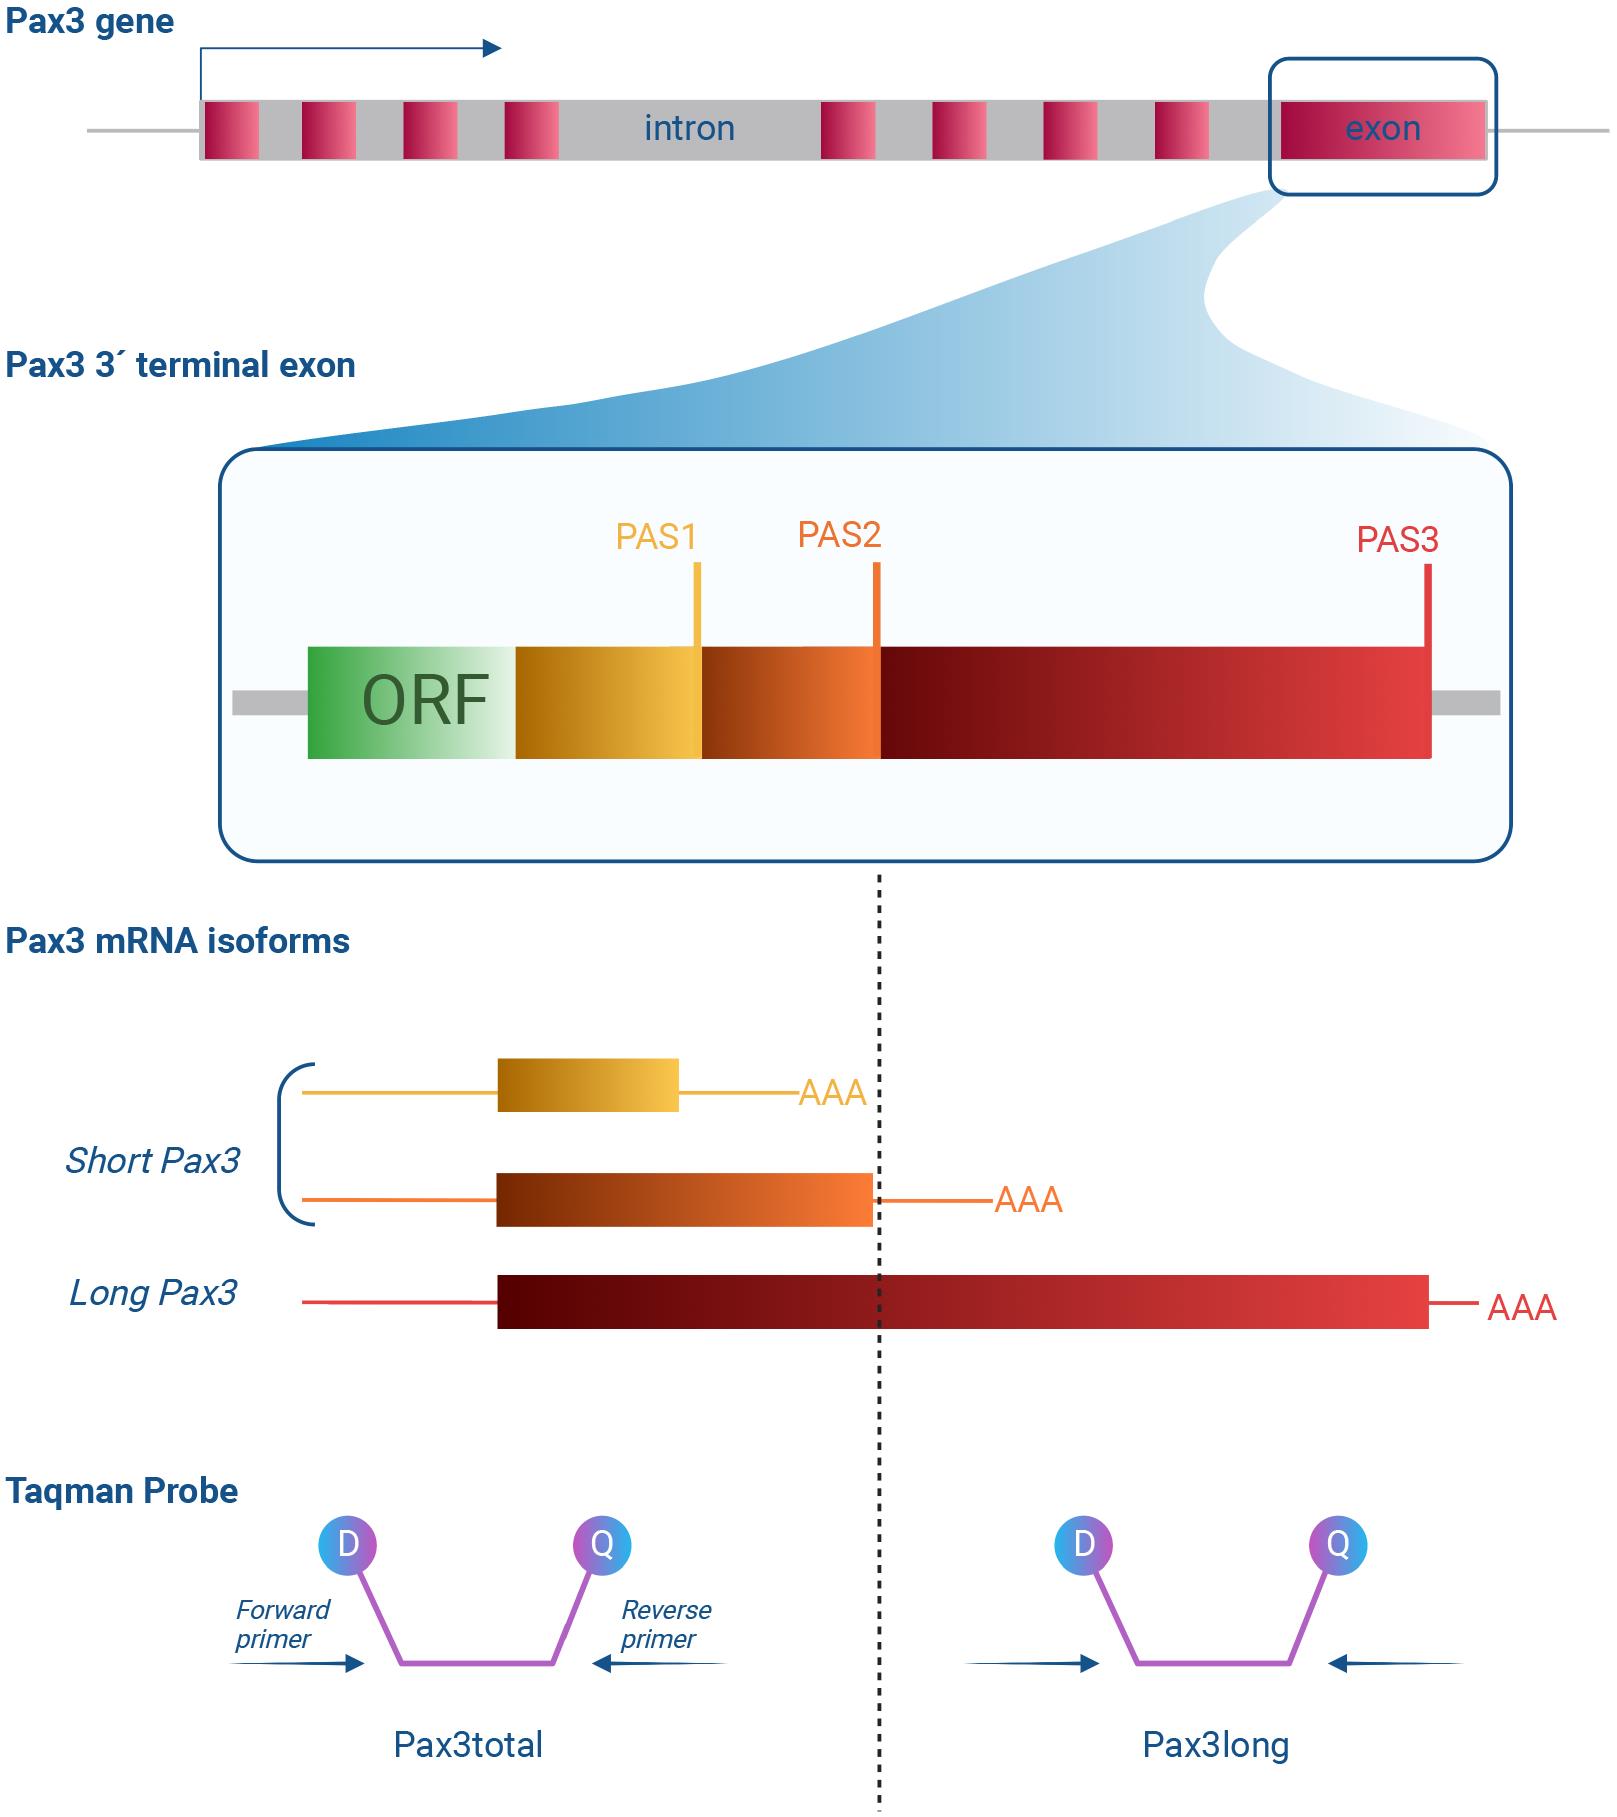
Figure 1. Schematic figure depicting how the TaqMan probes, Pax3total and Pax3long, target their respective target sites on the Pax3 3′ terminal exon. Top: a schematic of thePax3gene with boxes denoting exons. The 3′ terminal exon is enhanced, and the open reading frame (ORF) coding part is highlighted, as well as the three polyadenylation sites (PASs) present in the 3′ untranslated region (3′UTR). Bottom: three major Pax3 mRNA isoforms are represented. All contain the complete ORF (not depicted) but differ in the length of the 3′UTR due to the selection of different PASs. These isoforms can be detected with TaqMan probes. The Pax3total TaqMan probes hybridize to sequences that are present in both long and short isoforms of Pax3. The Pax3long TaqMan probes hybridize to sequences that are present only in long isoform of Pax3. Each TaqMan probe contains a reporter dye and a quencher. During the polymerase reaction, the dye and the quencher are separated from the target sequence; as a result, fluorescence increases.
Quantitative real-time polymerase chain reaction (qRT-PCR) is often considered as the gold standard for measuring mRNA expression levels, despite many factors of variability such as RNA templates, inconsistent data analysis, and data normalization (Nolan et al., 2006). This method uses intercalating fluorescent dyes to assess transcript abundance during a PCR amplification. Though effective, it cannot measure exact copy numbers and requires a reference gene like GAPDH or HPRT to calculate relative expression levels. These reference genes are used because they are considered stably expressed in all cells. However, they may not be (Kozera and Rapacz, 2013). MuSCs undergo a 6-fold increase in size during activation (Rodgers et al., 2014;Brett et al., 2020). Thus, the change in cell volume may affect the interpretation of relative quantification by qRT-PCR, complicating the interpretation of how much Pax3 is expressed in cells. Instead, several adaptations have been made that enable single molecule quantification using a technique called digital PCR (Mao et al., 2019). In digital PCR, the total reaction volume is partitioned into small reaction chambers at a dilution so that 5%–65% of the small reaction chambers contain a single molecule of target cDNA. Then, a PCR amplification is performed to amplify those molecules, enabling the researcher to simply score for each small reaction chamber whether a PCR reaction took place or not. This digital assessment can then be calculated into an exact number of molecules present in the original reaction volume using Poisson statistics. Recent technologies that enable the formation of small droplets (droplet digital PCR) made digital PCR more routinely accessible (Hindson et al., 2013;Mao et al., 2019).
However, while droplet digital PCR enables the low-cost quantification of absolute mRNA levels, there is a variability between droplets that lowers the precision (Emslie et al., 2019), which is key when measuring low-abundant transcripts. Here, we use a parallel technology, microfluidic digital PCR (mdPCR), in which the sample is partitioned in microfluidic nanochambers (see Graphical overview). These nanochambers are uniform and enable highly reproducible amplification reactions, to enable the absolute quantification of low abundant transcripts with high accuracy. We previously applied this protocol to find that MuSCs isolated from lower hindlimb muscle expressed on average three molecules of Pax3 mRNA, two thirds of which were long isoforms. In contrast, MuSCs isolated from the diaphragm muscle expressed on average 10 molecules of Pax3 mRNA, one third of which were long isoforms (de Morree et al., 2019).
This protocol can also be used to quantify mRNA isoforms in other stem cell types, such as muscle-resident fibroadipogenic progenitors, which play important roles in homeostasis and repair of multiple tissues (Joe et al., 2010;Uezumi et al., 2010). The levels of mRNA isoforms can be quantified accurately across different cell states. Expression of disease genes along the progression of a disease can also be studied using mdPCR. Finally, the efficacy of therapies that change relative isoform abundance, such as exon-skipping for Duchenne Muscular Dystrophy, can be assessed with mdPCR (Verheul et al., 2016). Hence, this protocol can be used both in basic biology and translational studies.
Materials and reagents
GE 48.48 Dynamic Array Reagent kit with control line fluid, 10 IFCs (Fluidigm, catalog number: 85000800) (contains the control line fluid, 20× GE Sample Loading Reagent)
TE buffer, pH 8.0 (Teknova, catalog number: T0224)
CellsDirect One Step qRT-PCR kit (Life Technologies Invitrogen, Thermo Fisher Scientific, catalog number: 46-7201)
TaqMan Fast Advanced Master Mix (Applied Biosystems, Thermo Fisher Scientific, catalog number: 444455)
Pipettes (p10, p20, p200, p1000) (Mettler Toledo, Rainin Pipet-Lite XLS+)
Cells of interest (we used MuSCs for the protocol)
Ethanol 70% (v/v) (TechniSolve®, VWR Chemicals)
Exonuclease I and buffer (New England Biolabs, M0658S)
PCR strip of 8,200 μL, PCR performance tested, transparent, PP, flat cap (Sarstedt, catalog number: 72.991.002)
12.765 Digital ArrayTMIFC (Standard Biotools, Fluidigm, BMK-M-12.765)
TaqMan probe Pax3total (Boutet et al., 2012; de Morree et al., 2019): Pax3total_Forward: 5′ GTCAGAGACTGGAACATATGAAGAATGT 3′ Pax3total_Reverse: 5′ GCCTGCGGTGCTATAGGT 3′ Pax3total_Middle: 5′ CTGCCCACATCTCAGC 3′
TaqMan probe Pax3long (Boutet et al., 2012; de Morree et al., 2019): Pax3long_Forward: 5′ TGTGTTAGCAGGACTAGACATAGAACT 3′ Pax3long_Reverse: 5′ TTGAGGCTGCAACACAAAGATACTA 3′ Pax3long_Middle: 5′ CACCCTGCCCAACGTA 3′
RNaseZap™ RNase Decontamination solution (ThermoFisher Scientific, catalog number: AM9780)
Equipment
BioMark HD PCR machine (Fluidigm)
Integrated Fluidic Circuit (IFC) controller MX (Fluidigm)
Mini centrifuge (Fisherbrand, catalog number: 12006901)
ScanR High Content Screening microscope (Evident, model: OLYMPUS)
BD FACSAriaTMIII Sorter (BD Biosciences, catalog number: 648282-24)
Master Cycler Gradient Thermal Cycler (Eppendorf, catalog number: 5331)
Vortex-Genie 2 (Scientific Industries, SKU: SI-0236)
Software
Digital PCR Analysis Software (Biomark and EP1 software v4.8.1)
GraphPad PRISM (GraphPad Software Inc.)
Fiji image processing package (ImageJ2)
Procedure
文章信息
版权信息
© 2023 The Author(s); This is an open access article under the CC BY-NC license (https://creativecommons.org/licenses/by-nc/4.0/).
如何引用
Readers should cite both the Bio-protocol article and the original research article where this protocol was used:
- Das Barman, S., Frimand, Z. and De Morree, A. (2023). Absolute Quantification of mRNA Isoforms in Adult Stem Cells Using Microfluidic Digital PCR. Bio-protocol 13(17): e4811. DOI: 10.21769/BioProtoc.4811.
- de Morree, A., Klein, J. D. D., Gan, Q., Farup, J., Urtasun, A., Kanugovi, A., Bilen, B., van Velthoven, C. T. J., Quarta, M., Rando, T. A., et al. (2019). Alternative polyadenylation of Pax3 controls muscle stem cell fate and muscle function. Science 366(6466): 734–738.
分类
干细胞 > 成体干细胞 > 肌肉干细胞
分子生物学 > RNA > RNA 检测
您对这篇实验方法有问题吗?
在此处发布您的问题,我们将邀请本文作者来回答。同时,我们会将您的问题发布到Bio-protocol Exchange,以便寻求社区成员的帮助。