

LiverQuant: An Improved Method for Quantitative Analysis of Liver Pathology
LiverQuant:肝脏病理定量分析的改进方法
发布: 2023年07月20日第13卷第14期 DOI: 10.21769/BioProtoc.4776 浏览次数: 2977
评审: Masahiro MoritaAmr Galal Abdelraheem IbrahimNimesha Tadepalle
Advertisement


Abstract
Current means to quantify cells, gene expression, and fibrosis of liver histological slides are not standardized in the research community and typically rely upon data acquired from a selection of random regions identified in each slide. As such, analyses are subject to selection bias as well as limited subsets of available data elements throughout the slide. A whole-slide analysis of cells and fibrosis would provide for a more accurate and complete quantitative analysis, along with minimization of intra- and inter-experimental variables. Herein, we present LiverQuant, a method for quantifying whole-slide scans of digitized histologic images to render a more comprehensive analysis of presented data elements. After loading images and preparing the project in the QuPath program, researchers are provided with one to two scripts per analysis that generate an average intensity threshold for their staining, automated tissue annotation, and downstream detection of their anticipated cellular matrices. When compared with two standard methodologies for histological quantification, LiverQuant had two significant advantages: increased speed and a 50-fold greater tissue area coverage. Using publicly available open-source code (GitHub), LiverQuant improves the reliability and reproducibility of experimental results while reducing the time scientists require to perform bulk analysis of liver histology. This analytical process is readily adaptable by most laboratories, requires minimal optimization, and its principles and code can be optimized for use in other organs.
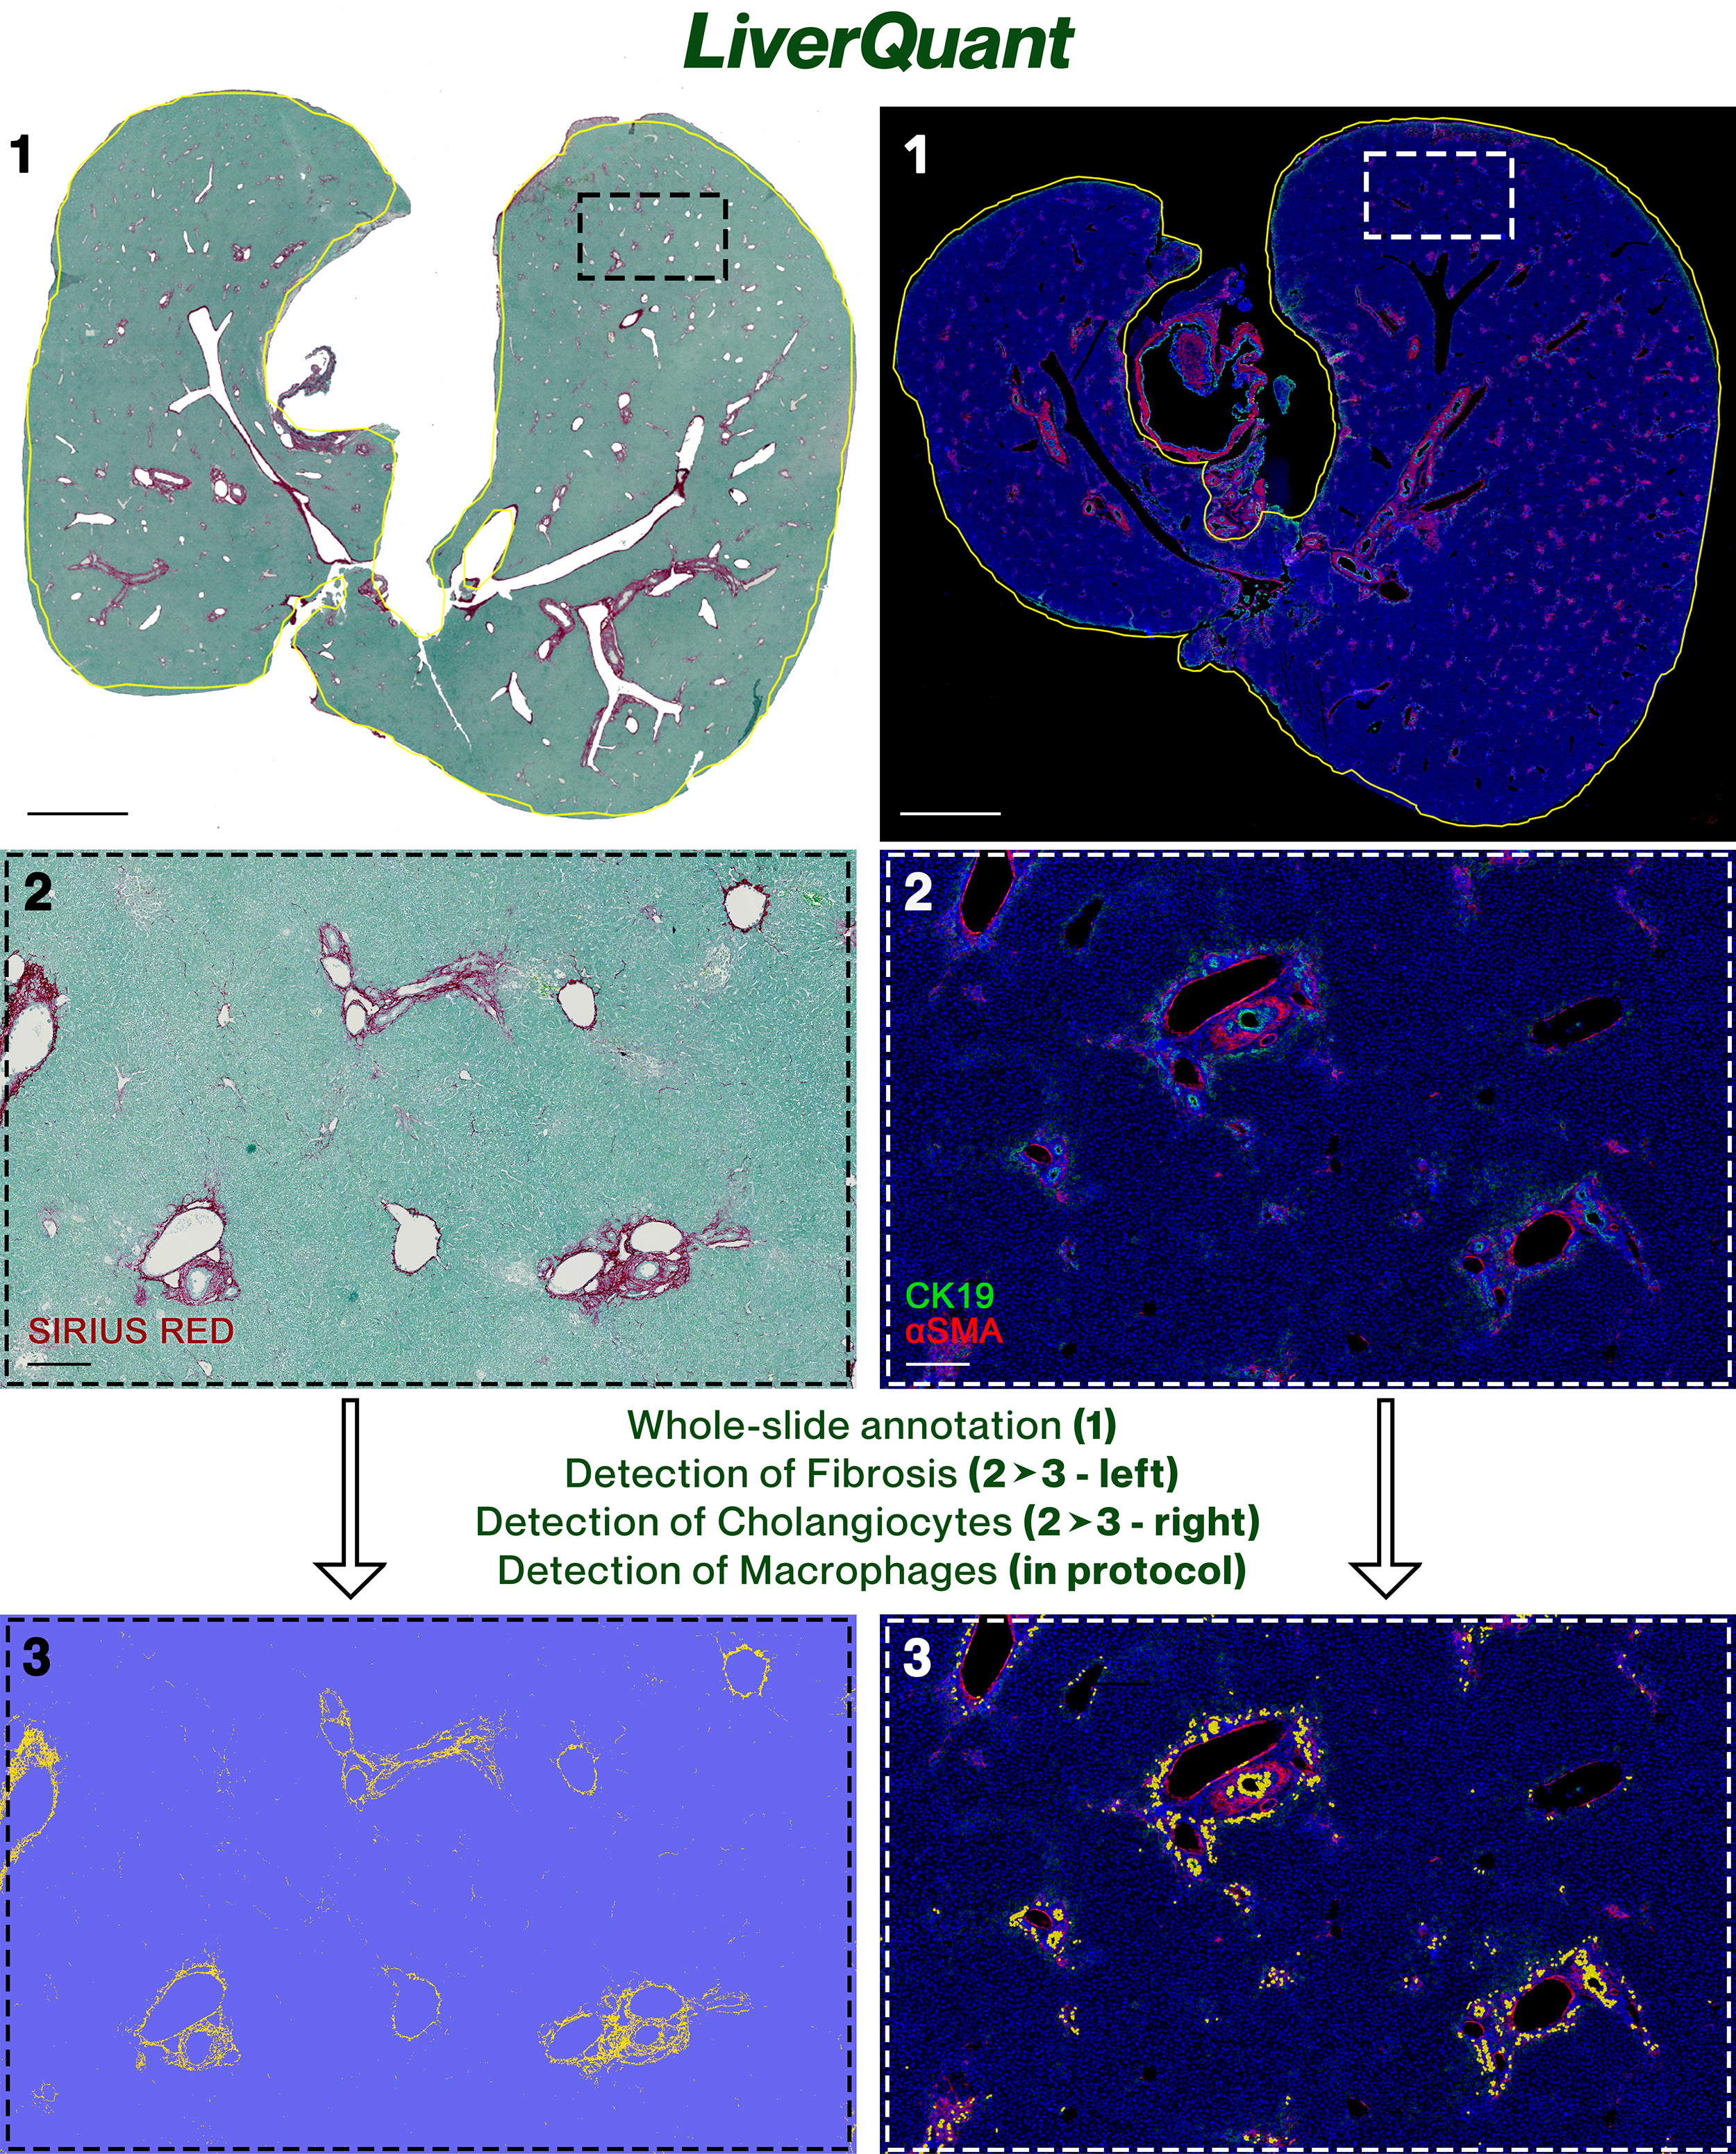
Graphical overview
Background
Histology is the use of immunodetection-based reagents to visualize cellular and extracellular compartments of tissue, usually via thin-slice light or fluorescent microscopic analysis. Histologic analysis is routinely applied daily in clinical and research settings and is considered essential for visually assessing the structure and pathology of the tissue under study. Advances in cell-based immunohistochemical and immunofluorescent detection protocols have led to multi-faceted progress in most biological fields (Kamimoto et al., 2020; Ramachandran et al., 2020; Tan et al., 2020; Taylor, 2020; Guilliams et al., 2022). Historically, light microscopy has been utilized by pathologists to determine disease etiology as well as determining the extent or degree of damage. More recently, there has been a need, more so in research settings, to provide quantitation of cellular infiltrates, proliferation, and cell-specific expression of selected protein markers, to define the cellular response to damage as well as to identify pathways of repair (Ben-Moshe and Itzkovitz, 2019; Saviano et al., 2020; Hu et al., 2022). The typical method of quantifying cells or fibrosis has been to randomly select regions of interest (ROI) and manually count cells or notable puncta (Abercrombie, 1946; Endo et al., 2002; Baratta et al., 2009; Vogel et al., 2015; Baghdasaryan et al., 2016; Husain et al., 2018). There are no standards for this approach but, by definition, there are inadvertent opportunities for significant regional cherry-picking, and as it does not take into account the entire tissue area of the slide, this method may not provide accurate quantitation (Baker, 2016; Murphy and Aguinis, 2022). Moreover, staining variation between and within slides, small sample sizes (< 1,000 detections/sample), extensive use of laboratory time, and no agreed-upon method all limit the utility and applicability of these methods between experiments and laboratories (Gurcan et al., 2009; Alturkistani et al., 2016; Bogen, 2019).
To address these issues, we focus on this over-arching problem using a specific model organ, the liver. The liver serves as the human body’s biofilter and can be highly reactive in response to disease, genetic predisposition, or external challenges (Nagy et al., 2020). The main cell types in the liver include parenchymal hepatocytes, liver sinusoidal endothelial cells, Kupffer cells/macrophages, cholangiocytes, and endothelium (Heymann and Tacke, 2016). Biomarkers of liver-related injury predominately present through the recruitment of F4/80+ macrophages, an increase in the extracellular production of collagen, and the rapid expansion of cholangiocytes (Fabris et al., 2019).
In this report, we present our experience with an automated whole-slide approach to quantify cells and fibrosis in standard liver slide histology termed LiverQuant. LiverQuant is a new customizable method that uses scripts written in QuPath to automate the detection of macrophages, fibrosis, and cholangiocytes in whole-slide scanned images of liver tissue. QuPath is a free, open-source program for analyzing pathology, and can be used by anyone with an efficient computer (Bankhead et al., 2017). Recently, LiverQuant methodology was used to quantitate various cell types and fibrosis in a novel genetic-based mouse model of biliary atresia, the liver conditional knockout of Pkd1l1 (Hellen et al., 2023).
While this protocol is intended for the detection of specific cell and extracellular markers within the liver, its principles and code can be optimized for use in other organs, within any species, and can be accomplished using either Mac or Windows-based computers.
Materials and reagents
CK19, 1:100 (DSHB, catalog number: TROMA-III)
Alpha-actin (αSMA), 1:250 (Sigma, catalog number: A2547)
F4/80, 1:300 (Cell Signaling, catalog number: CS70076)
Picosirius Red/Fast Green, KIT (Chondrex, catalog number: 9046)
2° Antibodies (immunofluorescence), 1–100 (Alexa Fluor® Invitrogen)
HRP, mouse (immunohistochemistry), 1–100 (Cell Signaling, catalog number: 8125)
SignalStain® DAB (immunohistochemistry), KIT (Cell Signaling, catalog number: 8059)
DAPI, 1:1,000 (Invitrogen, catalog number: D1306)
Equipment
Vectra Polaris Scanner
Note: Any microscope or scanner that can scan whole sections is sufficient.
Computer: tested and optimized with Precision 5820 (2021) with Intel 4.7 GHz processor, Nvidia Quadro RTX4000, 64 GB of RAM, 4 TB SSD, two 8 TB hard drives on RAID 0, and a 30" monitor. Additionally validated with MacBook Pro (2020), M1 processor, and 16 GB of RAM
Note: This protocol is achievable with computers/laptops that have less computing power.
Software
QuPath 0.4.2 open-source software (https://qupath.github.io/)
QuPath scripts are available at https://github.com/DominickHellen/LiverQuant
GraphPad Prism (https://www.graphpad.com)
Procedure
文章信息
版权信息
© 2023 The Author(s); This is an open access article under the CC BY-NC license (https://creativecommons.org/licenses/by-nc/4.0/).
如何引用
Hellen, D. J. and Karpen, S. J. (2023). LiverQuant: An Improved Method for Quantitative Analysis of Liver Pathology. Bio-protocol 13(14): e4776. DOI: 10.21769/BioProtoc.4776.
分类
免疫学 > 免疫细胞成像 > 荧光显微技术
细胞生物学 > 细胞成像 > 固定组织成像
您对这篇实验方法有问题吗?
在此处发布您的问题,我们将邀请本文作者来回答。同时,我们会将您的问题发布到Bio-protocol Exchange,以便寻求社区成员的帮助。