

Automated Quantification of Multiple Cell Types in Fluorescently Labeled Whole Mouse Brain Sections Using QuPath
QuPath对荧光标记的整个小鼠大脑切片中的多种细胞类型进行自动定量
发布: 2022年07月05日第12卷第13期 DOI: 10.21769/BioProtoc.4459 浏览次数: 5377
评审: Pilar Villacampa AlcubierreCaitlin FinneySamuel Gonçalves Ribeiro
参见作者原研究论文
The authors used this protocol in:

Nov 2021
Advertisement


Abstract
The quantification of labeled cells in tissue sections is crucial to the advancement of biological knowledge. Traditionally, this was a tedious process, requiring hours of careful manual counting in small portions of a larger tissue section. To overcome this, many automated methods for cell analysis have been developed. Recent advances in whole slide scanning technologies have provided the means to image cells in entire tissue sections. However, common automated analysis tools do not have the capacity to deal with the large image files produced. Herein, we present a protocol for the quantification of two fluorescently labeled cell populations, namely pericytes and microglia, in whole brain tissue sections. This protocol uses custom-made scripts within the open source software QuPath to provide a framework for the careful optimization and validation of automated cell detection parameters. Images obtained from a whole-slide scanner are first loaded into a QuPath project. Manual counts are performed on small sample regions to optimize cell detection parameters prior to automated quantification of cells across entire brain regions. Even though we have quantified pericytes and microglia, any fluorescently labeled cell with clear labeling in and around the nucleus can be analyzed using these methods. This protocol provides a user-friendly and cost-effective framework for the automated analysis of whole tissue sections.
Keywords: Image analysis (图像分析)Background
Since the invention of the microscope, quantification of specific cell types in tissue sections has played a crucial role in biological discovery. Advances in cell labeling, including immunohistochemistry, in situ hybridization, and the use of genetically encoded fluorescent labels, have enabled cells to be identified and distinguished with increasing specificity. However, the quantification of labeled cells has largely remained a tedious manual or semi-automated process. The time-consuming nature of this process means it has only been practical to quantify small sample areas of tissue, leaving the majority of tissue uncounted. Even when an entire brain can be imaged, computer-based semi-automated image analysis tools available in programs such as ImageJ are not able to handle the large files produced; therefore, analysis has largely remained limited to small sub-regions. In a complex and heterogeneous organ, such as the brain, these restricted processes can lead to experimenter bias, due to the subjective nature of manual counting and sampling bias, if a selected subset of tissue is not an accurate representation of a whole region.
Recent advances in computational image analysis and whole slide scanning technology have made it possible to quantify every single cell in a whole tissue section on a regular desktop computer. It is now practicable to quantify and further analyze the characteristics of hundreds of thousands of cells in a few minutes—a process that would take days or weeks to do manually. However, this process is not perfect. Software programs that examine digitized images to determine what is, and is not, a cell, are only as good as their underlying algorithms (which are hard-coded by the engineers of the software) and the validity of any user-determined input parameters. It remains important to carefully assess the validity of automated detection algorithms manually, as small differences in tissue processing, staining, and imaging can have significant impacts on the performance of automated algorithms when they are applied across whole projects. Despite this, many studies using automated cell counting approaches do not present evidence of optimization, or justification for the selection of specific parameters.
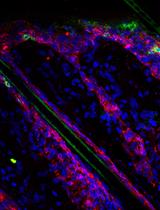
Here, we present a semi-automated method for counting and classifying two fluorescently labeled cell types—pericytes and microglia—in whole mouse brain tissue sections using the open source software QuPath (Bankhead et al., 2017) as used in Courtney et al. (2021). Our method uses extensive optimization to objectively determine the specific automated cell detection parameters required for each different brain region.
Although this method is written specifically for quantifying pericytes labeled with the fluorophore DsRed and microglia labeled with the fluorophore GFP in mouse brain tissue, it could easily be adapted to quantify any type of cell in any type of tissue, so long as the stain is localized within or immediately around the nucleus. In addition, we present the optimization of just one specific parameter important for automated cell detection, the fluorescence intensity threshold. However, we provide the framework for adding optimization steps for additional cell detection parameters, if desired.
Collectively, the method presented here offers a user-friendly and cost-effective framework for the automated quantification of cell numbers in whole tissue sections, without the need for extensive and time-consuming manual counting.
Equipment
VS120 Slide Scanner (Olympus) or any other microscope capable of scanning and digitizing whole slides
Computer: 64-bit Windows, Linux, or Mac with minimum 16 GB RAM and a fast multicore processor (e.g., Intel Core i7)
Note: This protocol will likely work with a less powerful computer or with lower RAM, but analyses will be slow and may encounter memory errors. For more details, please refer to the QuPath online documentation (https://qupath.readthedocs.io/).
Software
QuPath 0.3.2 open source software (https://qupath.github.io/)
Custom QuPath scripts available at: https://github.com/jo-maree/BioProtocol-2022-Scripts
Notepad or any other simple text editor for making changes to scripts and classifiers
Microsoft Excel or similar
GraphPad Prism (GraphPad Software https://www.graphpad.com/) or similar
Procedure
文章信息
版权信息
© 2022 The Authors; exclusive licensee Bio-protocol LLC.
如何引用
Readers should cite both the Bio-protocol article and the original research article where this protocol was used:
- Courtney, J., Morris, G. P., Cleary, E. M., Howells, D. W. and Sutherland, B. A. (2022). Automated Quantification of Multiple Cell Types in Fluorescently Labeled Whole Mouse Brain Sections Using QuPath. Bio-protocol 12(13): e4459. DOI: 10.21769/BioProtoc.4459.
- Courtney, J. M., Morris, G. P., Cleary, E. M., Howells, D. W. and Sutherland, B. A. (2021). An automated approach to improve the quantification of pericytes and microglia in whole mouse brain sections. eNeuro 8(6): ENEURO.0177-21.2021.
分类
神经科学 > 细胞机理
生物信息学与计算生物学
细胞生物学 > 细胞成像 > 固定组织成像
您对这篇实验方法有问题吗?
在此处发布您的问题,我们将邀请本文作者来回答。同时,我们会将您的问题发布到Bio-protocol Exchange,以便寻求社区成员的帮助。