

Bacterial Growth Curve Measurements with a Multimode Microplate Reader
使用多模式酶标仪测量细菌生长曲线
发布: 2022年05月05日第12卷第9期 DOI: 10.21769/BioProtoc.4410 浏览次数: 7604
评审: Alba BlesaChangyi ZhangElías Barquero-CalvoDamián Lobato-Márquez
参见作者原研究论文
The authors used this protocol in:

Jan 2021
Advertisement


Abstract
Bacterial studies based on growth curves are common in microbiology and related fields. Compared to the standard photometer and cuvette based protocols, bacterial growth curve measurements with microplate readers provide better temporal resolution, higher efficiency, and are less laborious, while analysis and interpretation of the microplate-based measurements are less straightforward. Recently, we developed a new analysis method for evaluating bacterial growth with microplate readers based on time derivatives. Here, we describe a detailed protocol for this development and provide the homemade program for the new analysis method.
Keywords: Time derivativeBackground
Monitoring the growth and proliferation of microorganisms based on growth curves is commonly used in microbiology and related fields for understanding the growth of microorganisms, the efficacy of antibiotic drugs, and the microbial responses to new environmental conditions and stresses (Mandelstam et al., 1982; Andrews, 2001; Bollenbach et al., 2009; Haque et al., 2017). Traditional growth curve measurements based on photometers and cuvettes suffer from several drawbacks, such as low temporal resolution, low efficiency, and high labor requirement (Stevenson et al., 2016; Goldman and Green, 2021). In contrast, growth curve measurements using microplate readers take advantage of automation and parallel capability; however, the application of microplate readers for growth curve measurements has been hindered due to the complexity in the quantification and data interpretation caused by multiple light scattering and/or light absorption/scattering by other ingredients in the samples (Stevenson et al., 2016). Recently, we developed a new analysis method for evaluating bacterial growth with microplate readers based on time derivatives. This method not only uses the optical density (i.e., absorption/scattering) of bacterial culture, but also takes advantage of the fluorescence of bacteria expressing fluorescent proteins (Krishnamurthi et al., 2021). The time derivatives of optical density and fluorescence show peaks, whose location and height are correlated with the lag time and maximum growth rate of bacteria (Krishnamurthi et al., 2021). Here, we describe the detailed protocol for carrying out growth curve measurements with microplate readers and provide the homemade program for analyzing and visualizing the results. Escherichia coli bacteria were used here as an example; however, this protocol is expected to be applicable to other microorganisms.
Materials and Reagents
96-well clear bottom plates (Corning, catalog number: 3631) (Figure 1)
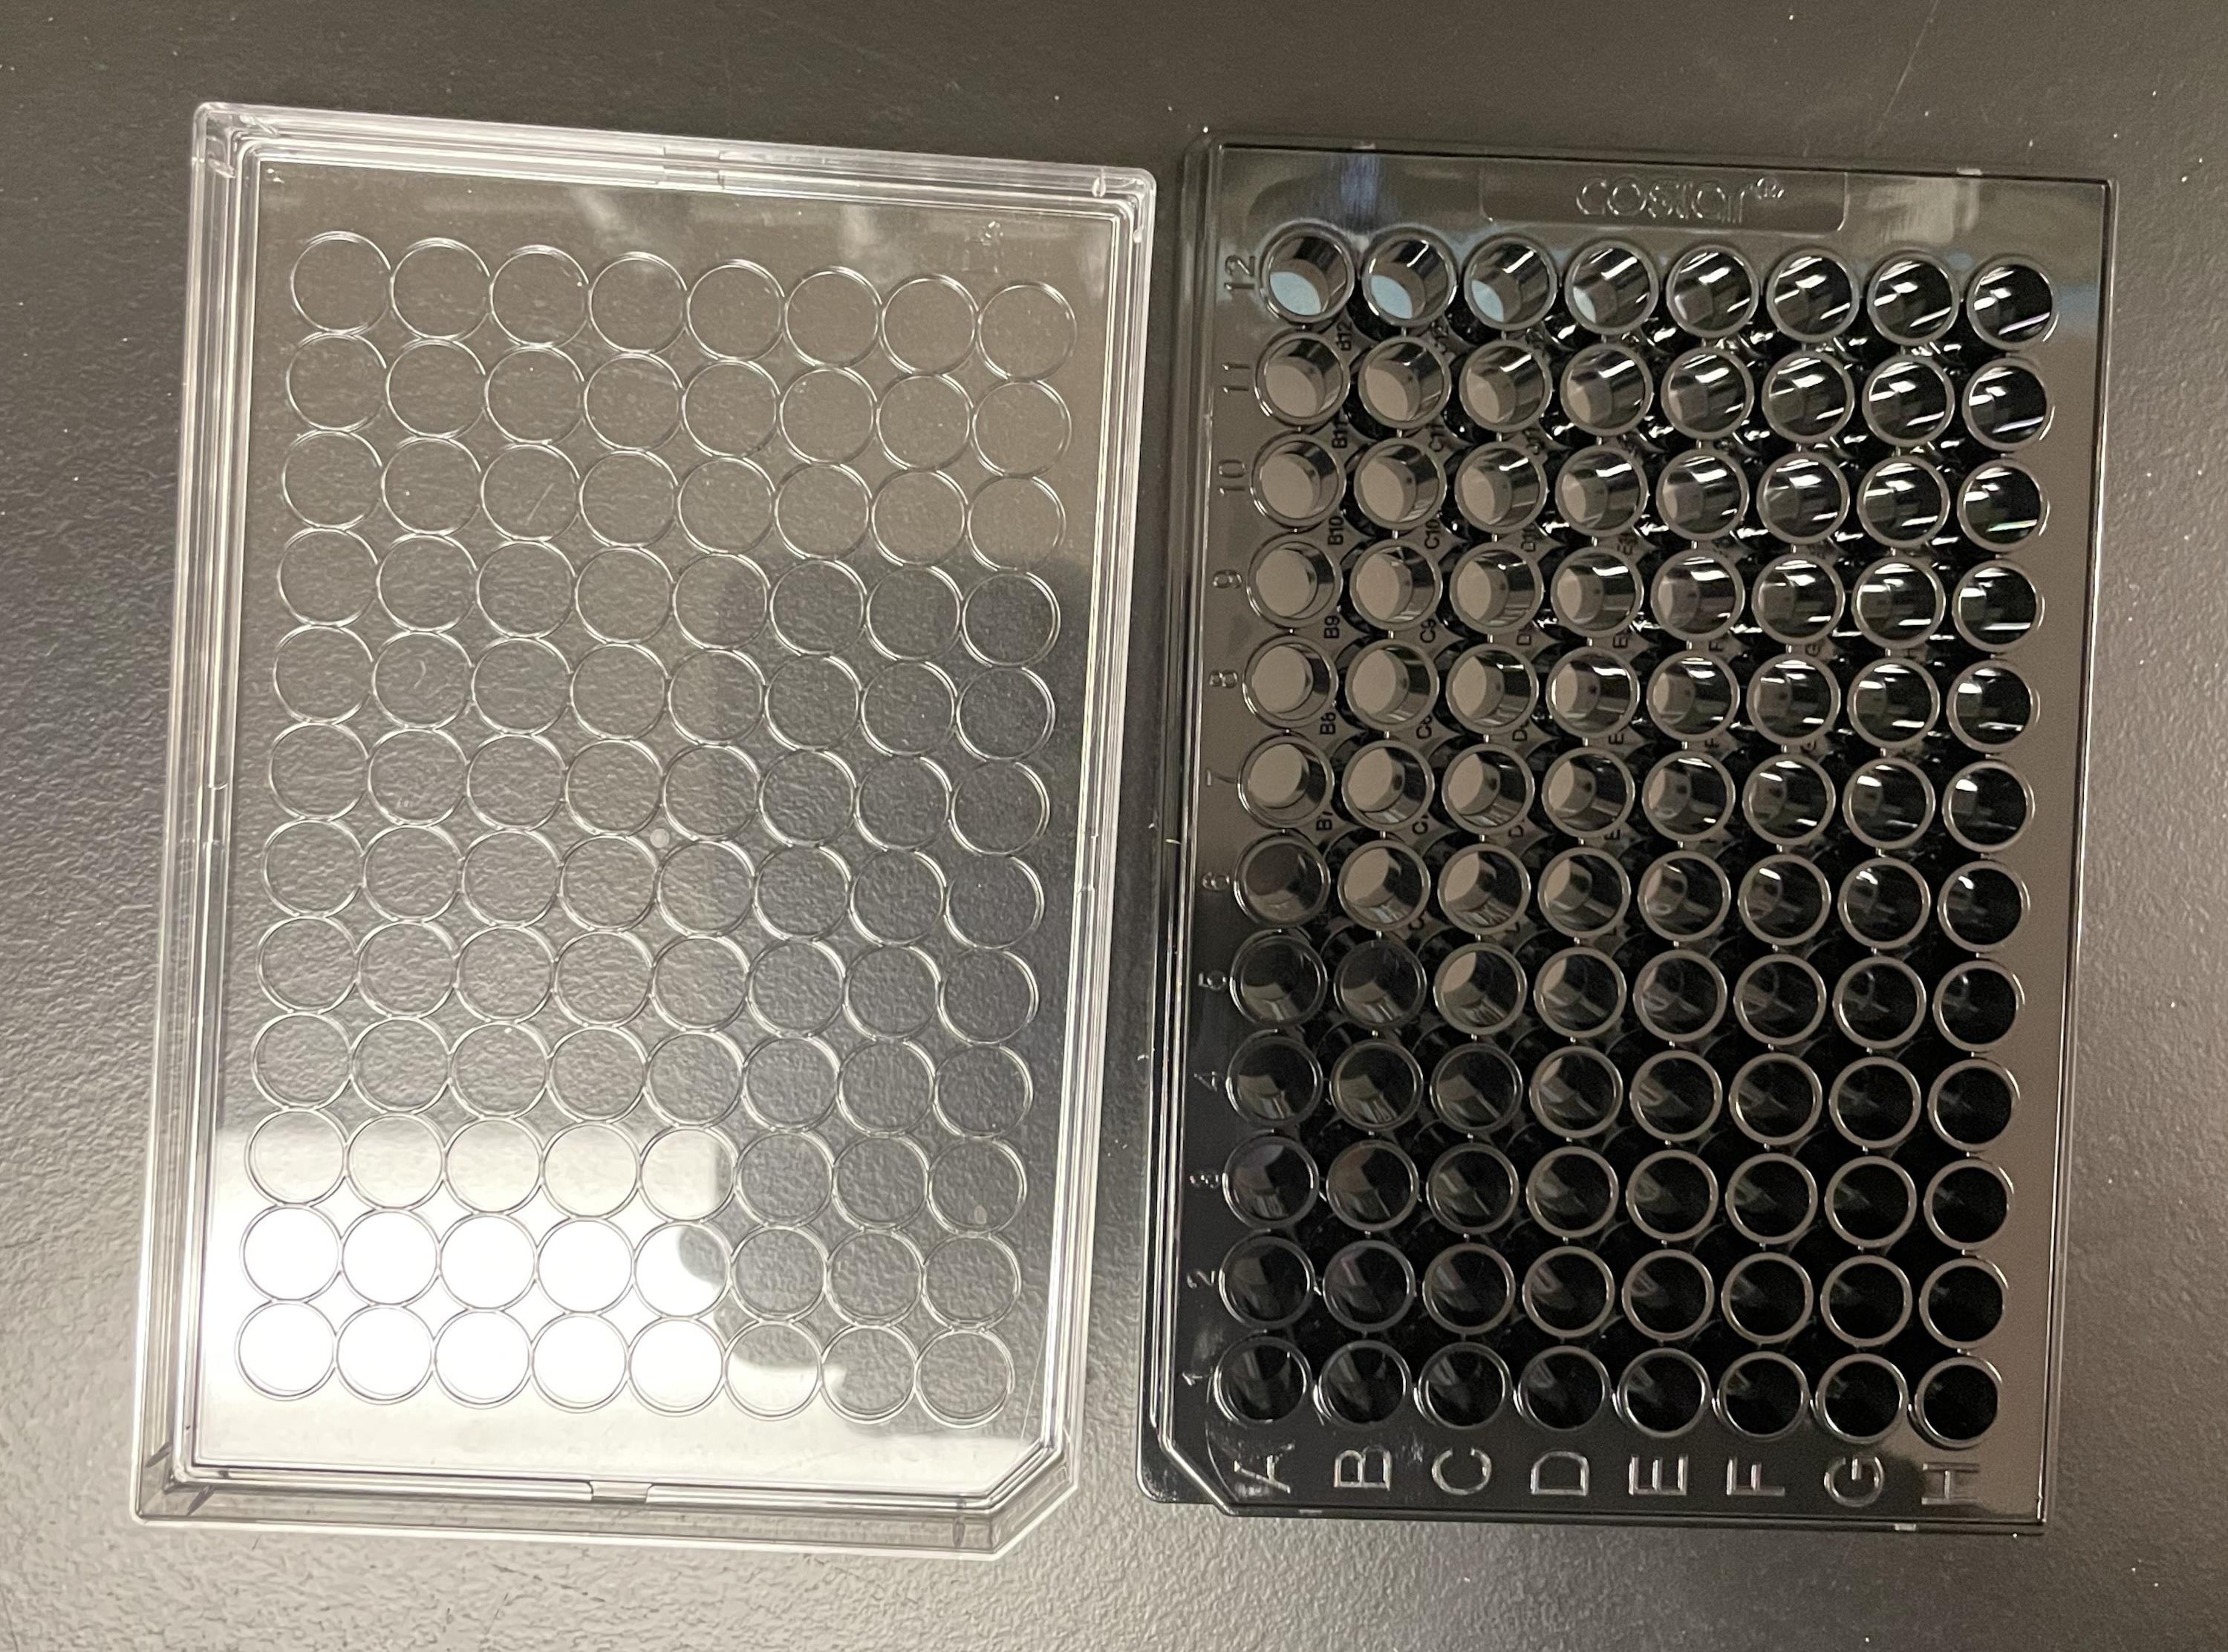
Figure 1. Photo of a 96-well microplate with clear bottom and its clear lid.Polystyrene lids for 96-well microplates (Corning, catalog number: 3931)
1–200 µL pipette tips (VWR, catalog number: 53508-810)
100–1,000 µL pipette tips (VWR, catalog number: 83007-376)
1.5 mL microcentrifuge tubes (VWR, catalog number: 20170-038)
14 mL sterile culture tubes (VWR, catalog number: 60818-725)
Escherichia coli strain K-12 MG1655 transformed with plasmid pOEGFP2, encoding ampicillin resistance gene and green fluorescent proteins (Lab collection), which were used previously (Haque et al., 2017; Niyonshuti et al., 2020; Krishnamurthi et al., 2021). (Figure 2)
Note: Other bacterial strains expressing fluorescent proteins are expected to be compatible with the current protocol.
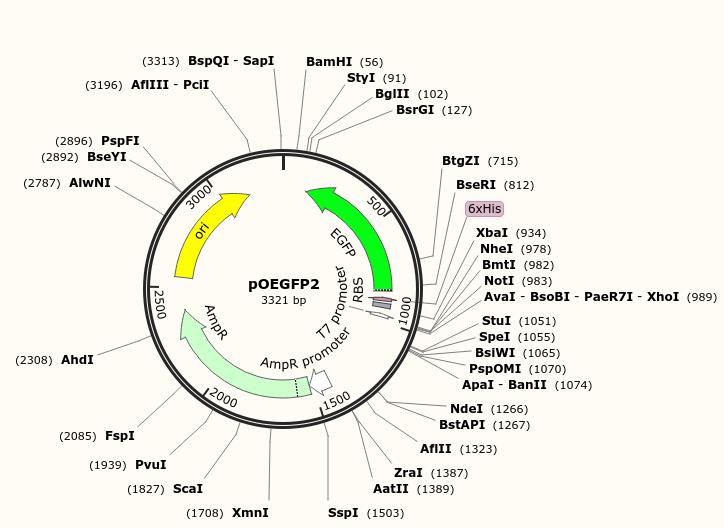
Figure 2. Map of the plasmid pOEGFP2 used in this protocol. The plasmid was a gift from Dr. David McMillen at the University of Toronto. The plasmid map was generated using SnapGene Viewer (GSL Biotech LLC).Tryptone (Bio Basic Inc, catalog number: TG217)
Yeast extract (Bio Basic Inc, catalog number: G0961)
Sodium chloride (VWR International, LLC, catalog number: 7647-14-5)
Ampicillin (VWR, catalog number: AAJ60977-06)
Triton X-100 (VWR, catalog number: AAA16046-AP)
Ethanol (VWR, catalog number: 89125-188)
Deionized water (>17.6 MΩ, from Barnstead ultrapure water purification system [model: D4641])
Triton X-100 (VWR, catalog number: AAA16046-AP)
Liquid LB medium (200 mL) (see Recipes)
Ampicillin stock solution (10 mL) (see Recipes)
Python code (see Supplementary file)
Equipment
2–20 µL single channel mechanical pipette (VWR, catalog number: 89079-964)
20–200 µL single channel mechanical pipette (VWR, catalog number: 89079-970)
Multimode microplate reader capable of measuring both absorption and fluorescence (BioTek Instruments, model: Synergy H1)
Autoclave (Tuttnauer, model: 2540E-B/L)
Biosafety cabinet (Labconco, model: Purifier Logic+ Class II Type A2)
Software
Gen5 Microplate Reader and Imager Software (BioTek Instruments, https://www.biotek.com/)
Microsoft Excel Spreadsheet Software (Microsoft Corporation, https://www.microsoft.com/)
Python (https://www.python.org/)
Procedure
文章信息
版权信息
© 2022 The Authors; exclusive licensee Bio-protocol LLC.
如何引用
Rogers, A. T., Bullard, K. R., Dod, A. C. and Wang, Y. (2022). Bacterial Growth Curve Measurements with a Multimode Microplate Reader. Bio-protocol 12(9): e4410. DOI: 10.21769/BioProtoc.4410.
分类
微生物学 > 抗微生物试验 > 抗细菌试验
生物科学 > 微生物学
您对这篇实验方法有问题吗?
在此处发布您的问题,我们将邀请本文作者来回答。同时,我们会将您的问题发布到Bio-protocol Exchange,以便寻求社区成员的帮助。