

Single Molecule Tracking Nanoscopy Extended to Two Colors with MTT2col for the Analysis of Cell-Cell Interactions in Leukemia
使用 MTT2col 将单分子跟踪纳米显微镜扩展到两种颜色,用于分析白血病中的细胞-细胞相互作用
发布: 2022年04月20日第12卷第8期 DOI: 10.21769/BioProtoc.4390 浏览次数: 3073
评审: Ralph Thomas BoettcherYihui ZhuAnonymous reviewer(s)
参见作者原研究论文
The authors used this protocol in:

Sep 2021
Advertisement


Abstract
Single molecule tracking (SMT) is a powerful technique to study molecular dynamics, and is particularly adapted to monitor the motion and interactions of cell membrane components. Assessing interactions among two molecular populations is classically performed by several approaches, including dual-color videomicroscopy, which allows monitoring of interactions through colocalization events. Other techniques, such as fluorescence recovery after photobleaching (FRAP), Förster resonance energy transfer (FRET), and fluorescence correlation spectroscopy (FCS), are also utilized to measure molecular dynamics.
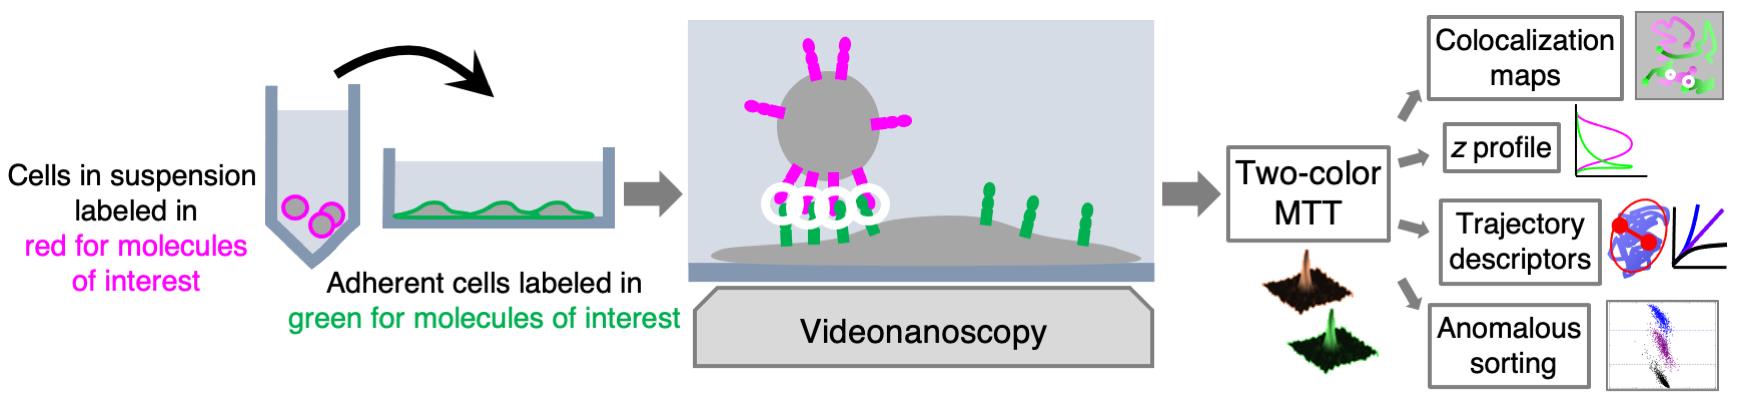
We developed MTT2col, a set of algorithmic tools extending multi-target tracing (MTT) to dual-color acquisition (https://github.com/arnauldserge1/MTT2col). In this protocol, we used MTT2col to monitor adhesion molecules at the contact between leukemic stem cells and stromal cells, a process involved in cancer resistance to chemotherapy and in relapse. Our dual-color single molecule protocol includes the following steps: (i) labeling molecules of interest with fluorescent probes, (ii) video-acquisition, (iii) analyses using our MTT2col in-house software, to obtain positions and trajectories, followed by (iv) detailed analyses of colocalization, distribution, and dynamic motion modes, according to the issues addressed. MTT2col is a robust and efficient SMT algorithm. Both MTT and MTT2col are open-source software that can be adapted and further developed for specific analyses.
Graphical abstract:
Background
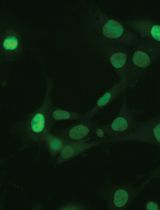
Single molecule tracking (SMT) is a powerful approach to investigate molecular dynamics in live cells, at the plasma membrane, in the cytosol, or in the nucleus (Figure 1A). Noteworthy, determining the position of a single fluorescent molecule at sub-resolution accuracy can be achieved using a two-dimensional (2D) Gaussian fit, provided there is a sufficient signal-to-noise ratio. We typically achieve ~40 nm lateral accuracy for living cell images (Sergé et al., 2008). Labeling and monitoring two molecular species by dual-color SMT allows for the comparison of their dynamic state and kinetic interactions in situ. Single molecule labeling can be done classically with fluorescently coupled antibodies (either primary alone, or primary and secondary), Fab fragments, and nanobodies, or by fluorescent proteins, such as GFP and its variants (in other colors or photoactivatable for instance). Additionally, protein tags such as HaloTag, SnapTag, and ClipTag, with their bright and stable fluorescent ligands, may also be utilized (Figure 1B). Each approach has its advantages and limitations, notably in terms of stoichiometry, steric hindrance, brilliance, and photostability (Achimovich, Ai and Gahlmann, 2019; Jacquemet et al., 2020; Lemon and McDole, 2020; Petazzi, Aji and Chiantia, 2020). There are already several SMT algorithms available, each of which vary in performance due to critical issues, such as signal-to-noise ratio and probe density (Manzo and Garcia-Parajo, 2015).
Alternative microscopy approaches for monitoring molecular dynamics (classically for one, and eventually for two populations) include fluorescence recovery after photobleaching (FRAP), fluorescence correlation spectroscopy (FCS), and Förster resonance energy transfer (FRET), as well as the more recently introduced super-resolution SMT methods (Owen et al., 2009; Sergé, 2016). Super-resolution SMT methods comprise single-particle tracking by photo-activation localization microscopy (sptPALM) (Manley et al., 2008), points accumulation for imaging in nanoscale topography (PAINT) (Sharonov and Hochstrasser, 2006), and minimal photon fluxes (MINFLUX) nanoscopy (Balzarotti et al., 2017).
Of note, concerning temporal limits, FRAP and FCS are more sensitive to fast motions (i.e., above ~0.1 µm2/s, providing a higher contribution to the measurement), while SPT is more sensitive to slow motions (leading to more efficient reconnections). Furthermore, concerning spatial limits, SMT can reach nanometer accuracy, FRET is efficient only for distances around 10 nm, and both can document entire cell(s) within the microscope field of view, while FRAP and FCS provide local measurements, inherently applied over distances larger than the diffraction limit. Other non-dynamic approaches to assess molecular interactions at the cell or tissue level, in vivo or in vitro, include immunostaining or coimmunoprecipitation. A key advantage of single molecule techniques, as opposed to ensemble-average measurements, is that they provide access to the distribution of descriptors, hence to the dynamic of each molecule.
All these techniques may be applied to different space and time domains, with various advantages and limitations (De Los Santos et al., 2015; Li and Vaughan, 2018). For instance, SMT approaches such as MTT2col cover a broad range of space and time, as can be addressed both at the global and local level. Globally, SMT is spatially limited to the field of view of the imaging system: microscope and camera. Images have a width of 512 pixels, with 160-nm pixels and 100× objective, leading to 82-µm width. Temporarily, the limit is only the biology (and the storage capacity, often not limiting). We consider that cells should be kept no more than one hour in the microscope. However, some experimental conditions may need shorter or longer time periods: for instance, endo/exocytosis and protein synthesis occur on minute and hour time-scales, respectively. For each video, we arbitrarily set the length to typically 100–500 frames at 100-ms exposure, hence 10–50 s. This can be readily adjusted to the kinetics of the biological system being measured. Locally, space and time resolution limits are linked, essentially by the equation of diffusion MSD = 4Dt. The acquisition time is usually set at its lowest value, as imposed by the fastest video rate of the camera, typically in the 10-ms range. For a diffusion coefficient ranging from 10-3 to 1 µm2/s, this leads to 50–500 nm.
MTT2col may be tuned using several parameters, including probability of false alarm (PFA) detection for different signal-to-noise ratios, spatiotemporal search windows, probability parameters for the reconnection statistical laws, target size, and cutoffs for discarding short and slow trajectories. Each parameter may be adjusted by visual inspection of the results obtained with the default values. For instance:
- For too many/not enough detections, PFA should be increased/decreased to become more/less stringent.
- Similarly, if trajectories are connecting too many/not enough targets, spatiotemporal search windows and probability parameters for reconnection should be adjusted accordingly. In particular, the spatiotemporal search window should match the spatiotemporal resolution limits [see supplementary Figure 6B in Gorshkova et al. (2021)]. Cutoffs relate to statistical laws describing the past statistics and recombination probabilities. Thus, they should be of general scope [see Sergé et al. (2008) for a description of these parameters]. Given the robustness of MTT, the default values are often satisfactory.
- For a single molecule, the target size is equal to the diffraction limit. Hence, the physical value is almost constant over the visible spectrum, i.e., 200–300 nm. It was converted into pixels with a pixel size of 160 nm in the original version. If the pixel size substantially varies, then the value of the target size should be modified accordingly.
- Cutoffs for discarding short and slow trajectories are defined according to the distribution of trajectory length and diffusion coefficient. Irrelevant values (too short and/or too slow) are determined by comparing experimental results and negative controls for non-specific staining for length and immobile dyes for diffusion, see supplementary Figure 6B of Gorshkova et al. (2021). Nevertheless, raw data are saved as dat files and these cutoffs can be reconsidered a posteriori.
However, the algorithm is ultimately robust regarding these values, which are often kept at their original level or easily adjusted.
Finally, the main parameter to optimize is the input diffusion coefficient, which has to correspond to the measured molecules and can be readily identified by testing a range of values [as described in the paragraph Material and Methods/SMT determination of the input diffusion coefficient for MTT, associated to the supplementary Figure 6A of Gorshkova et al. (2021)]. MTT2col is an open-source software, hence the code may be freely adapted to given conditions and/or completed by supplementary analyses tailored for further measurements.
Dual-color SMT can be applied to a broad range of interacting molecules, such as ligands and receptors, or associated proteins like scaffolds, cell adhesion molecule partners, enzymes and cognate substrates, as well as DNA sequences and associated binding regulatory elements. Tracking can also be performed at other scales, for other target types, namely cells, animals (i.e., fishes or birds), or vehicles (i.e., cars or planes). The core of the MTT algorithm has been extensively downloaded to be used by the scientific community, leading to numerous publications. Notably, MTT has been adapted for use in various contexts, i.e., cell tracking, allowing monitoring in space and time of the fluorescence level associated with the intracellular calcium concentration of a population of T cells (Salles et al., 2013).
Importantly, efficient tracking can be achieved provided there is a sufficient signal-to-noise ratio. MTT has good performances down to about 20 dB [as illustrated in Figure 4 from Sergé et al. (2008)]. Of note, noise may be reduced by cultivating cells in a medium without phenol red. Choosing fluorochromes with emission spectra in the red or even infrared can also be helpful to discriminate from autofluorescence (mostly in the green and yellow part of the visible spectrum), hence reducing signal-to-noise ratio. Furthermore, the signal intensity of a single molecule is expected to remain constant until photoblinking or photobleaching, except if photoblinking occurs on timescales shorter than the acquisition time, leading to a lower intensity. Observing stepwise variations instead of gradual decays provides a signature of single molecule measurements. As a supplementary analysis (not implemented in MTT2col), successive stepwise variations in intensity are expected to be due to variations in stoichiometry, for monomers, dimers, trimers, and so on (Schmidt, 1996). To perform these measurements, the intensity of the laser illuminating the sample must be carefully set, by measuring the laser power at the exit of the objective.
The junctional adhesion molecule (JAM) C has been previously reported to be highly expressed in a subset of leukemic stem cells (De Grandis et al., 2017). Thus, JAM-C provides a signature for leukemic initiating cells, potentially leading to relapse after therapy, hence constituting a potential therapeutic target. Thus, we analyzed the dynamics of JAM-B and JAM-C at contacts between leukemic and stromal cells. The MTT2col protocol was initially developed for tracking JAM-B on MS5 stromal cells, and JAM-C on KG1 leukemia cells (Gorshkova et al., 2021). However, it can be readily applied to any other molecules of interest, for instance implicated in cell-cell contacts.
Materials and Reagents
Micropipette tips (Thermo Fisher Scientific, catalog numbers: 11752584 [10 µL]; 10731194 [20 µL]; 16641953 [100 µL]; 11782584 [200 µL]; 11749855 [1,000 µL])
1.5 mL tubes (Eppendorf, Dutscher, catalog number: 033305)
µ-Slide 8 Well Glass Bottom (Ibidi cells in focus, catalog number: 80827)
Trypan blue (Thermo Fisher Scientific, InvitrogenTM, catalog number: T10282)
Rabbit serum (Thermo Fisher Scientific, GibcoTM, catalog number: 16120099)
Cell lines
MS5 (DSMZ ACC 441)
KG1 (ATCC CCL-246)
IMDM (Thermo Fisher Scientific, GibcoTM, catalog number: 12440053)
HBSS, with calcium and magnesium, no phenol red (Thermo Fisher Scientific, GibcoTM, catalog number: 14025092)
L-glutamine (Thermo Fisher Scientific, GibcoTM 25030149, catalog number: 15430614)
Penicillin and streptomycin (Thermo Fisher Scientific, GibcoTM, catalog numbers: 15140122 and 15140148)
β-mercaptoethanol (PanReac AppliChem, catalog number: A1108)
HEPES (Thermo Fisher Scientific, GibcoTM, catalog number: 15630080)
Fetal bovine serum (Thermo Fisher Scientific, GibcoTM, catalog number: 10270106)
Sodium pyruvate (Thermo Fisher Scientific, GibcoTM, catalog number: 11360070)
Antibodies:
Anti-JAM-B: in-house rabbit polyclonal antibody, clone 829
Anti-JAM-C, blocking: mouse IgG (R&D, catalog number: MAB1189, clone 208206)
Anti-JAM-C, non-blocking: in-house rat IgG, clone 19H36
Alexa Fluor 488 conjugated anti-rabbit-IgG (Thermo Fisher Scientific, catalog number: A-11008)
Alexa Fluor 594 conjugated anti-mouse or anti-rat IgG (Thermo Fisher Scientific, catalog number: A-11001 or A-11006)
Quantum-dot 655 conjugated anti-mouse IgG (Thermo Fisher Scientific, catalog number: Q-11021MP)
Quantum-dot 655 conjugated anti-rat IgG (Thermo Fisher Scientific, catalog number: Q-11621MP)
Culture medium for MS5 cells (see Recipes)
Culture medium for KG1 cells (see Recipes)
Equipment
Micropipettes 20, 100 and 1000 (Eppendorf, Thermo Fisher Scientific, catalog number: 05-403-152, model: Research)
Centrifuge (Eppendorf, Thermo Fisher Scientific, catalog number: 5805 000.010)
CO2 incubator Forma Scientific 3548 (Labexchange, Forma Scientific, catalog number: B00032422)
4°C refrigerator
-80°C freezer
Hemocytometer (Ozyme, C-Chip, catalog number: DHC-M01)
Axio Observer Z1 inverted microscope (Zeiss), with thermostated incubator at 37°C
Yokogawa spinning disk device
491- and 561-nm lasers (ILas2 or Cobolt Calypso 1358, 100 mW)
100× α Plan Neofluar NA 1.45 oil-immersion objective (Zeiss) or equivalent, with high NA
Filter cubes n°15 and 44 (Zeiss), with 120-W metal halide lamp (X-cite) for visual inspection
405/488/568/647 nm Yokogawa quadriband dichroic beamsplitter (Semrock, catalog number: Di01-T405/488/568/647-13x15x0.5)
BS 573 dichroic beamsplitter (Semrock, catalog number: FF573-Di01-25x36), between the two cameras
525/50 nm (green channel) and 641/75 nm (red channel) emission filters (Semrock, catalog numbers: FF03-525/50-25 and FF02-641/75-25)
Two Evolve 512 EMCCD cameras (Photometrics) or equivalent, such as the Prime 95B sCMOS camera (Photometrics)
Software
Metamorph software (Version 7.4.8, Molecular Devices)
MTT2col set of MATLAB functions and scripts, using the Image Processing Toolbox with Statistics and Machine Learning Toolbox (any version) (The Mathworks)
Procedure
文章信息
版权信息
© 2022 The Authors; exclusive licensee Bio-protocol LLC.
如何引用
Maillot, L., Irla, M. and Sergé, A. (2022). Single Molecule Tracking Nanoscopy Extended to Two Colors with MTT2col for the Analysis of Cell-Cell Interactions in Leukemia. Bio-protocol 12(8): e4390. DOI: 10.21769/BioProtoc.4390.
分类
生物物理学 > 单分子技术
生物物理学 > 显微技术
细胞生物学 > 细胞成像 > 活细胞成像
您对这篇实验方法有问题吗?
在此处发布您的问题,我们将邀请本文作者来回答。同时,我们会将您的问题发布到Bio-protocol Exchange,以便寻求社区成员的帮助。