

Live-cell Imaging and Analysis of Germline Stem Cell Mitosis in Caenorhabditis elegans
秀丽隐杆线虫生殖干细胞有丝分裂的活细胞成像和分析
发布: 2022年01月05日第12卷第1期 DOI: 10.21769/BioProtoc.4272 浏览次数: 4739
评审: Gunar FabigDemosthenis ChronisAnonymous reviewer(s)
参见作者原研究论文
The authors used this protocol in:
Apr 2021
Advertisement


Abstract
Model organisms offer the opportunity to decipher the dynamic and complex behavior of stem cells in their native environment; however, imaging stem cells in situ remains technically challenging. C. elegans germline stem cells (GSCs) are distinctly accessible for in situ live imaging but relatively few studies have taken advantage of this potential. Here we provide our protocol for mounting and live imaging dividing C. elegans GSCs, as well as analysis tools to facilitate the processing of large datasets. While the present protocol was optimized for imaging and analyzing mitotic GSCs, it can easily be adapted to visualize dividing cells or other subcellular processes in C. elegans at multiple developmental stages. Our image analysis pipeline can also be used to analyze mitosis in other cell types and model organisms.
Background
While permitting the visualization of various tissue-resident stem cells in several model systems, recent advances in intravital imaging often rely on invasive surgery or sophisticated and expensive imaging modalities ( Yoshida et al., 2007; Rompolas et al., 2012; Ritsma et al., 2014; Barbosa et al., 2015; Park et al., 2016; Martin et al., 2018; Nguyen and Currie, 2018). C. elegans GSCs are an established stem cell model that has yielded generalizable insights into many aspects of stem cell biology (Kimble and White, 1981; Baugh and Sternberg, 2006; Fielenbach and Antebi, 2008; Angelo and Van Gilst, 2009). In addition, C. elegans GSCs can be imaged in living animals using standard fluorescence microscopy techniques and without surgical manipulation. In particular, live imaging of GSC mitosis provides an opportunity to investigate the dynamics of cell division and how they are influenced by in vivo factors such as tissue organization, niche signaling, and organismal physiology. Here we describe a simple, fast, and reproducible method to immobilize C. elegans and to image and analyze GSC mitosis, while preserving animal viability, fertility, and seemingly normal GSC divisions.
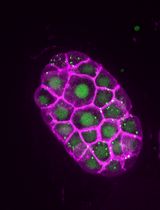
Adult C. elegans hermaphrodites house two populations of GSCs located at the distal ends of the two tube-shaped gonad arms (Figure 1A). Like other germlines, the C. elegans gonad is organized as a syncytium. GSCs form a rough circumferential monolayer around a shared inner core of cytoplasm named the rachis (Hirsh et al., 1976) (Figure 1A and 1C). Each GSC is connected to the rachis by a stable actomyosin ring, which forms a cytoplasmic bridge (Maddox et al., 2005; Zhou et al., 2013; Amini et al., 2014; Priti et al., 2018). Like other stem cells, C. elegans GSCs are kept in a stem-like state by signaling from a somatic niche (the distal tip cell, Kimble and White, 1981; Figure 1A and 1E). Like several types of mammalian stem cells, the size of the C. elegans GSC pool is maintained according to a population model, wherein differentiation due to displacement from the niche is balanced by symmetrical divisions to maintain a relatively constant number of stem cells. according to a population model, wherein differentiation due to displacement from the niche is balanced by symmetrical divisions, thus maintaining a relatively constant number of stem cells (Morrison and Kimble, 2006; Joshi et al., 2010).
The majority of studies in C. elegans GSCs rely on dissected, fixed, and stained gonads, or single-timepoint imaging of gonads bearing fluorescently tagged proteins in living worms. Long-term imaging of GSCs has been accomplished using “catch and release” approaches that permit periodic visualization of GSCs over hours or days (Wong et al., 2013; Rosu and Cohen-Fix, 2017). Moreover, a recently developed microfluidics device may permit continuous observation on a similar time scale (Berger et al., 2018, Berger and Spiri, 2021). Fewer studies have reported live cell imaging of GSCs under conditions suitable for documenting dynamic subcellular events such as mitosis (Gerhold et al., 2015; Gordon et al., 2020; Zellag et al., 2021).
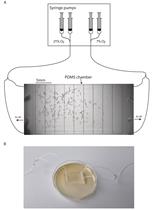
To achieve high temporal and spatial resolution during live imaging, animals must be immobilized and the overall impact of mounting on animal and GSC physiology must be considered. Typical mounting methods immobilize animals using a combination of paralytic drugs and physical compression (Sulston and Horvitz, 1977; Chai et al., 2012; Kim et al., 2013; Hwang et al., 2014; Luke et al., 2014; Burnett et al., 2018; Fabig et al., 2020a and 2020b; Gordon et al., 2020). We use an etched silicon wafer to pattern grooves on an agarose pad, which constrains the animals in a straight position (Figure 1B); this prevents the sinusoidal movements required for worm locomotion (Gray and Lissmann, 1964) and reduces the requirement for physical compression and anesthetics.
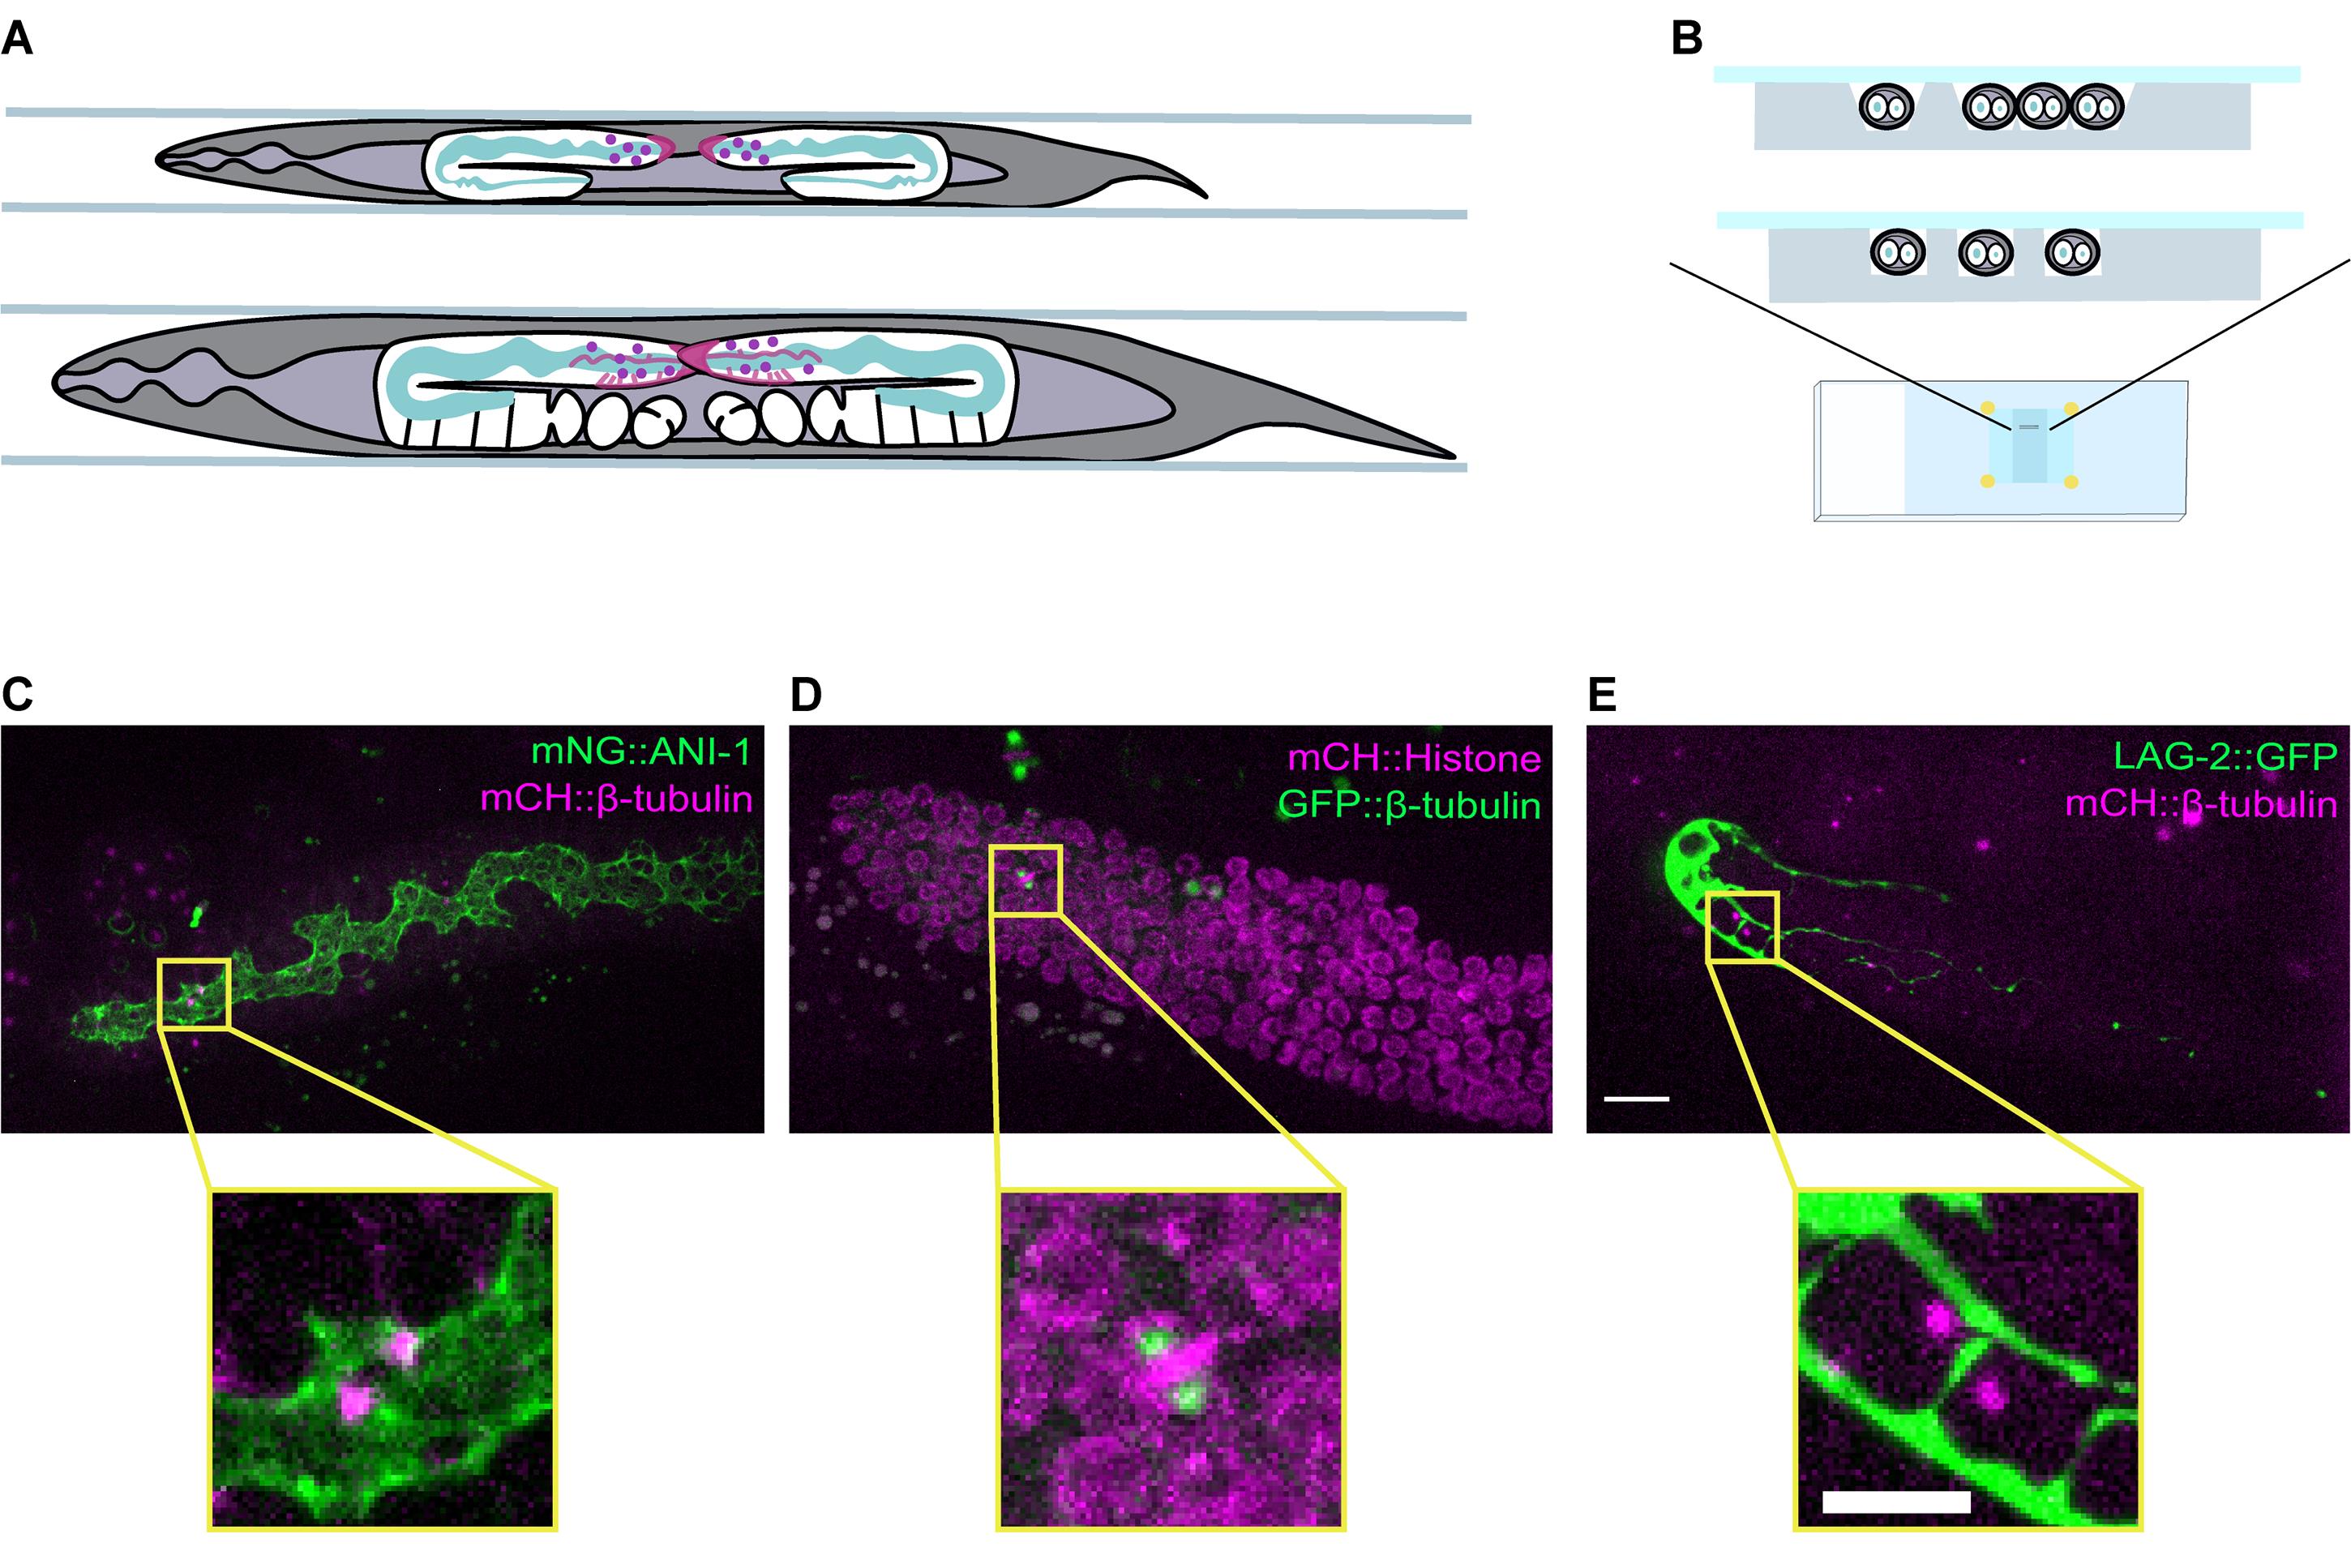
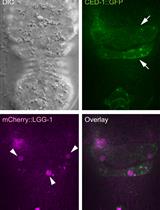
Figure 1. A mounting method allowing for live-imaging of dividing GSCs in intact C. elegans. A. Schematic showing a top view of a late L4 (top) and an adult (bottom) hermaphrodite worm mounted in grooves. The position and overall organization of the two gonad arms are shown in white, and key germline features are highlighted, such as the rachis (green), and the distal tip cell (DTC) or niche (magenta). The position of the GSCs is indicated by purple circles. B. Schematic showing a cross-sectional view of animals mounted in v-shaped (top) and square-shaped (bottom) grooves that match the width of the animals. (C-E) Maximum intensity projections of the distal gonad from adult animals expressing (C) mNG::ANI-1 (green) and mCH::β-tubulin (magenta; strain = UM679), D. GFP::β-tubulin (green) and mCH::Histone H2B (magenta; strain = JDU19), and (E) LAG-2::GFP (green) and mCH::β-tubulin (magenta; strain = UM211). A dividing GSC in each gonad is boxed in yellow and an enlarged image is shown below. Fluorescently labelled β-tubulin marks the mitotic spindle in all three strains, with mNG::ANI-1 marking the rachis, mCH::Histone H2B marking nuclei and LAG-2::GFP marking the DTC/niche. Scale bar = 10 µm (top, gonad view) and 5 µm (bottom, single cell view).
We have used this mounting method to provide the first characterization of GSC mitosis by live imaging (Gerhold et al., 2015). Recently, we investigated the technical factors that impact GSC mitosis during live imaging, which allowed us to define optimal mounting and imaging conditions, and to determine that animal starvation during mounting/imaging has the most deleterious effect on GSC mitosis (Zellag et al., 2021). Our data suggest that GSC mitosis can be imaged under near physiological conditions within an approximately 40 min window, which starts from the moment worms are removed from food. Although some GSCs enter mitosis after 40 min, we recommend caution when interpreting their behavior. In addition, under optimal conditions, the number of mitoses per germline and the duration of these mitoses in wild-type worms are relatively constant, and offer a reproducible baseline by which others may benchmark their results (see Videos 1 and 2 and Figure 4I-4K).
A parallel challenge that arises when using live imaging to study GSC mitosis is how to monitor mitotic progression. GSCs divide within the tube-shaped gonad and can divide in any orientation relative to the imaging plane, and at a range of depths relative to the gonad surface. Therefore, accurate monitoring of GSC mitosis requires a tracking method that accounts for the three-dimensional (3D) nature of their division. A good method will need to be sufficiently high-throughput to generate large data sets with minimal user time. In addition, fluorescently labelled proteins are often expressed at low levels in the germline (Merritt and Seydoux, 2010), which limits the availability of suitable markers.
We have shown that fluorescently tagged β-tubulin provides a robust marker for GSC mitotic centrosomes and that we can use centrosome-to-centrosome distance as a reliable readout for mitotic progression by tracking centrosome pairs in 3D (Gerhold et al., 2015; Zellag et al., 2021). In addition, tracking centrosome pairs can provide information on mitotic features, such as spindle dynamics and orientation (Zellag et al., 2021). To make this approach amenable to large-scale studies, we recently developed CentTracker, a largely automated image analysis pipeline that allows for fast extraction of mitotic parameters in any genetic background and in other cell types and organisms, provided that centrosomes are trackable (Zellag et al., 2021). Here, we describe the basic imaging processing steps required for using CentTracker. The relevant code and detailed instructions are freely available for download.
Materials and Reagents
60 mm Petri dish with cams (Sarstedt, catalog number: 82.1194.500)
1.5 mL microcentrifuge tube (Axygen, catalog number: MCT-150-C)
15 mL conical centrifuge tube (Fisher Scientific, catalog number: 14-959-53A)
Aspirator tube assembly for calibrated microcapillary pipettes (Sigma, catalog number: A5177-5EA)
50 µL glass micropipette (VWR, catalog number: 53432-783)
1.7 mL plastic transfer pipette (Fisher Scientific, catalog number: 13-711-41)
200 µL pipet tips (Diamed, catalog number: DIATEC520-6752)
1,250 µL pipet tips (Diamed, catalog number: DIATEC520-6501)
Single edge razorblade
Fine tipped forceps/tweezers
Lab tape (Fisher Scientific, catalog number: 15-901-10R)
18 × 18 mm #1.5 (0.16-0.19 mm) square cover glasses (VWR, catalog number: CA48366-205-1)
Microscope slides (Fisher Scientific, catalog number: 12-55-15)
Whatman 3 MM Chr blotting paper (VWR, catalog number: 21427-411), cut into ~3 cm strips
KIMTECK Kimwipes 11.2 × 21.3 cm
1-well glass depression slide (VWR, catalog number: 470235-728)
Silicon wafer micro-patterned by lithography, to give a series of parallel raised ridges with defined depth and width (Figure 2B-2C; see Note 1; hereafter “silicon mold”)
Worm pick [99.95% Platinum, 0.05% Iridium wire, 0.01 inches diameter (Tritech, catalog number: PT-9901), flattened like a spatula at one end, and mounted on a glass Pasteur pipette (Fisher Scientific, catalog number: 13-678-20A), or worm pick handle (Tritech, catalog number: TWPH1)]
Worm eyelash pick (see Note 2)
C. elegans strain(s) of preferred genotype bearing a fluorescent protein (FP) tagged centrosomal marker (if using CentTracker), with or without additional FP-tagged proteins (Figure 1C-1D; strains used in this protocol are listed in Table 1).
Note: We find that single-copy transgenes inserted by Mos1-mediated single copy insertion (MosSCI; Zeiser et al., 2011), or CRISPR-Cas9 with a single guide RNA (sgRNA) targeting a region near to established Mos1 insertion sites (Dickinson et al., 2013), and expressing FP-tagged proteins under the mex-5 promoter, and tbb-2 3’ UTR regulatory sequences produce the best results for germline-specific expression suitable for live-imaging.
Table 1. C. elegans strains used in this protocol.
Strain Genotype UM679 ltSi567[pOD1517/pSW222; Pmex-5::mCherry::tbb-2::tbb-2_3′UTR; cb-unc-119(+)] I; ani-1(mon7[mNeonGreen^3xFlag::ani-1]) III UM211 qls56[Plag2::GFP] V; wels21[Pja138(Ppie-1::mCherry::tubulin::pie-1_3’UTR)] ? JDU19 ijmSi7[pJD348/pSW077; mosI_5′mex-5_GFP::tbb-2; mCherry::his-11; cb-unc-119(+)] I; unc-119(ed3) III ARG16 ltSi567[pOD1517/pSW222; Pmex-5::mCherry::tbb-2::tbb-2_3′UTR; cb-unc-119(+)] I; ccm-3(mon9[ccm-3::mNeonGreen^3xFlag]) II E. coli strain OP50 (Brenner, 1974)
E. coli strain HT115 (Timmons and Fire, 1998)
Nematode Growth Medium (NGM) (Stiernagle, 2006; with the following modifications: 20 g agar and 3 g peptone per liter media)
Distilled water (dH2O)
10 M NaOH (Bioshop, catalog number: SHY700.1; powder dissolved in dH2O)
Commercial bleach (Bioshop, catalog number: SYP001.4; Sodium Hypochlorite, 12% Solution)
Vaseline® 100% pure petroleum jelly
Lanolin (Sigma, catalog number: L7387-250G)
Paraffin wax (Bernardin Parowax Canning Wax, 454g)
Tetramisole (Sigma, catalog number: L9756-5G)
Agarose powder (Sigma, catalog number: A9539-500G)
M9 buffer (see Recipes)
Bleaching solution (see Recipes)
Valap (see Recipes)
2% w/v Tetramisole solution (see Recipes)
3% w/v volume Agarose powder solution (see Recipes)
Equipment
Stereomicroscope with transmitted light stand (Leica, model: S6 E, Nikon, model: SMZ 745 or equivalent)
Note: We prefer stereomicroscopes with an external or LED light source, to avoid heating our worms during mounting.
Two heat blocks, one set to 95°C, and the other to 65°C (VWR, model: Standard Dry Block Heater or equivalent)
Benchtop microcentrifuge with rotor for 1.5-2 mL tubes (Eppendorf, model: 5415 D 24-tube with rotor F45-24-11, or equivalent)
Vortex mixer (Scientific Industries, model: Vortex-Genie 2, or equivalent)
Incubator set to 20°C (Sanyo, model: MIR-553, or equivalent)
Test tube rocker (Thermo Scientific, model: Vari-Mix M48725Q, or equivalent)
Single channel pipettes for 10-1,000 µL volumes (Gilson, models: Pipetman Classic P20, P200 and P1000, or equivalent)
Microwave
Spinning disc confocal microscope (Zeiss, model: Cell Observer, Quorum, model: WaveFX-X1, or equivalent) with excitation wavelengths and emission filters suitable for GFP and/or mNeonGreen and mCherry fluorescent proteins (e.g., 35-50 mW 488 nm or 491 nm, and 561 nm or 568 nm diode lasers, with ET525/50 and FF593/40 single band pass, or 466/523/600/677 quad band pass emission filters), and a high numerical aperture (NA) 63× oil objective (e.g., Leica, model: 63×/1.40-0.60 oil HCX PL APO, or Zeiss, model: 63× Plan-Apochromat DIC UV VIS-IR).
Note: If available, a high NA water immersion objective (e.g., Leica, model: HC PL APO 63×/1.20 W CORR CS2) may be preferable depending on the sample.
Spinning disk scanner (Yokogawa, model: CSU-X1)
Scientific CMOS camera (Zeiss, model: AxioCam 506 Mono, Photometrics, model: Prime BSI, or equivalent)
Software
Conda 4.9.0 or ulterior release (Anaconda, https://anaconda.org/anaconda/conda)
CentTracker Github repository: https://github.com/yifnzhao/CentTracker
Fiji 1.52v or ulterior release that includes TrackMate (Schindelin et al., 2012; Tinevez et al., 2017)
MATLAB 2020b or ulterior release (MathWorks, https://www.mathworks.com/products/matlab.html)
Procedure
文章信息
版权信息
© 2022 The Authors; exclusive licensee Bio-protocol LLC.
如何引用
Readers should cite both the Bio-protocol article and the original research article where this protocol was used:
- Zellag, R. M., Zhao, Y. and Gerhold, A. R. (2022). Live-cell Imaging and Analysis of Germline Stem Cell Mitosis in Caenorhabditis elegans. Bio-protocol 12(1): e4272. DOI: 10.21769/BioProtoc.4272.
- Zellag, R. M., Zhao, Y., Poupart, V., Singh, R., Labbé, J. C. and Gerhold, A. R. (2021). CentTracker: a trainable, machine-learning-based tool for large-scale analyses of Caenorhabditis elegans germline stem cell mitosis. Mol Biol Cell 32(9): 915-930.
分类
干细胞 > 生殖细胞
发育生物学 > 细胞生长和命运决定
细胞生物学 > 细胞成像 > 活细胞成像
您对这篇实验方法有问题吗?
在此处发布您的问题,我们将邀请本文作者来回答。同时,我们会将您的问题发布到Bio-protocol Exchange,以便寻求社区成员的帮助。