

GeneWeld: Efficient Targeted Integration Directed by Short Homology in Zebrafish
GeneWeld:斑马鱼短同源性诱导的高效靶向整合
发布: 2021年07月20日第11卷第14期 DOI: 10.21769/BioProtoc.4100 浏览次数: 12098
评审: Achira RoyJingwen YuAnonymous reviewer(s)

参见作者原研究论文
The authors used this protocol in:

May 2020


Abstract
Efficient precision genome engineering requires high frequency and specificity of integration at the genomic target site. Multiple design strategies for zebrafish gene targeting have previously been reported with widely varying frequencies for germline recovery of integration alleles. The GeneWeld protocol and pGTag (plasmids for Gene Tagging) vector series provide a set of resources to streamline precision gene targeting in zebrafish. Our approach uses short homology of 24-48 bp to drive targeted integration of DNA reporter cassettes by homology-mediated end joining (HMEJ) at a CRISPR/Cas induced DNA double-strand break. The pGTag vectors contain reporters flanked by a universal CRISPR sgRNA sequence to liberate the targeting cassette in vivo and expose homology arms for homology-driven integration. Germline transmission rates for precision-targeted integration alleles range 22-100%. Our system provides a streamlined, straightforward, and cost-effective approach for high-efficiency gene targeting applications in zebrafish.
Graphic Abstract:
GeneWeld method for CRISPR/Cas9 targeted integration.
Background
Designer nucleases have rapidly expanded the way in which researchers can utilize endogenous DNA repair mechanisms for creating gene knock-outs, reporter gene knock-ins, gene deletions, single nucleotide polymorphisms, and epitope-tagged alleles in diverse species (Beumer et al., 2008; Geurts et al., 2009; Bedell et al., 2012; Carlson et al., 2012; Yang et al., 2013). A single dsDNA break in the genome results in increased frequencies of recombination and promotes integration of homologous recombination (HR)-based vectors (Orr-Weaver et al., 1981; Hasty et al., 1991; Rong and Golic, 2000; Zu et al., 2013; Shin et al., 2014; Hoshijima et al., 2016). Additionally, in vitro or in vivo linearization of targeting vectors stimulates homology-directed repair (HDR) (Orr-Weaver et al., 1981; Jasin and Berg, 1988; Hasty et al., 1991; Rong and Golic, 2000; Zu et al., 2013; Shin et al., 2014; Hoshijima et al., 2016). Utilizing HDR or HR at a targeted double-strand break (DSB) allows directional knock-in of exogenous DNA with base-pair precision; however, reported frequencies vary widely, and engineering targeting vectors with long homology arms is not straightforward.
Previous work has shown that Xenopus oocytes have the ability to join or recombine linear DNA molecules that contain short regions of homology at their ends, and this activity is likely mediated by exonuclease activity, allowing base pairing of the resected homology (Grzesiuk and Carroll, 1987). More recently, it was shown in Xenopus, silkworm, zebrafish, and mouse cells that a plasmid donor containing short (≤40 bp) regions of homology to a genomic target site can promote precise integration at the genomic cut site when the donor plasmid is cut adjacent to the homology (Nakade et al., 2014; Hisano et al., 2015; Aida et al., 2016). Gene targeting is likely mediated by the alternative-end joining/microhomology-mediated end joining (MMEJ) pathway or by a single-strand annealing (SSA) mechanism (Ceccaldi et al., 2016), collectively referred to as a homology mediated end joining (HMEJ). In contrast, in human cell culture, linear donors using a similar strategy with homologous ends have been reported to show inefficient integration until homology domains reach ~600 bp (Zhang et al., 2017), suggesting different repair pathways may predominate depending on cell type. In the initial reports using short regions of homology for in vivo gene targeting in zebrafish, the level of mosaicism in F0 injected animals was high, resulting in inefficient recovery of targeted alleles through the germline (Nakade et al., 2014; Hisano et al., 2015; Aida et al., 2016; Luo et al., 2018). Most recently, studies in Drosophila show efficient integration of exogenous DNA in flies and S2 cells using 100 bp homology arms flanked by a CRISPR target site for in vivo homology liberation (Kanca et al., 2019). Together, these studies suggest that a strategy that combines short homology flanked donors with in vivo homology arm liberation should lead to efficient precision targeting in zebrafish and mammalian cells.
Here, we present GeneWeld, a HMEJ strategy for targeted integration directed by short homology that we demonstrated leads to efficient germline transmission rates for recovery of targeted alleles in zebrafish (Wierson et al., 2020). We provide a suite of donor vectors, called pGTag, that can be easily engineered with homologous sequences (homology arms) to a gene of interest and a web interface for designing homology arms (Mann et al., 2019). Homology of 24 or 48 base pairs directly flanking the cargo DNA promotes efficient gene targeting in zebrafish, with germline transmission rates averaging approximately 50%. The tools and methodology described here provide a tractable solution to creating precise targeted integrations and open the door for more advanced genome editing strategies using short homology. The following detailed protocol outlines steps for gRNA selection, homology arm design, vector construction, CRISPR/Cas targeting, and recovery of targeted integration alleles.
Materials and Reagents
Polystyrene Petri dishes (Thermo Fisher, catalog number: FB0875713)
Borosilicate Glass Capillaries (World Precision Instruments, catalog number: 1B100-04)
Microloader tips (Eppendorf, catalog number: 920001007)
Commercially available molds for injection plates available from https://www.agnthos.se/index.php?id_product=204&controller=product
Kwik-Fill borosilicate glass capillaries (World Precision Instruments, catalog number: 1B100-4)
EasyStrip Plus Tube Strip with Attached Ultra Clear Caps (Thermo Fisher Scientific catalog number: AB2005)
pGTag vectors are available through Addgene (https://www.addgene.org/kits/essner-geneweld/)
NEB Stable Competent E. coli (New England Biolabs, catalog number: C3040I)
One Shot TOP10 Chemically Competent E. coli (Thermo Fisher, Invitrogen, catalog number: C404010)
pT3TS-nCas9n expression vector (Addgene, catalog number: 46757)
PureYield Plasmid Miniprep System (Promega, catalog number: A1223)
Ambion mMessage Machine T3 Transcription Kit (Thermo Fisher, catalog number: AM1348)
miRNeasy Mini Kit (Qiagen, catalog number: 217004)
NEBNext Ultra II DNA Library Prep Kit for Illumina (New England Biolabs, catalog number: E7645L)
Zebrafish Tg (miniTol2<14XUAS:mRFP, γcry:GFP>)tl2 (Balciuniene et al., 2013)
Zebrafish wild-type WIK strain (Zebrafish International Resource Center, catalog number: ZL84, https://zebrafish.org/home/guide.php)
Agarose (Thermo Fisher, catalog number: BP160-500)
Ethidium Bromide (Fisher Scientific, catalog number: BP1302-10)
Ethyl 3-aminobenzoate methanesulfonate, Tricaine MS-22 C9H11NO2·CH4SO3 (Millipore Sigma catalog number 886-86-2)
1-phenyl-2-thiourea C7H8N2S (Thermo Fisher, catalog number: AC207250050)
NorthernMax-Gly Sample Loading Dye (Thermo Fisher, catalog number: AM8551)
Decon ElIMINase (Fisher Scientific, catalog number: 04-355-31)
Molecular Grade RNase/DNase-Free water (e.g., Invitrogen, catalog number: 10977023)
XbaI restriction endonuclease (New England Biolabs, catalog number: R0145S)
BfuAI restriction endonuclease (New England Biolabs, catalog number: R0701S)
BspQI restriction endonuclease (New England Biolabs, catalog number: R0712S)
GoTag Green 2× MasterMix (Promega, catalog number: M7123)
X-Gal solution, ready-to-use, 20mg/ml (Thermo Fisher Scientific, catalog number: R0941)
LB broth (Fisher Scientific, catalog number: BP9723-500)
LB agar (Fisher Scientific, catalog number: BP9724-2)
SOC medium (Thermo Fisher Scientific, catalog number: 15544034)
Kanamycin (Fisher Scientific, catalog number: BP9065)
T4 Quick Ligase, Rapid DNA Ligation Kit (Thermo Fisher Scientific, catalog number: K1422)
Sodium Hydroxide NaOH (Millipore, Sigma-Aldrich, catalog number: 30620)
Tris Base (Fisher Scientific, catalog number: BP152-500)
UgRNA
5’-GGGAGGCGUUCGGGCCACAGGUUUUAGAGCUAGAAAUAGCAAGUUAAAAUAAGGCUAGUCCGUUAUCAACUUGAAAAAGUGGCACCGAGUCGGUGCGGAUC-3’ and gene-specific sgRNAs ordered from Synthego (https://orders.synthego.com/products/crisprevolution-sgrna-ez-kit-13/#/tubes?mod_code=1) or IDT https://www.idtdna.com/site/order/oligoentry/index/crispr (see Section B.)
Primers, can be ordered from IDT:
F3'-check: 5'-GGCGTTGTCTAGCAAGGAAG-3'
R3’ pgtag seq: 5'-ATGGCTCATAACACCCCTTG-3'
R-Gal4-5'juncM: 5’-GCCTTGATTCCACTTCTGTCA-3’
R-RFP-5'junc: 5’-CcttaatcagttcctcgcccttagA-3’
R-eGFP-5'-junc: 5’-gctgaacttgtggccgttt-3’
F-Gal4-3'juncM: 5’-GCAAACGGCCTTAACTTTCC-3’
F-Gal4-3'junc: 5’-CTACGGCGCTCTGGATATGT-3’
F-RFP-3'junc: 5’-cgacctccctagcaaactgggg-3’
F-eGFP-3'junc: 5’-Acatggtcctgctggagttc-3’
Zebrafish embryo E2 Medium (see Recipes)
Equipment
Microcap Microliter Pipets (Drummond Scientific, catalog number: 1-000-0010)
Flaming/Brown Micropipette Puller (Sutter Instrument, model: P-97)
X-Cite 120W Metal Halide lamp (Excilitas Technologies, model: X-Cite 120Q)
Pico-Injector (Harvard Apparatus, model: PLI-100)
MM-3 Micromanipulator (Narishige, model: MM-3)
Nitrogen gas tank, or JUN-AIR Oil-lubricated Piston Air Compressor (Cole-Parmer, catalog number: 1152000)
Nanodrop (Thermo Fisher Scientific, model: NanoDrop 2000)
iBright FL1500 Imaging System (Thermo Fisher Scientific, model: A44241)
Shaking Incubator (Thermo Scientific, model: MaxQ8000)
Isotemp Standard Laboratory Incubator (e.g., Thermo Scientific, model: 51-028-065HPM)
Precision General Purpose Baths (e.g., Thermo Scientific, model: TSGP02)
Thermal Cycler (Eppendorf, 6335000020)
Zeiss SteREO Discovery.V8 Stereomicroscope or similar and epi-illumination X-Cite 120W metal halide light source with fiber optic cable (Excilitas Technologies)
Owl EasyCast B2 Mini Gel Electrophoresis Systems (Thermo Fisher Scientific, model: B2-12)
Software
GTagHd, Gene Sculpt Suite www.genesculpt.org/gtaghd/ (Mann et al., 2019)
CRISPRScan http://www.crisprscan.org/ (Moreno-Mateos et al., 2015)
Primer 3 http://biotools.umassmed.edu/bioapps/primer3_www.cgi
Synthego ICE Analysis https://ice.synthego.com/#/
Cas-Analyzer at CRISPR RGEN Tools http://www.rgenome.net/cas-analyzer/#
GraphPad Prism https://www.graphpad.com/scientific-software/prism/
Procedure
The GeneWeld protocol is associated with the publication Wierson et al. (2020).
Table of Contents
Introduction
Selection of a CRISPR/spCas9 sgRNA target site, ordering sgRNAs, and in vitro synthesis of spCas9 mRNA
Injection of sgRNA and spCas9 mRNA
Testing for sgRNA mutagenesis efficiency and indel production
Design short homology arms for pGTag targeting vector assembly
One Pot Cloning of Homology Arms into pGTag Vectors
Injection of GeneWeld reagents (spCas9 mRNA, Universal sgRNA (UgRNA), genomic sgRNA, and pGTag short homology vector) into 1-cell zebrafish embryos
Test injected embryos for evidence of precision on-target integration
Establish a new transgenic line of a precision targeted integration allele
Introduction
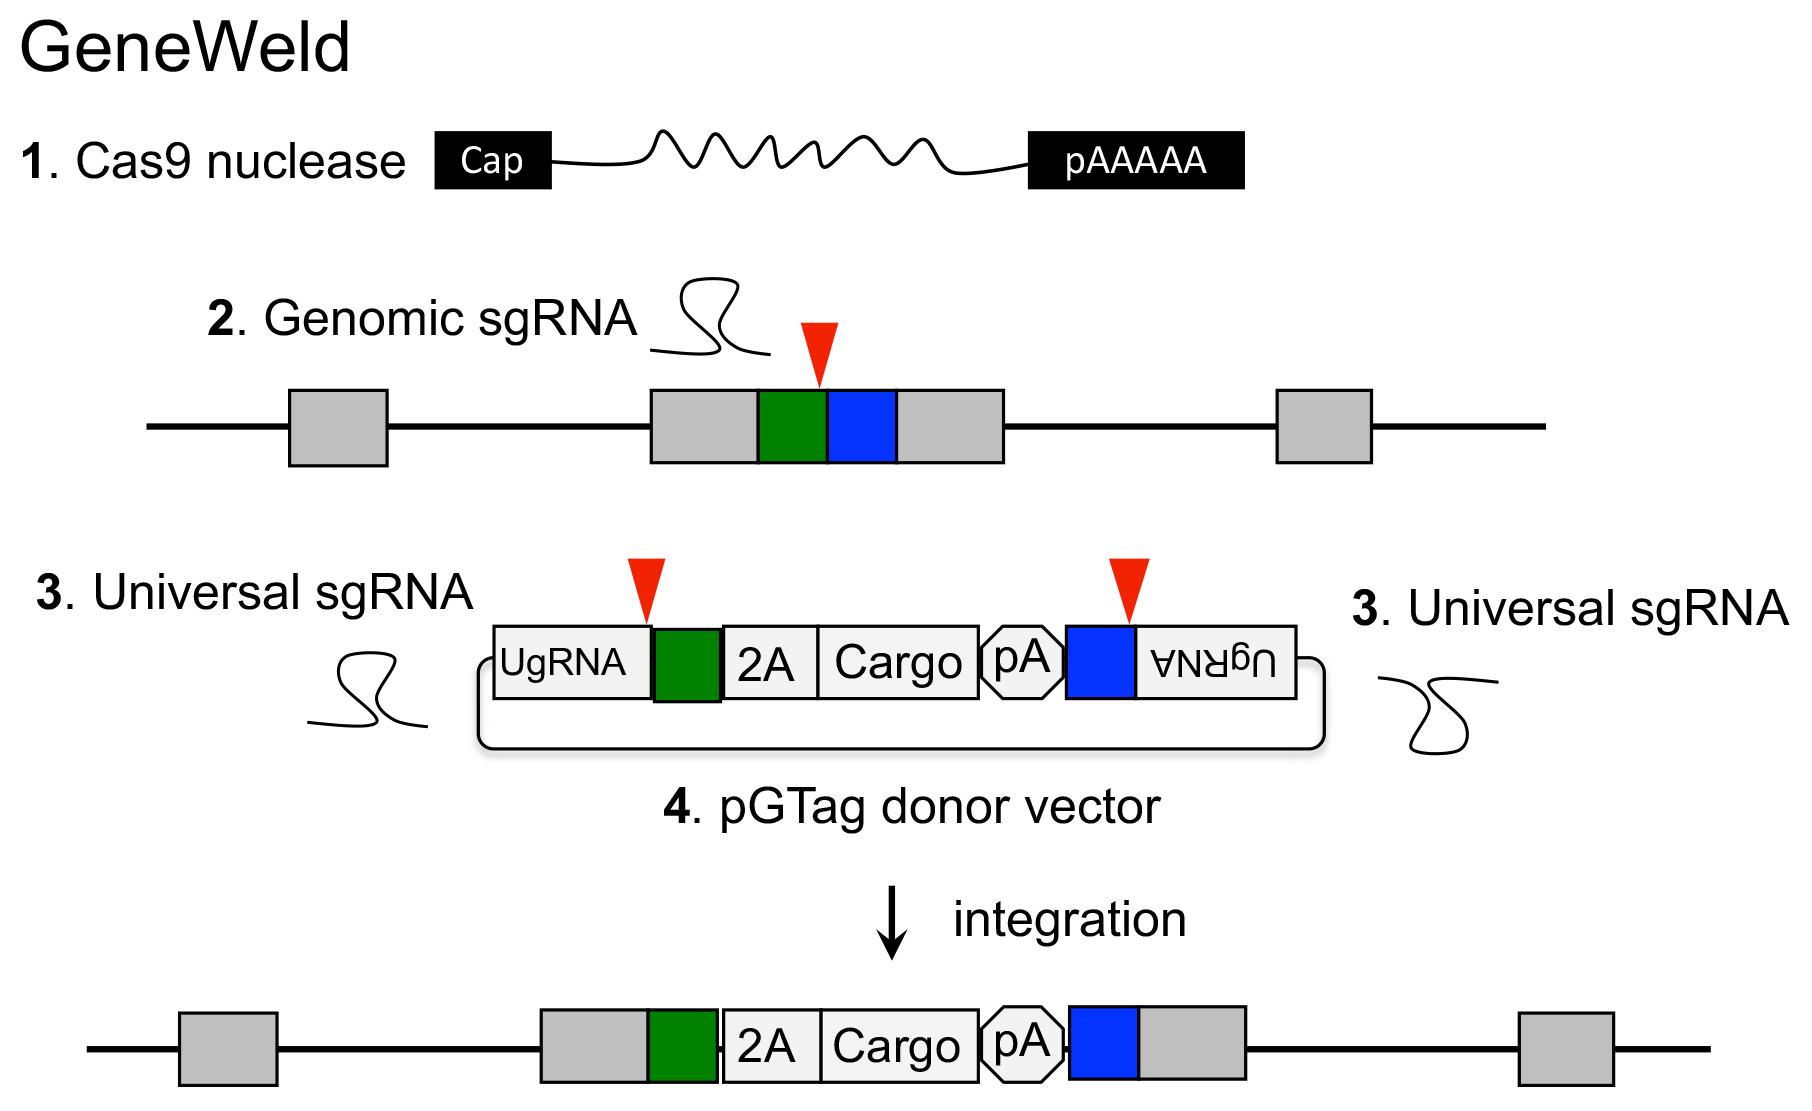
The GeneWeld strategy (Figure 1) and pGTag vector series are designed for straightforward assembly of vectors containing short homology arms for efficient CRISPR/Cas9-directed recovery of germline precision targeted integration alleles.
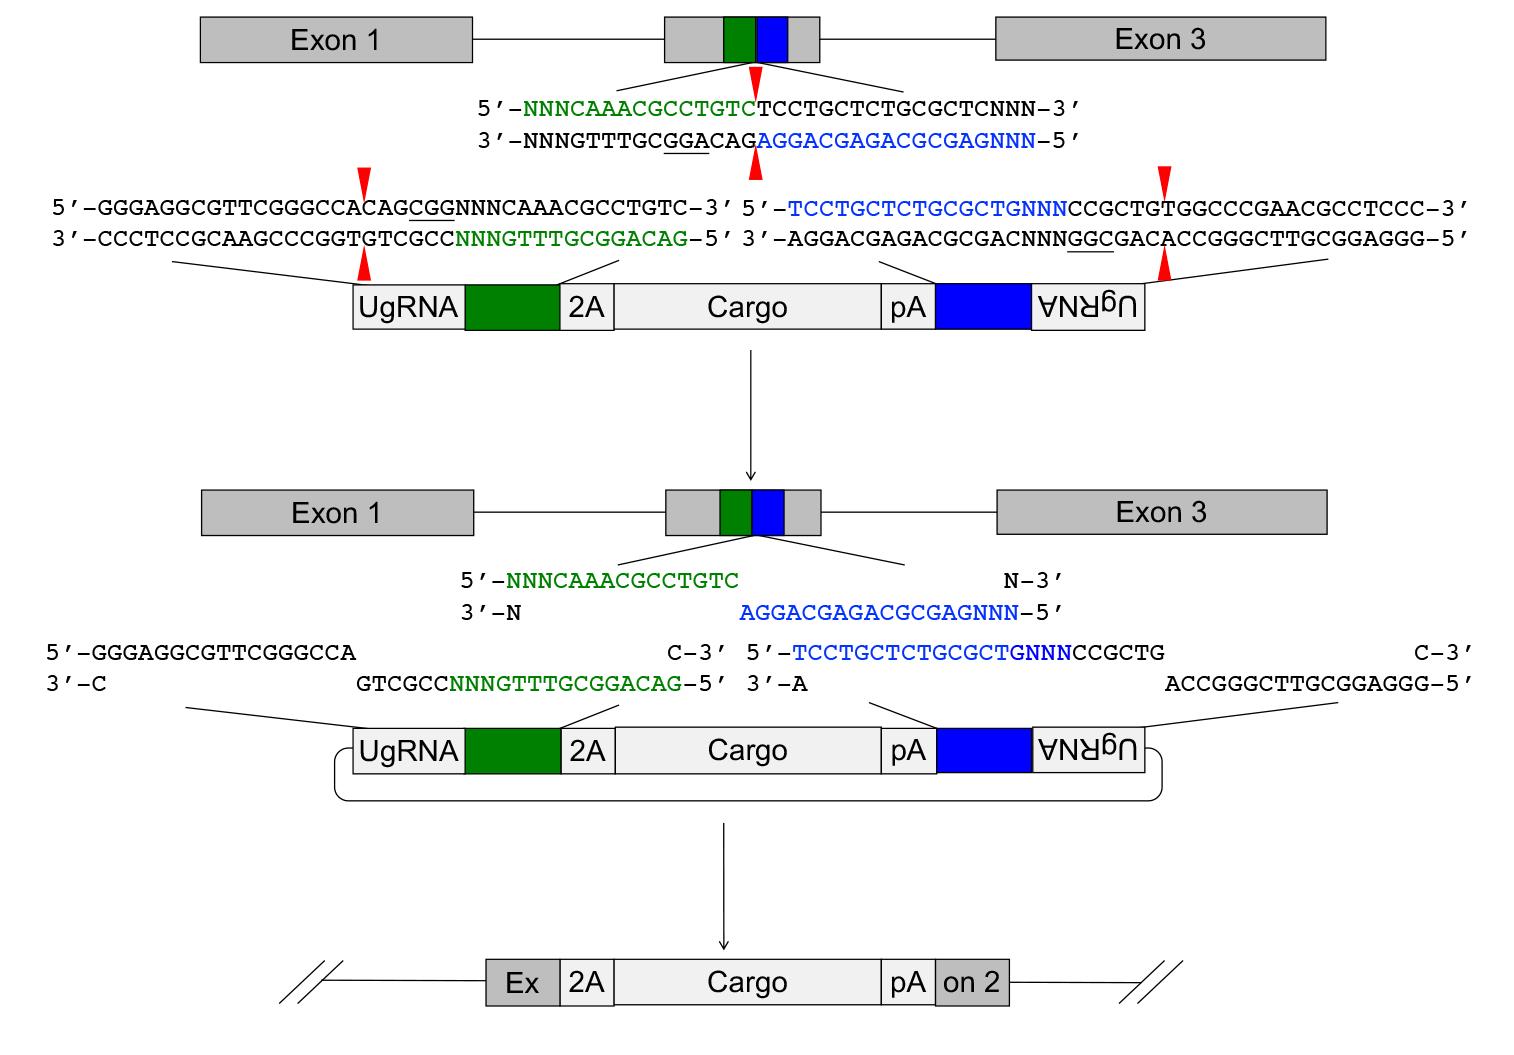
Figure 1. Targeted integration of pGTag vector cargo DNA into a 5’ coding exon. Short homology arms complementary to the 5’ (green) and 3’ (blue) sequences of the genomic target site are cloned on the 5’ and 3’ sides of the vector cargo DNA. The short homology arm cargo cassette is flanked by two universal guide RNA UgRNA sites. CRISPR/Cas9 simultaneously targets double-strand breaks at the sgRNA genomic target site and at the UgRNA sites flanking the cargo on the plasmid donor. Exonuclease end resection liberates single-stranded DNA in the vector homology arms that is complementary to the resected strands on the 5’ and 3’ sides of the genomic double-strand break. The complementary sequences direct homology mediated end joining integration of the cargo DNA at the exon target site. PAM sequences are underlined, and small red arrows indicate Cas9 cut sites in the genome and vector.Selection of a CRISPR/spCas9 target site in the gene of interest
Zebrafish wild-type strains in common use are polymorphic.
Note: It is highly recommended to first sequence the target exon in the genomic DNA from your fish strain and use this sequence to design gRNAs.
To identify an sgRNA site for targeting, first, view the gene model on a genome browser and download the gene sequences.
At <ensembl.org> Search for the gene name of interest for the species of interest and open the Transcript page (Figure 2).
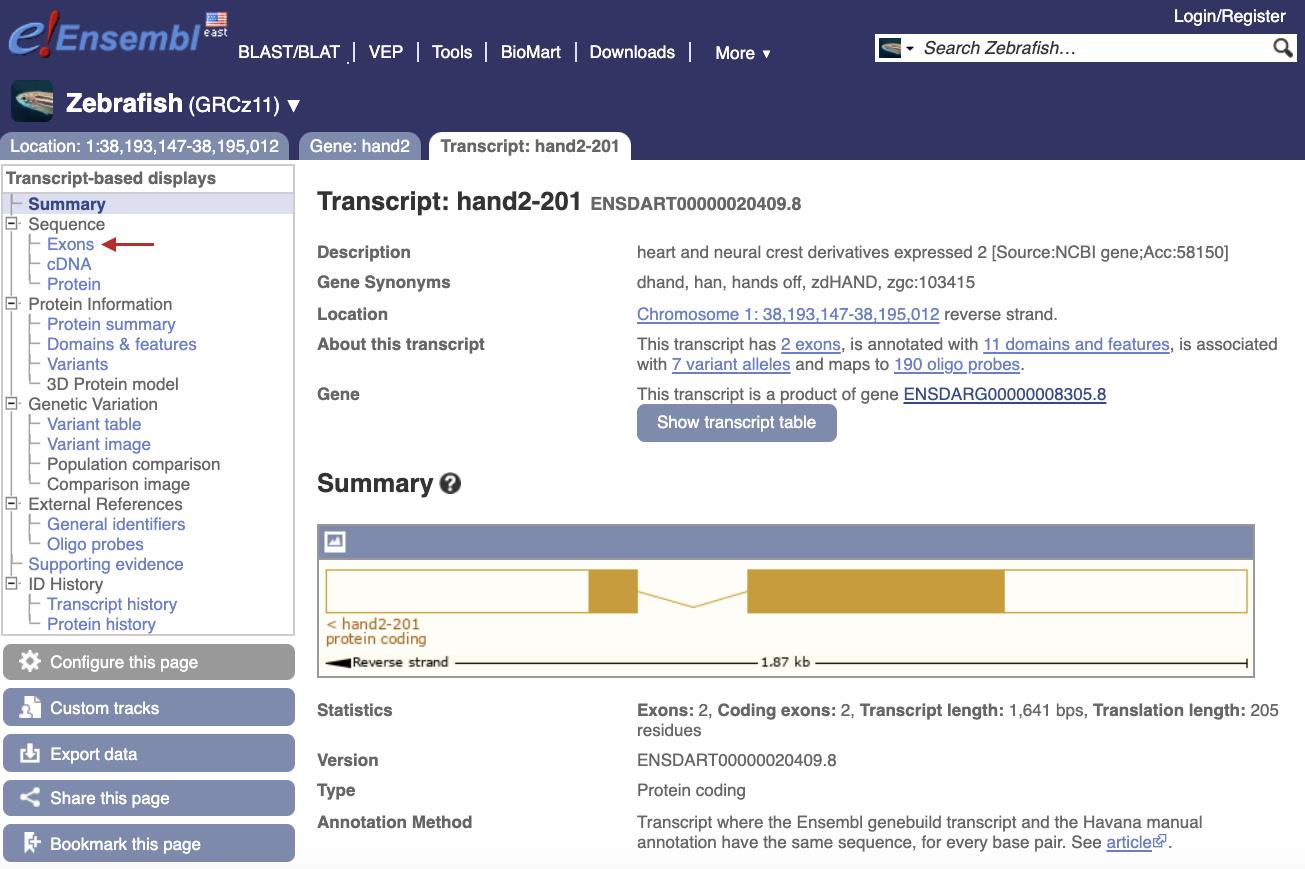
Figure 2. Screenshot of zebrafish hand2 Transcript page on the ensembl.org genome browser (https://useast.ensembl.org/Danio_rerio/Transcript/Summary?db=core;g=ENSDARG00000008305;r=1:38193147-38195012;t=ENSDART00000020409)In the left-hand side bar click on “Exons” to find the first coding exon and initiation ATG (Figure 3).
Note: If there are alternative transcripts for the gene, make sure there are not alternative initiation ATGs. If there are alternative start codons, target the first exon that is conserved in all transcripts to generate a strong loss-of-function allele.
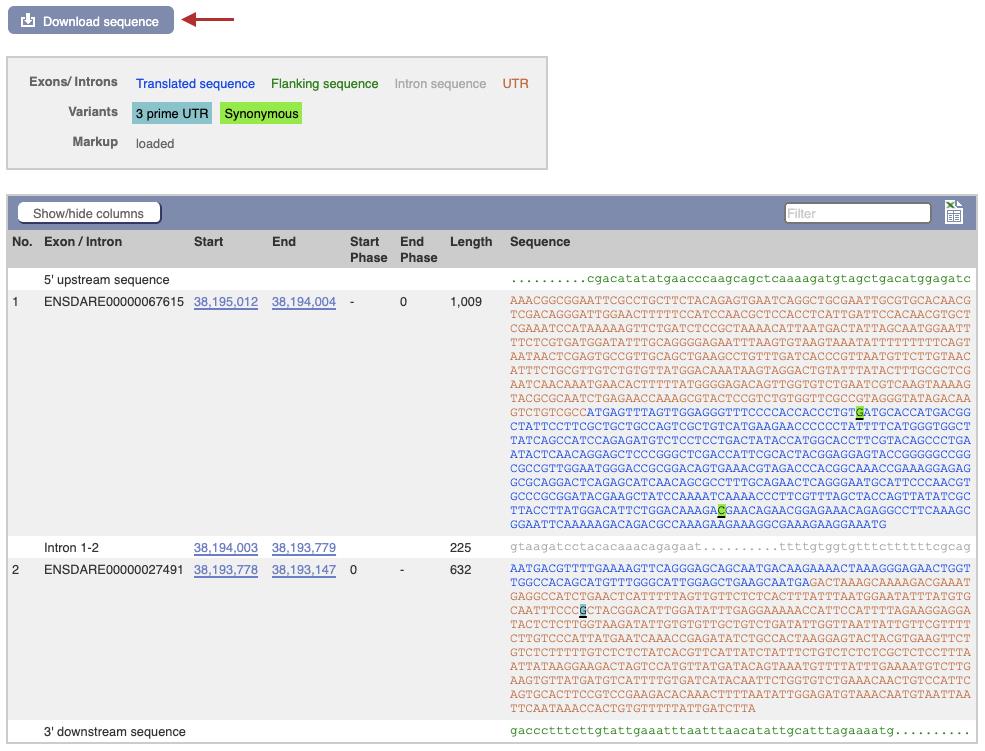
Figure 3. Exon sequences and Download page for zebrafish hand2 gene on the ensembl.org genome browserClick on the Download sequence button (Figure 3, red arrow). A list of choices for genomic, coding, untranslated regions, and intronic sequences is shown. Select the cDNA and target exon and download as separate sequence files.
Using ApE <http://biologylabs.utah.edu/jorgensen/wayned/ape/> or SnapGene, annotate the coding sequence with the exons.
Design primers to amplify the target exon from fin clip genomic DNA and sequence the amplicon. Use this sequence to identify gRNA sites either manually, by searching for PAM sequences, or using CRISPRScan. Remove additional “Gs” CRISPRScan added to the 5’ end. Select a sgRNA location that does not have an in-frame ATG downstream of the sgRNA target site. Annotate the selected target sequence and NGG PAM in the cDNA sequence files.
Synthetic sgRNAs can be ordered from Synthego or IDT. On the Synthego ordering page, select “2’-O-Methyl at 3 first and last bases, 3’ phosphorothioate bonds between first 3 and last 2 bases” the Modifications tab.
Design ~20 bp DNA primers for a PCR amplicon of ~130 bp of DNA surrounding the sgRNA target site. These primers will be used to amplify genomic DNA from embryos after injection of CRISPR reagents to test for mutagenesis at the target site. The presence of indels at the target site can be detected in the PCR products in multiple ways, including gel electrophoresis to visualize heteroduplex formation, resistance to restriction enzyme digestion at a site overlapping the sgRNA target and direct sequencing followed by ICE Analysis.
Users can design primers with Primer 3 http://biotools.umassmed.edu/bioapps/primer3_www.cgi.
Paste DNA sequence surrounding the target site into the web interface. It is recommended to use 160-300 bp of exon sequence centered on the cut site for primer design. Intron sequence can be used, but this often contains polymorphisms that can lead to amplification failure.
Locate the target sequence, including the PAM sequence NGG (underlined, Bold in the example below), and predict the cut site (3 bp upstream of the PAM represented here by the ‘x’). Mark the targeted exon sequence approximately 65-150 bp on both sides of the cut site by putting [square brackets, highlighted in yellow] around it. Primer3 will design primers outside this sequence. This design allows the primers to be used for both checking of mutagenesis and for junction fragment analysis when checking for integration.
Example:
CGGCCTCGGGATCCACCGGCC[AGAATCGATATACTACGATGAACAGAGCAAATTTGTGTGTAATACGGTCGCCACCATGGCCTxCCTCGGTTTGCTACGATGCATTTGCACCACTCTCTCATGTCCGGTTCTGGG]AGGACGTCATCAAGGAGTTCATGCGCTTCAAGGTGCGCATGGAGGGCTCCGTGAACSet the “Primer Size” variables to Min = 130, Opt = 170, and Max = 300. Everything else can be left at the defaults.
Click on “Pick Primers.”
Select primers from the output. Note the “product size” expected and the “tm” or melting temperature of each primer/pair. Mutagenesis is easier to visualize in smaller product sizes.
Preparation of SpCas9 mRNA
Digest ~5-10 μg pT3TS-nCas9n plasmid (plasmid Addgene #46757) (Jao et al., 2013) with Xba1 to linearize the vector.
Purify linearized DNA with a Qiagen PCR cleanup kit or Promega PureYield Plasmid Miniprep System. Elute in RNase-free water.
Run 100-500 ng on a 1.2% agarose gel in 1× TAE to confirm the plasmid is linearized.
Use 100 ng to 1 μg DNA as template for in vitro transcription reaction with the mMESSAGE mMACHINE T3 kit Life Technologies (AM1348). Follow the manufacturer’s instructions provided with the kit. Save a 1 ul aliquot of the in vitro synthesis reaction.
Use the miRNeasy Qiagen kit the purify the nCas9n mRNA according to the manufacturer’s instructions.
Verify mRNA integrity by running a sample of the in vitro synthesized mRNA on a gel, before and after the miRNeasy Qiagen kit cleanup. Mix 1 μl of Cas9 mRNA, 4 μl of Molecular Grade RNase/DNase-free water, and 5 μl glyoxal dye (NorthernMax-Gly Sample Loading Dye, Thermo Fisher, AM8551).
Heat mixture at 50 °C for 30 min in a water bath or thermal cycler, then place on ice.
Clean the gel box, comb, and tray with Decon ElIMINase and rinse with DI water.
Run all 10 μl of RNA mixture on a 1.2% agarose gel in 1× TAE at 100 V for 1 h as described above. Image gel in an iBright FL1500 Imaging System or another gel-documentation imaging system. One band should be visible at ~4.5 kb.
Determine the concentration of the RNA sample using a Nanodrop. Concentrations between 0.45 and 1 μg/μl are expected.
Aliquot and store RNA at -80 °C.
Injection of sgRNA and spCas9 mRNA
Deliver 25 pg sgRNA and 300 pg Cas9 mRNA in a 2 nl volume to embryos at the one-cell stage. Below is a step-by-step protocol for zebrafish embryo injection.
A detailed video of zebrafish embryo injection can be found in Rosen et al. (2009). Cast zebrafish embryo injection trays with custom molds that create 45° troughs for lining up and holding embryos (Figure 4A). Molds are also available commercially (see Materials and Reagents).
Melt 1.2% agarose in 1× E2 Medium and pour into a polystyrene Petri dish. The mold is set on top (Figure 4B), and, once the plates have set, gently remove the mold (Figure 4C). Injection trays can be used multiple times and are stored inverted at 4 °C for up to three weeks between use.
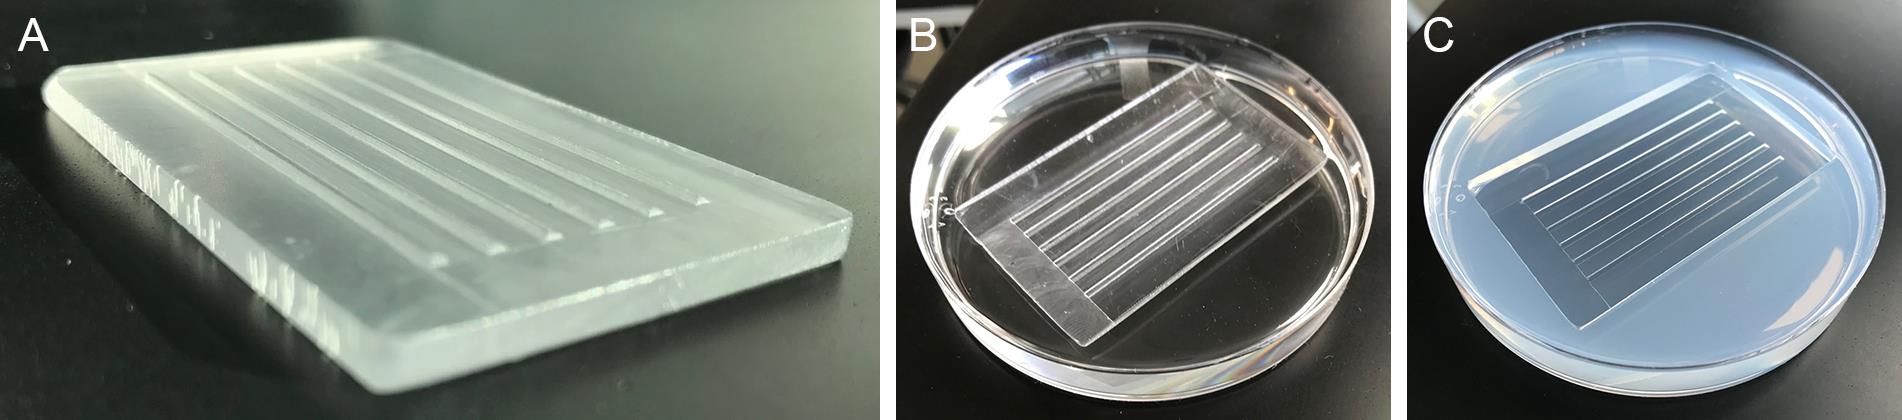
Figure 4.Injection tray mold. The injection tray mold (A) is set on top of melted 1.2% agarose (B). Solidified injection plate with troughs to hold embryos (C).
Pre-warm injection trays to 28.5°C prior to injection by placing them in a 28.5°C incubator for 20 min.
Pull microcapillary glass needles using Kwik-Fill borosilicate glass capillaries on a Sutter Instrument Flaming/Brown Micropipette Puller.
Prepare injection samples containing the following diluted in Molecular Grade RNase/DNase-free water:
12.5 ng/μl of genomic sgRNA
150 ng/μl of mRNA for Cas9
Keep injection solution on ice
Backload needles with injection solution using microloader pipet tips and attach to a micromanipulator. Connect the needle holder tubing to a Harvard Apparatus PLI-90 Pico-injector. Turn on nitrogen gas or the air compressor to pressurize the system and set injection pressure to 40 PSI with an injection time of 100-200 ms.
Calibrate injection needle by first breaking the end of the tip off with sterile tweezers (Figure 5A, B). Use the pedal to expel 10 droplets and capture each droplet with a 30 mm long capillary tube that represents a volume of 1 μl (Figure 5C). Measure the distance from the end of the capillary to the meniscus of the liquid and convert to a volume of 1 mm = 30 nl; therefore, 2/3 of a mm = 20 nl. The volume of each droplet is adjusted by changing the injection time to achieve 2 nl droplets. There is a linear relationship between volume and time at a set pressure. Avoid injection times lower than 100 ms and higher than 400 ms.
Transfer one-cell embryos from collection Petri dishes to the troughs on the pre-warmed agarose injection tray (Figure 5D). Each embryo is encased in a chorion. As the embryos near the first cell division at 45 minutes after fertilization, the single cell is clearly visible atop the yolk (Figure 5D).
Use the micromanipulator to pierce the needle through the chorion and into the embryo. Inject 2 nl of sample at the center of the yolk interface/boundary between the single cell and the yolk (Figure 5E, white arrow points to interface where needle tip is placed). Inject embryos before the first cell division begins.
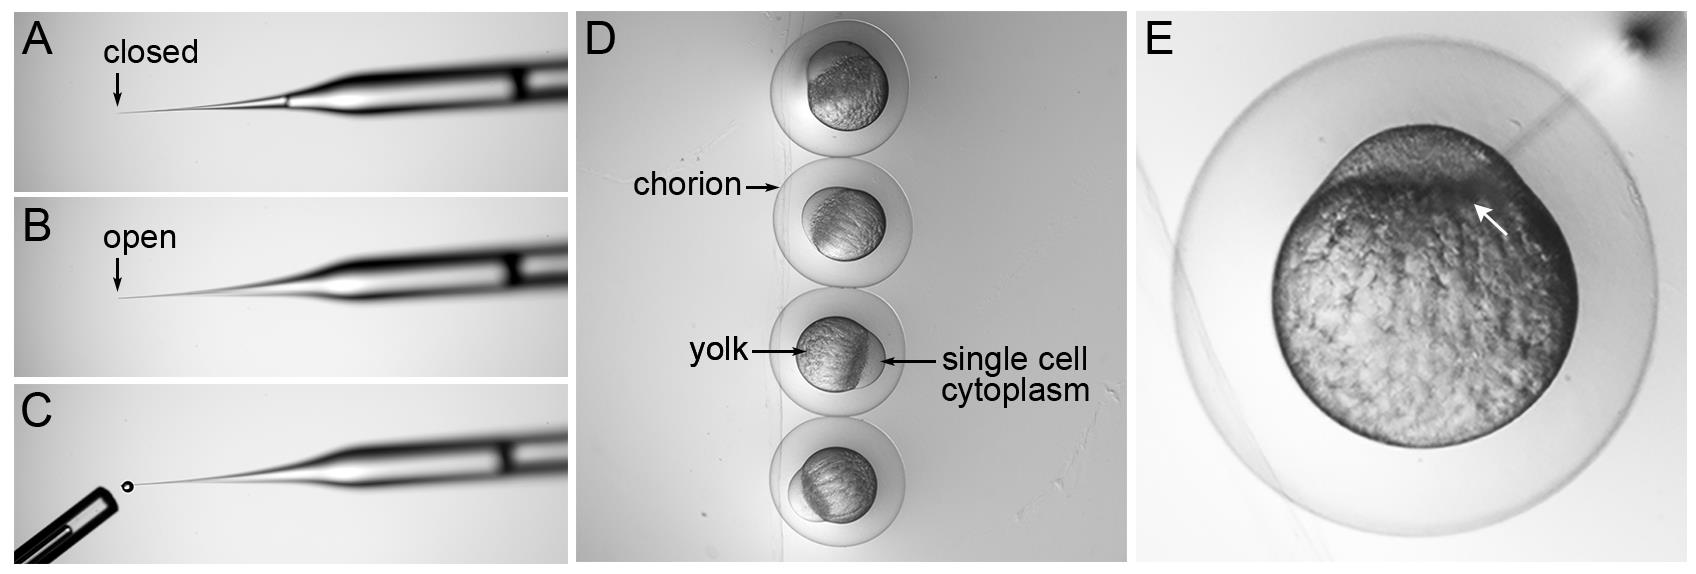
Figure 5. Microinjection needle calibration and zebrafish single-cell embryo microinjection. (A) Backloaded injection needle with closed tip. (B) A small portion at the tip of the needle is removed using forceps to create an open end. (C) A single droplet of injection solution is expelled by pressing on the injection apparatus pedal. The tip of a 1 μl Drummond capillary tube that was used to capture 10 drops is shown. (D) Embryos lined up in an injection tray trough with labels indicating the chorion, yolk, and single-cell embryo. (E) Needle inserted through the chorion and into the embryo. The tip of the injection needle is positioned at the yolk interface (white arrow) between the single cell on top and the yolk below. The image in (E) was published in Almeida et al. (2021).After injection, wash the embryos from the injection tray into a clean Petri dish with embryo media.
Keep 20-40 embryos separate to use as uninjected controls.
At 3-5 h post injection, remove any unfertilized or dead embryos from the dishes.
Test for sgRNA mutagenesis efficiency and indel production
Biallelic inactivation can lead to loss of function of essential genes that may be lethal. After injection, count and remove dead embryos from the dish. If all embryos are defective and unlikely to survive, reduce the amount of guide sgRNA that is injected to 12.5 pg. If embryos still fail to survive, reduce the amount of sgRNA further to 6.25 pg. As we reported previously, for a ubiquitously expressed, essential gene such as the tumor suppressor rb1, the amount of injected sgRNA needs to be reduced to 6.25 pg to recover viable juvenile fish that survive to adulthood and transmit germline gene-edited alleles (Solin et al., 2015).
Digestion of embryos for isolation of genomic DNA for mutagenesis analysis.
Extract genomic DNA from either individual or pools of five embryos from the same injection, aged between 1 and 5 dpf, using the following protocol previously published (Wierson et al., 2020).
Dechorionate embryos if they have not emerged from the chorion.
Place embryo into a PCR tube and remove as much of the fish water as possible. Collect at least three injected embryos and one uninjected control embryo.
Add 20 μl of 50 mM NaOH per embryo.
Heat the embryos at 95°C in a thermocycler for 30 min.
Vortex samples and spin the tubes down. The embryos should be completely dissolved.
Neutralize the samples by adding 1 μl of 1 M Tris pH 8.0 per 10 μl NaOH. Mix by vortexing, then spin down.
Genomic DNA is stored at -20°C.
Analysis of CRISPR/Cas9 mutagenesis efficiency at targeted gene locus.
Remove genomic DNA samples from -20°C and place on ice to thaw. Keep thawed genomic DNA on ice at all times.
Set up the following PCR reactions for each tube of embryo digested genomic DNA using the gene-specific Forward and Reverse primers that were designed to create an amplicon around the CRISPR/Cas9 target site.
12.5 μl of 2× GoTaq Mastermix
1 μl of Forward Primer (10 μM)
1 μl of Reverse Primer (10 μM)
1 μl of gDNA template (digested embryos)
9.5 μl of nuclease-free water
For a 25 μl total
Flick the tubes to mix and briefly spin down the PCR reactions.
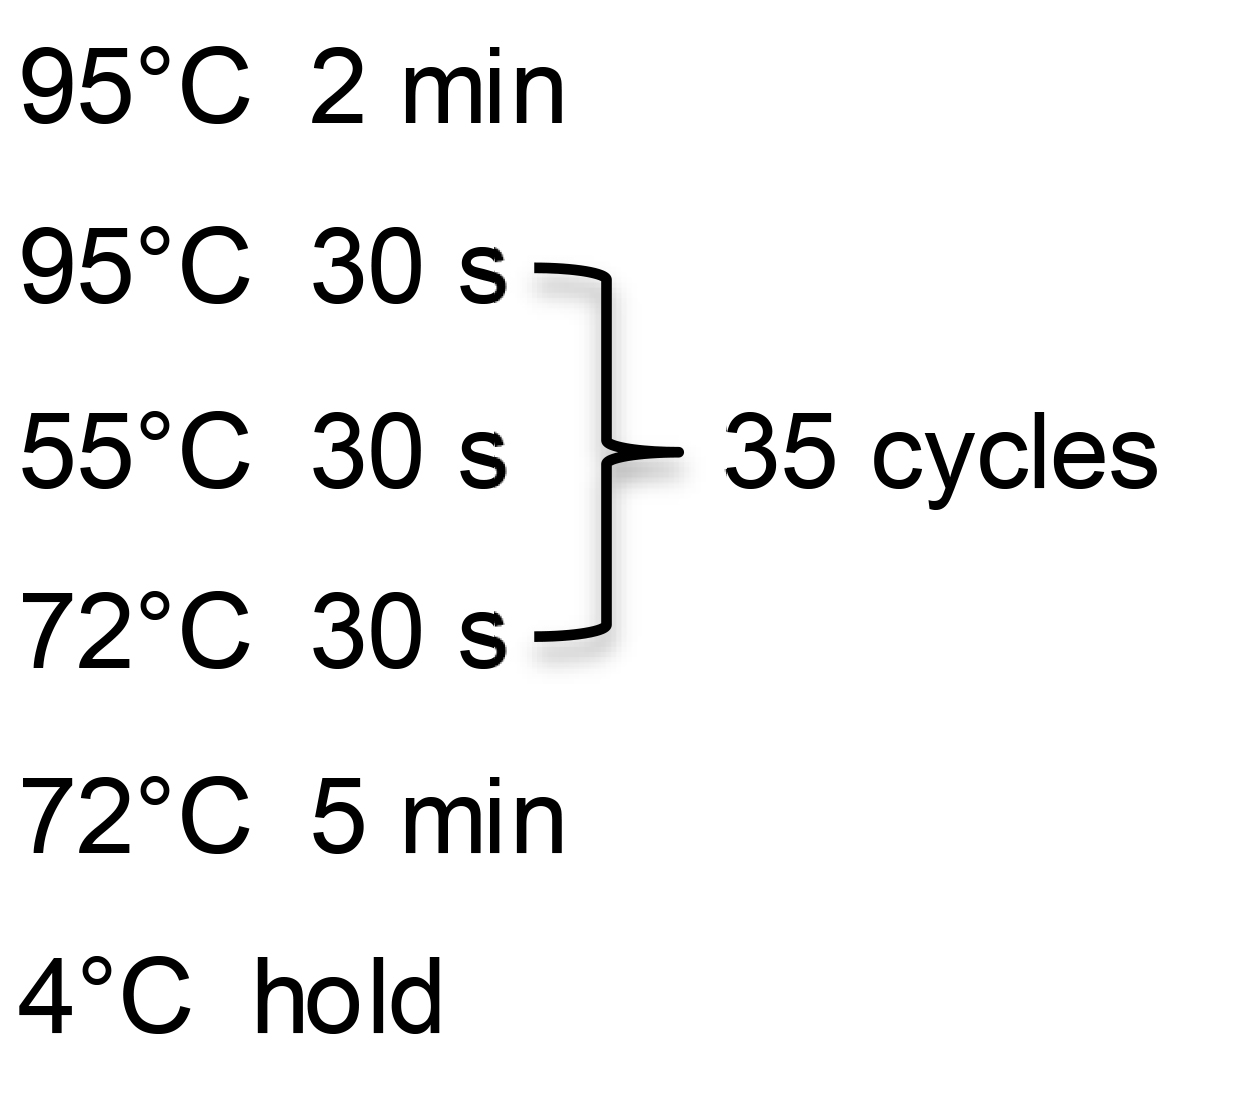
Run the following PCR program to amplify the targeted locus.
95°C 2 min
95°C 30 s
55°C 30 s 35 cycles
72°C 30 s
72°C 5 min
4°C hold
Run up to 7 μl of PCR product on a 2.5 to 3% agarose gel in 1× TAE, for 1 h at 80-100V. Image gel in the iBright FL1500 Imaging System or another gel-documentation imaging system.
An example of sgRNA injection and validation targeted exon 1 of the hand2 gene is shown in Figure 6A. The control uninjected embryo PCR amplicon runs as a single, tight band on the gel (Figure 6B, U). The amplicons from eight injected embryos show multiple bands or are diffuse in appearance relative to the control (Figure 6B, 1-8). This indicates heteroduplex formation in the PCR product caused by the presence of indel mutations at the CRISPR target site in the gene of interest.
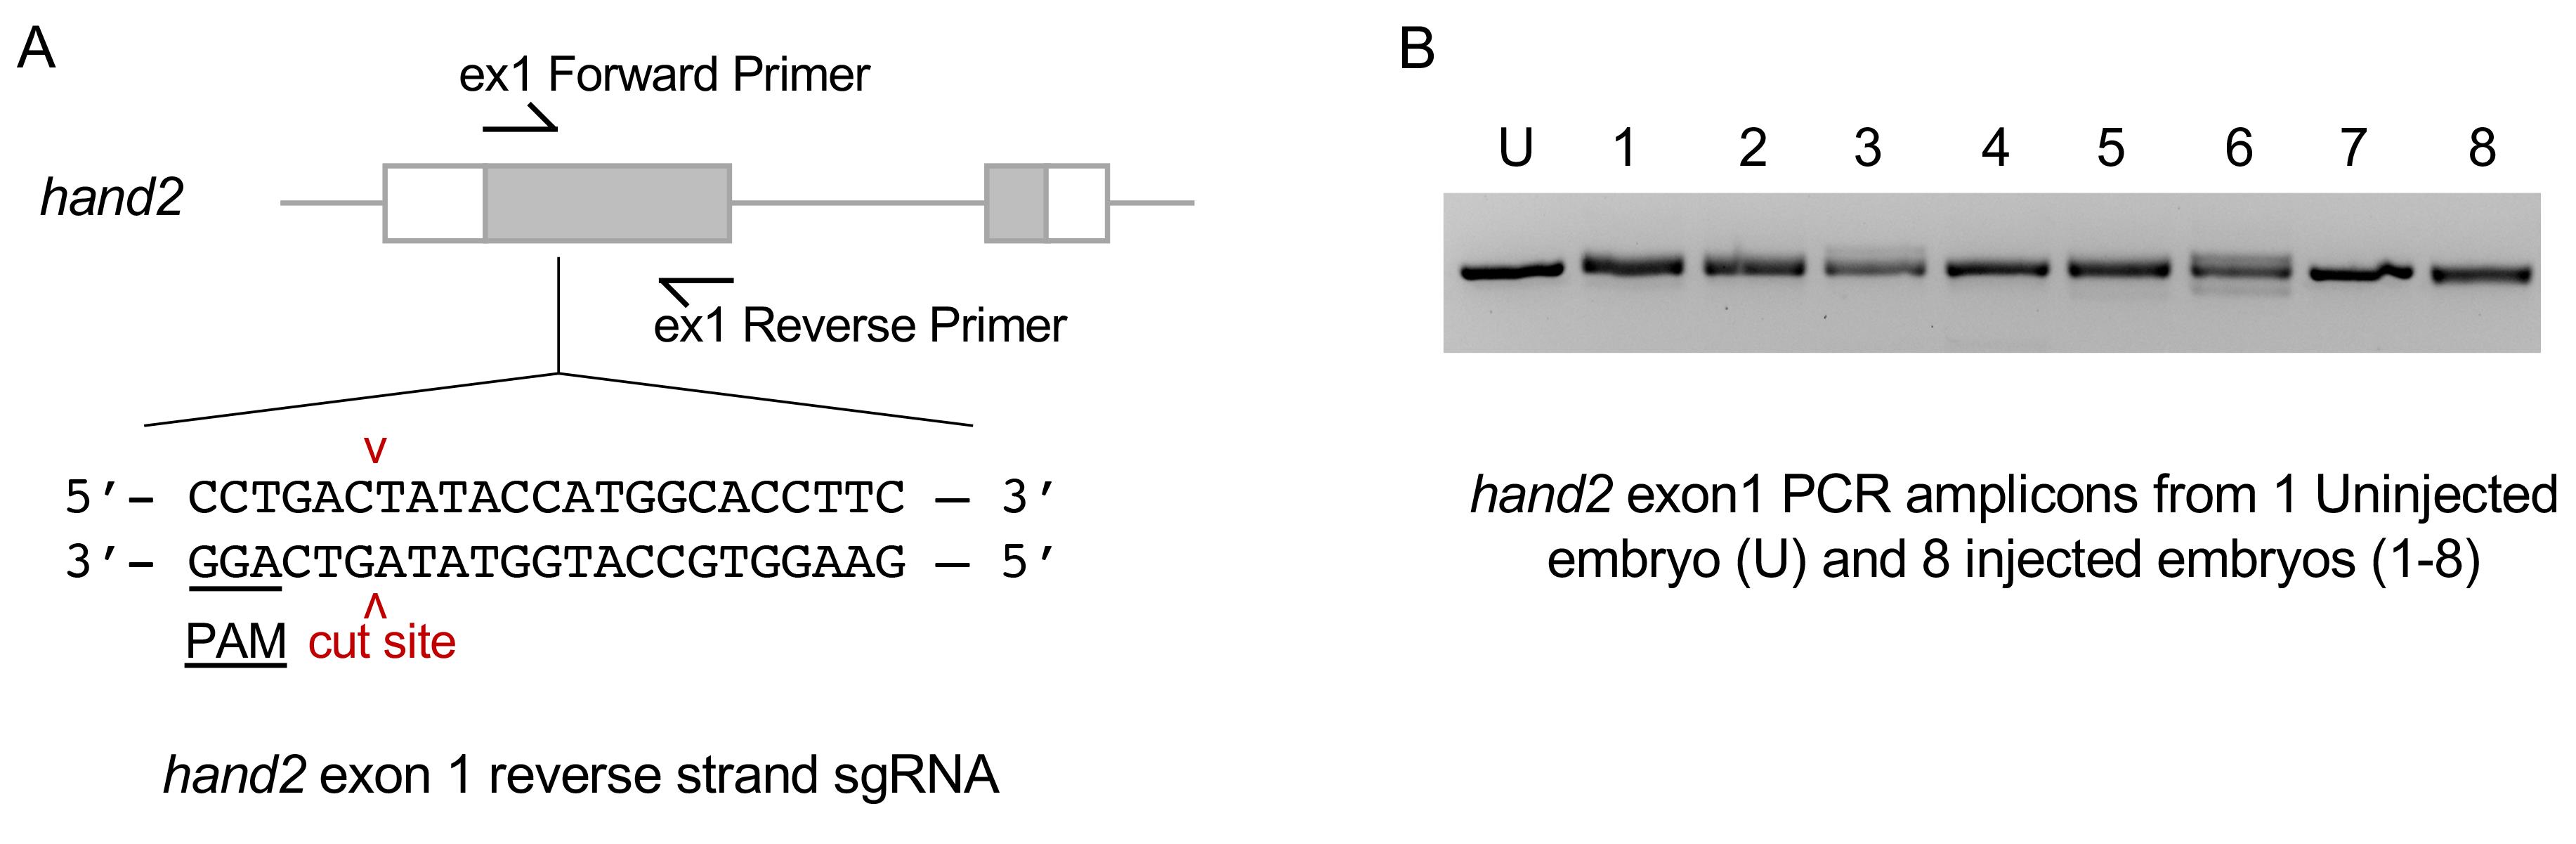
Figure 6. hand2 exon 1 sgRNA validation. A. Sequence of the hand2 reverse strand sgRNA site located in exon 1. B. PCR amplicons with primers flanking the sgRNA target site. Diffuse bands in injected embryos represent heteroduplex DNA caused by indel mutations at the target site.For quantitative analysis of mutagenesis efficiency, Sanger sequence PCR products to verify the presence of indels. The percentage of indel formation can be analyzed using Synthego’s ICE Analysis. Alternatively, Illumina MiSeq multiplex next-generation sequencing can be used to test the efficiency of multiple gRNAs in parallel.
An example of ICE analysis of amplicons from the hand2 exon 1 targeted embryos #3 and #6 from Figure 6 is shown below in Figure 7. Embryo #3 and #6 show 84% and 80% indel alleles after targeting, respectively, indicating high mutagenesis efficiency of the sgRNA.
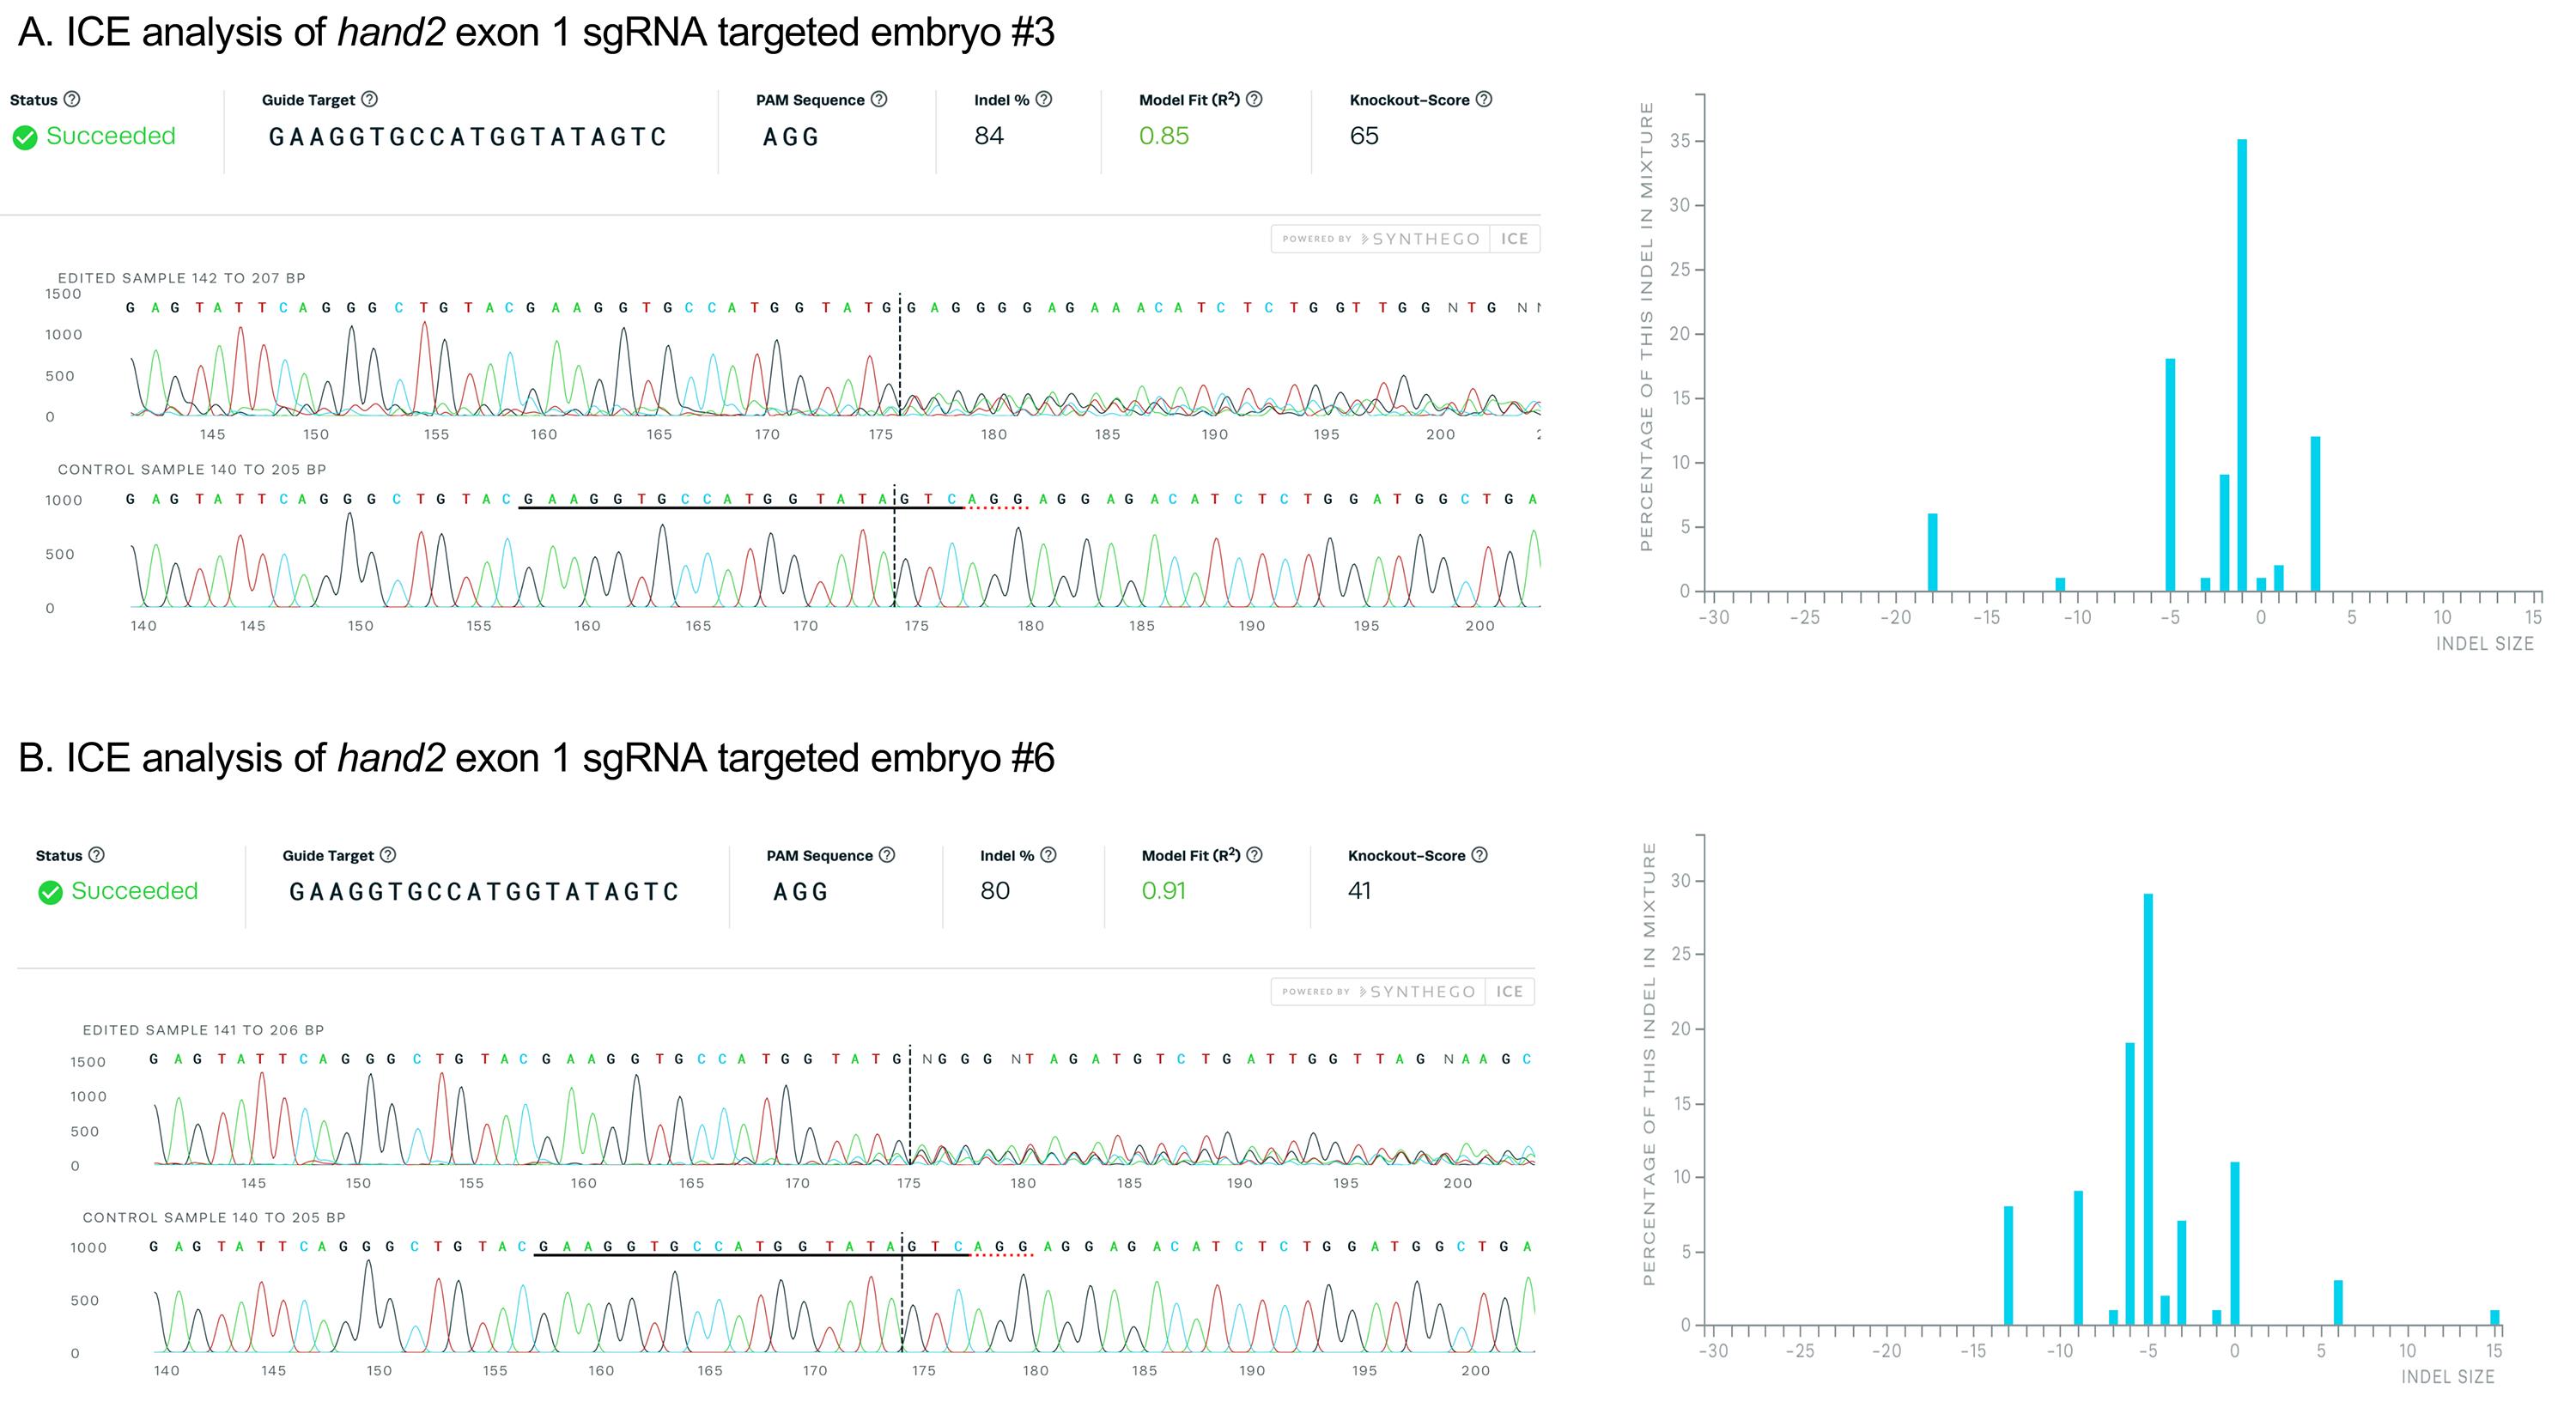
Figure 7. Validation of sgRNA mutagenesis efficiency by ICE analysis. PCR amplicons from hand2 exon 1 targeted embryos #3 (A) and #6 (B) were Sanger sequenced and the results analyzed with Synthego ICE Analysis, revealing 84% and 80% of sequences contained indel mutations. Plots on the right show the range of indel mutations recovered.
Design short homology arms for pGTag targeting vector assembly
Homology-directed gene targeting allows the seamless integration of exogenous DNA into the genome with precise repair events at the target site. However, designing and cloning individual targeting vectors and homology arms for each gene of interest can be time consuming. The pGTag vector series and web design tools provide versatility and ease to generate knock-out alleles (Figure 8). The vectors contain BfuAI and BspQI type II restriction enzymes for cloning of short homology arms (24 or 48 bp) using Golden Gate cloning. The pGTag vectors require in-frame integration for proper reporter gene function. The reporter gene consists of several parts. A 2A peptide sequence causes translational skipping, allowing the following protein to dissociate from the locus peptide. The eGFP, TagRFP, or Gal4VP16 reporter coding sequences have several options for localization signals, including cytosolic (no signal), a nuclear localization signal (NLS), or a membrane localization CAAX sequence. Finally, translation is terminated by one of two different transcription termination polyadenylation (pA) sequences, the 3’UTR region of the zebrafish β-actin gene or the SV40 viral transcription termination sequence.
For many genes, the level of endogenous gene expression is not high enough to produce a detectable fluorescence signal from the integrated reporter gene. The Gal4VP16 pGTag vector in combination with the transgenic Tol2<14XUAS/RFP> reporter line (Balciuniene et al., 2013) allows for amplification of the signal. The Tol2<14XUAS/RFP> reporter line is available upon request from the lab of Dr. Darius Balciunas, Temple University.
Plasmid sequence maps can be downloaded at www.genesculpt.org/gtaghd/.
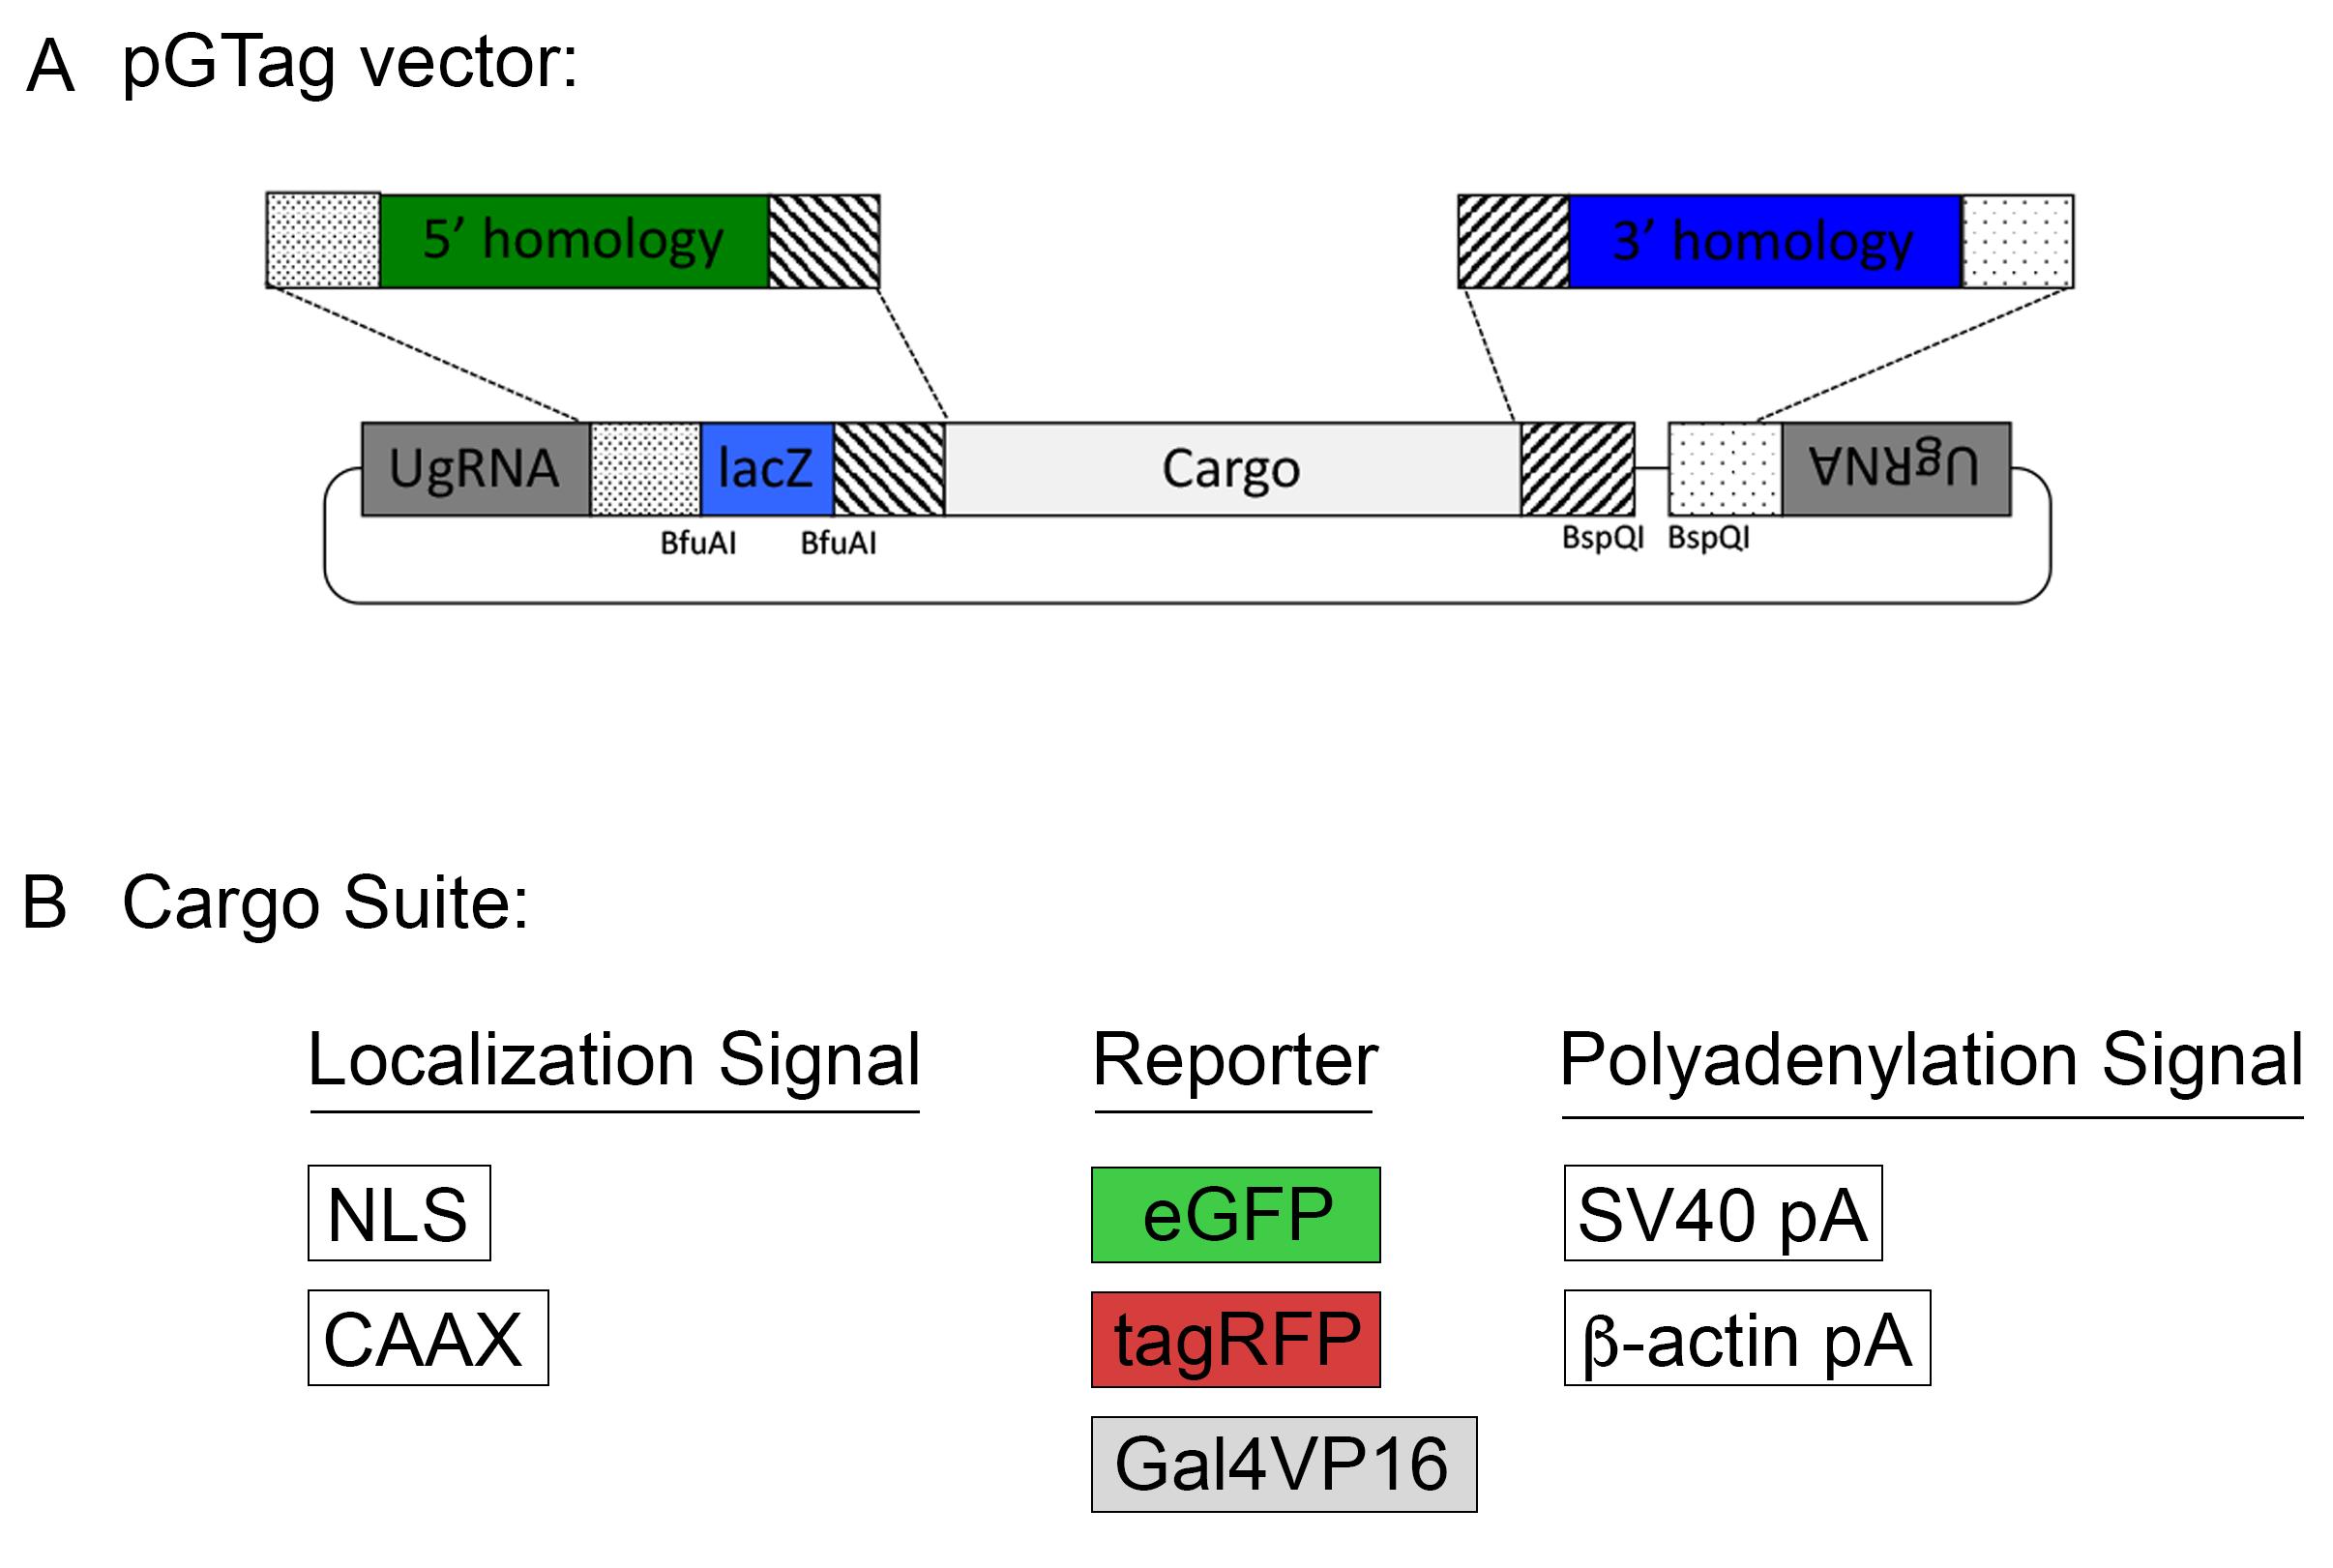
Figure 8. The pGTag vectors allow one step cloning of homology arms.All vectors (Figure 8) can be obtained through Addgene (www.addgene.org). Because the pGTag plasmids contain repeated sequences, vector recombination can occur in bacteria. We recommend using NEB Stable Competent E. coli (New England Biolabs, C3040I). Bacteria should be grown at 30°C to further reduce vector recombination.
Homology Arm Design at GTagHD
The web tool GTagHD allows for quick design of oligos to generate short 24 or 48 bp homology arms complementary to the target site in a gene of interest.
Two complementary oligos with overhangs are annealed to generate the double stranded homology arm for cloning into the pGTag vector.
To use the tool, choose the "Submit Single Job" tab. Follow the instructions in the tab.
The sequences of two pairs of complementary oligos will be returned, one pair for the 5’ homology arm and the other for the 3’ homology arm. If there are problems with the sequences and values that were entered, the web page will display the errors and advice on how to fix them. Double-check your output as below.
Manual Homology Arm Design
The following protocol describes how to design homology arm oligos manually:
Note: In the following section, orientation of target sites and homology is in the context of the reading frame of the genetic locus of interest. Example: A forward strand CRISPR gRNA means that the gRNA and PAM are encoded on the sense strand of the gene. Upstream homology domains are 5’ to the CRISPR/Cas9 cut site, and downstream homology domains are 3’ to the cut site with respect to the reading frame of the gene being targeted.
Also note: Upper case and lower case bases are not specially modified; this is simply a visual marker of the different parts of the homology arms.
Upstream Homology Arm Design
Open the sequence file for the gene of interest and identify the CRISPR site (in this example, it is a Reverse CRISPR target in Yellow, the PAM is in Orange, and the coding sequence is in purple). Copy the 48 bp 5’ of the CRISPR cut (the highlighted section below) into a new sequence file; this is the upstream homology (Figure 9).
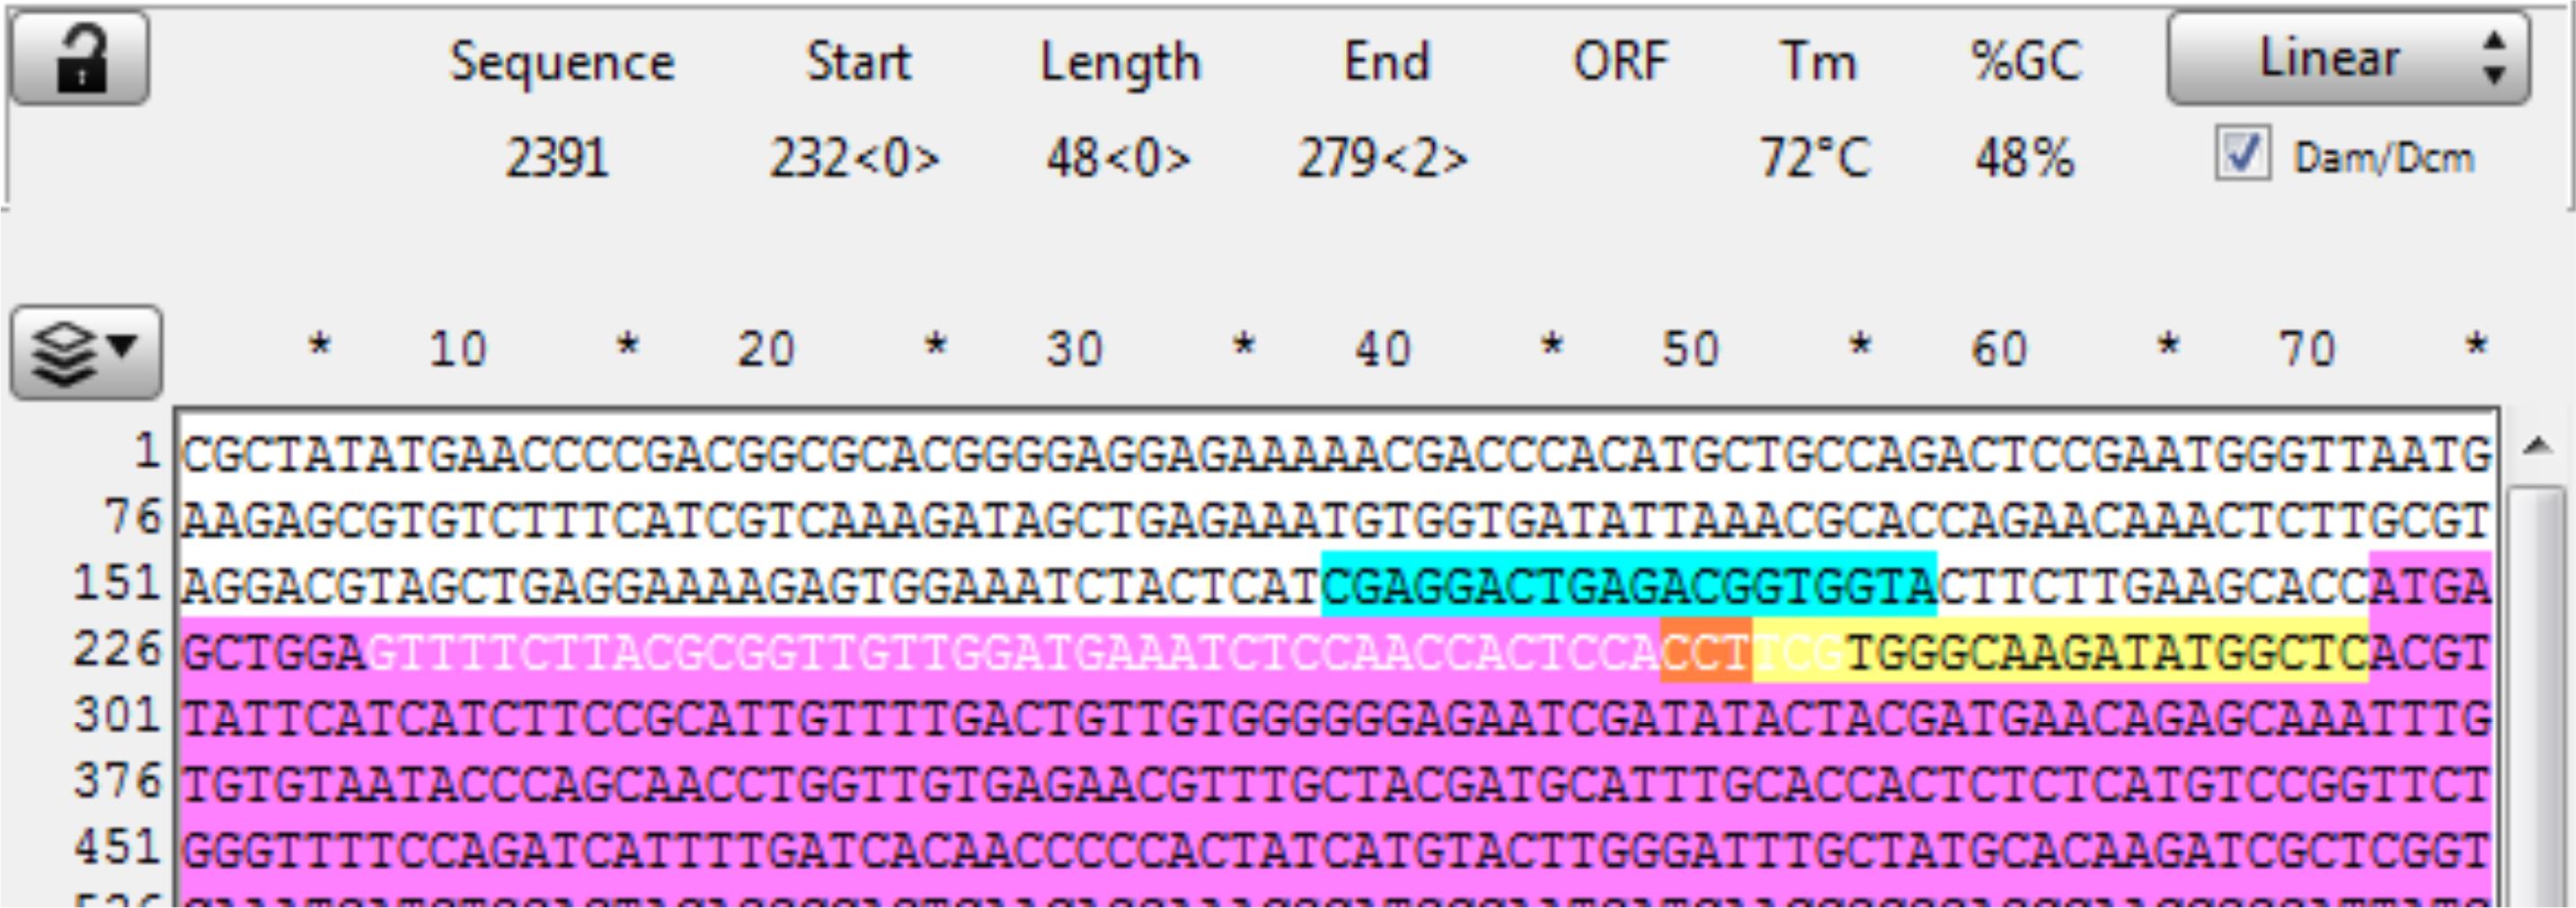
Figure 9. Screenshot of a targeted gene displayed in ApE, highlighting the target sequence (yellow), PAM (orange), coding sequence (purple), and the gene sequence of the upstream homology arm (highlighted white).Observe the next three bases immediately upstream of the 48 bp of homology, and pick a base not present to be the 3 bp spacer between the homology and the Universal PAM in the vector. Here, the three bases are “GGA,” so “ccc” was chosen for the spacer. Add the spacer to the new file 5’ (in front) of the homology (see below). The spacer acts as a non-homologous buffer between the homology and the eventual 6 bp flap from the universal guide sequence that will occur when the cassette is liberated and may improve intended integration rates over MMEJ events (Figure 10).
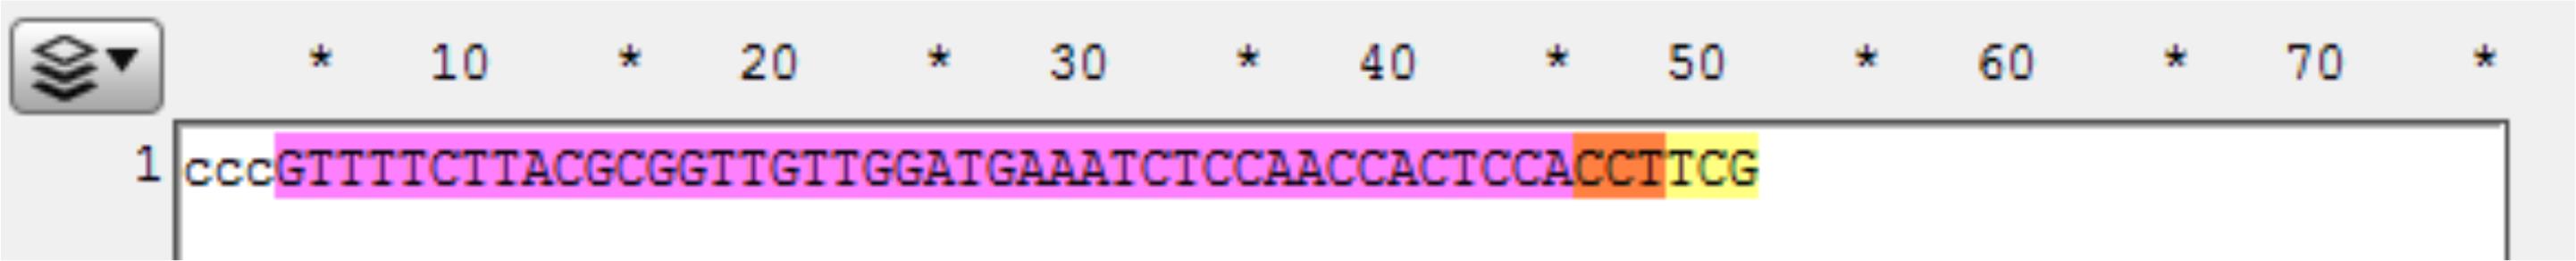
Figure 10. Screenshot of the gene sequence of the upstream homology arm (purple), the PAM (orange), and the remaining target sequence to the cut site (yellow). ccc was added as a spacer with a non-homologous sequence.Determine where the last codon is in the homology. Here, the 3’ G in the homology domain is the first base in the codon cut by this CRISPR target. Complete the codon by adding the remaining bases (called padding on GTagHD) for that codon from your sequence to ensure your integration event will be in frame (Figure 11).

Figure 11. Screenshot of the gene sequence of the upstream homology arm (purple), the PAM (orange), and the remaining target sequence to the cut site with the padding nucleotides (tg) to keep the integration in frame (yellow).Add the BfuAI enzyme overhang sequences for cloning to the ends of the homology domain. Here, both overhangs, 5’-GCGG and 3’-GGAT, are added to prevent errors in copying sequence for the oligos in the next two steps (Figure 12).

Figure 12. Screenshot of the gene sequence of the upstream homology arm (purple), the PAM (orange), and the remaining target sequence to the cut site with the padding nucleotides (tg) to keep the integration in frame (yellow) and the BfuAI sites added to each end.The Upstream Homology Oligo A will be this sequence from the beginning to the end of the last codon (see highlighted below). Copy and paste this sequence into a new file and save it. In this example, this oligo sequence is 5’-GCGGcccGTTTTCTTACGCGGTTGTTGGATGAAATCTCCAACCACTCCACCTTCGtg-3’ (Figure 13).

Figure 13. Screenshot of the gene sequence of the upstream homology arm (purple), the PAM (orange), and the remaining target sequence to the cut site with the padding nucleotides (tg) to keep the integration in frame (yellow) and the BfuAI sites added to each end. The sequence of Oligo A is in white.The Upstream Homology Oligo B will be the reverse complement of this sequence from the beginning of the spacer to the end of the sequence (see highlighted below in Figure 14). Copy the reverse complement, paste it into a new file, and save it. In this example, this oligo sequence is 5’-ATCCcaCGAAGGTGGAGTGGTTGGAGATTTCATCCAACAACCGCGTAAGAAAACggg-3’.

Figure 14. Screenshot of the gene sequence of the upstream homology arm (purple), the PAM (orange), and the remaining target sequence to the cut site with the padding nucleotides (tg) to keep the integration in frame (yellow) and the BfuAI sites added to each end. The sequence of Oligo B is highlighted. Use the reverse complement of the highlighted sequence.
Downstream Homology Arm Design
Open sequence file for the gene of interest and identify the CRISPR site. The reverse CRISPR target is in Yellow, the PAM in Orange, and coding sequence in purple. Copy the 48 bp 3’ of the CRISPR cut into a new sequence file; this is the downstream homology (Figure 15).
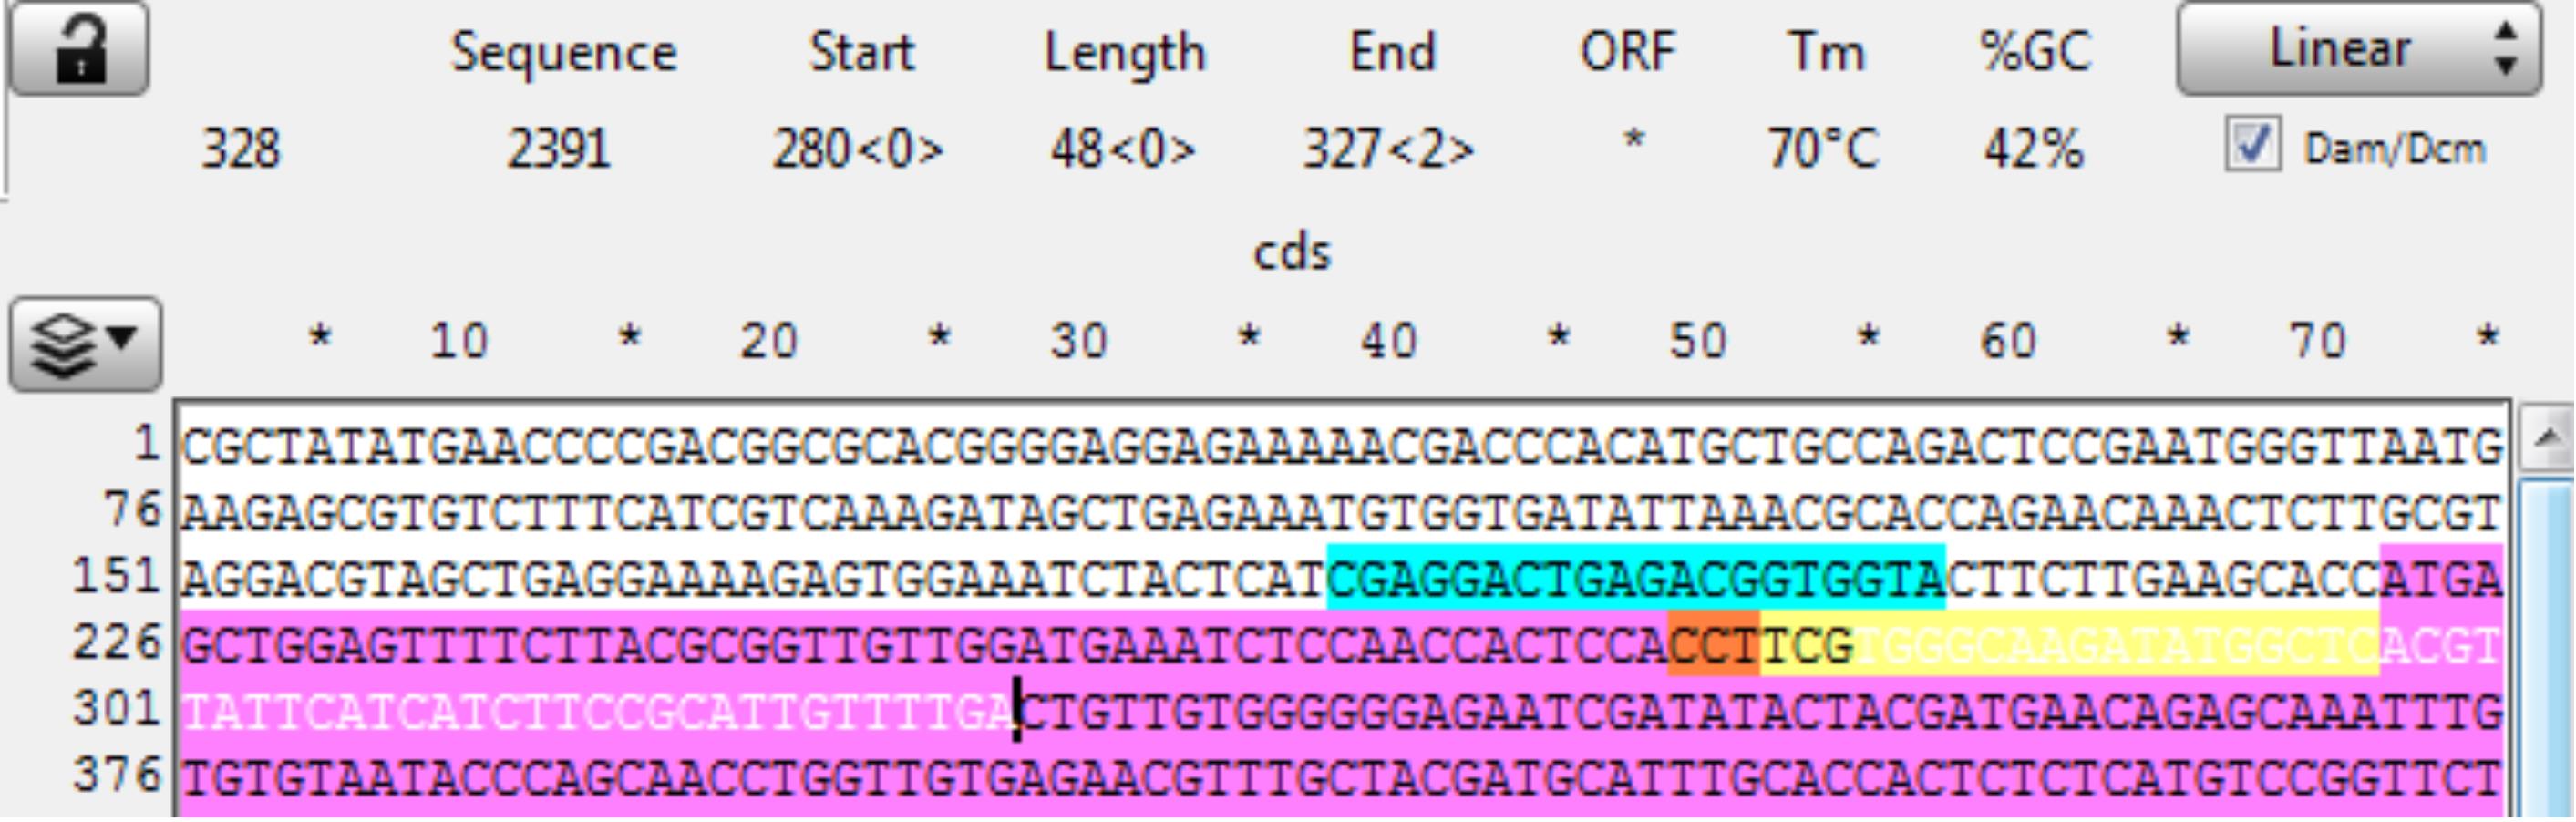
Figure 15. Screenshot of a targeted gene, highlighting the target sequence (yellow), PAM (orange), coding sequence (purple), and the gene sequence of the downstream homology arm (in white).Observe the next three bases downstream of the 48 bp of homology and pick a base not present to be the 3 bp spacer between the homology and the Universal PAM in the vector. Here, the bases are “CTG;” therefore, “aaa” was chosen for the spacer. Add the spacer to the new file 3’ of (after) the homology (Figure 16).

Figure 16. Screenshot of the gene sequence in the downstream homology arm from the targeted gene. This comprises part of the target sequence (yellow) and additional 3’ coding sequence (purple). aaa was added as padding nucleotides.Add the BspQI enzyme overhang sequences for cloning to the ends of the homology domain. Here, both overhangs, 5’-AAG and 3’-CCG, are added to prevent errors in copying sequence for the oligos in the next two steps (Figure 17).

Figure 17. Screenshot of the gene sequence in the downstream homology arm from the targeted gene with part of the target sequence (yellow) and additional 3’ coding sequence (purple). BspQI enzyme overhang sequences are added to each end.The Downstream Homology Oligo A will be this sequence from the beginning of the sequence to the end of the spacer (see highlighted below). In this example, this oligo sequence is 5’-AAGTGGGCAAGATATGGCTCACGTTATTCATCATCTTCCGCATTGTTTTGAaaa-3’ (Figure 18).

Figure 18. Screenshot of the gene sequence in the downstream homology arm from the targeted gene with part of the target sequence (yellow) and additional 3’ coding sequence (purple). The sequence for Oligo A is in white.The Downstream Homology Oligo B (will be the reverse complement of this sequence from the beginning of the homology to the end of the sequence (see highlighted below). In this example this oligo sequence is 5’-CGGtttTCAAAACAATGCGGAAGATGATGAATAACGTGAGCCATATCTTGCCCA-3’ (Figure 19).

Figure 19. Screenshot of the gene sequence in the downstream homology arm from the targeted gene with part of the target sequence (yellow) and additional 3’ coding sequence (purple). The sequence for Oligo B is highlighted in white. The reverse complement should be ordered.An example of correct homology arm design, showing complementary overhangs for cloning into the pGTag and pPRISM BfuAI and BspQ1 sites for a hand2 gRNA site (Figure 20).
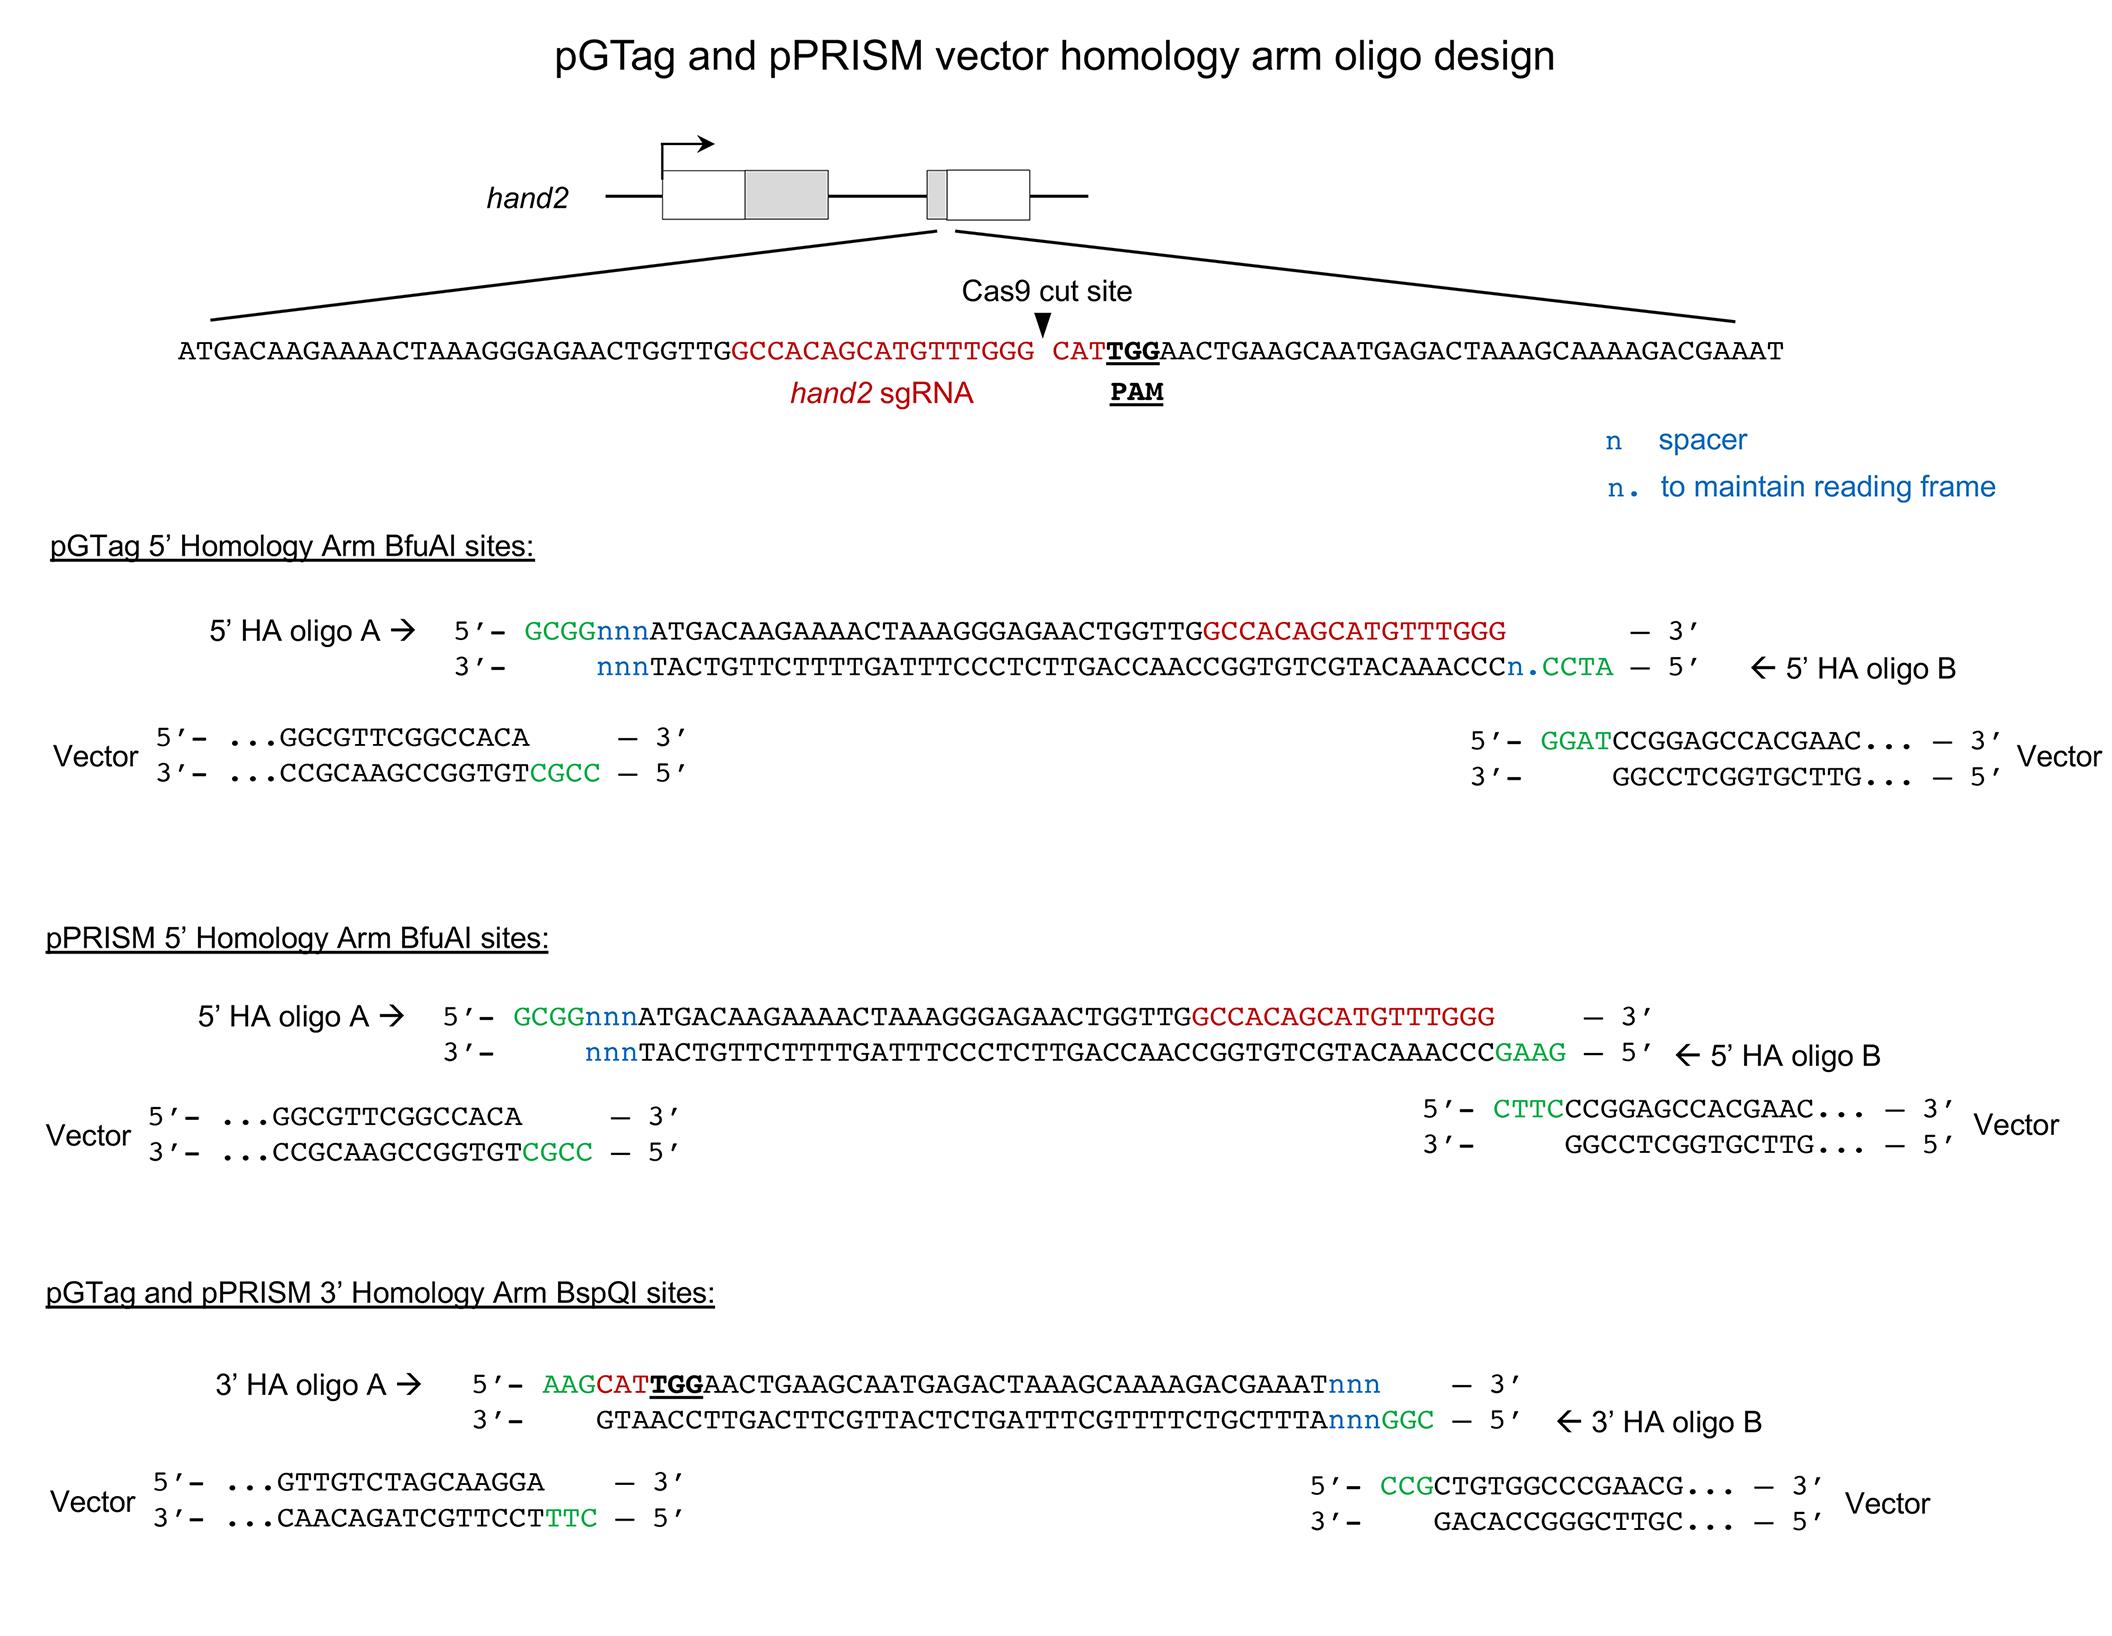
Figure 20. Example of pGTag and pPRISM vector homology arm design showing complementary 5’ overhangs for cloning into the BfuAI and BspQI type II restriction enzyme sites. Diagram of CRISPR/Cas9 target site in the hand2 gene. gRNA sequence in red and PAM sequence underlined and in bold. Annealed homology arm oligos A and B are shown with overhangs (green) complementary to the vector overhangs after enzyme digestion. n, spacer nucleotides; n., nucleotides included to maintain the reading frame of pGTag integration alleles.
One Pot Cloning of Homology Arms into pGTag Vectors
Notes:
If the homology arm oligos contain the 5’-ACCTGC-3’ or 5’-GAAGAGC-3’ sequences (or their complements), the cloning reaction will be less efficient.
If One Plot cloning is unsuccessful, the 5’ and 3’ homology arms can be cloned sequentially into the vector using gel-purified linear plasmids digested with the appropriate enzyme.
Homology Arm Annealing
Anneal upstream and downstream homology oligo pairs separately:
4.5 μl oligo A at 10 μM
4.5 μl olio B at 10 μM
4 μl 10× Buffer 3.1 from NEB
27 μl dH2O
For a 40 μl total
To anneal the oligos, run the following program in a thermal cycler: Step 1, incubate at 98°C for 5 minutes; Step 2, incubate at 97°C for 45 seconds; repeat Step 2 for 90 cycles during which the temperature is decreased by 1°C/cycle; hold at 4°C for the final step. Alternatively, boil water in a glass beaker on a hot plate and incubate the tube in the boiling water for 5 minutes. Remove the beaker from the heat source and allow it to cool to room temperature. Store the annealed homology arms on ice or in a -20°C freezer.
1-Pot Digest
Mix the following solutions:
4.0 μl dH2O
2 μl Plasmid at 50 ng/μl
1 μl 10× Buffer 3.1 from NEB
1 μl 5' annealed homology arm
1 μl 3' annealed homology arm
0.5 μl BfuAI enzyme from NEB
0.5 μl BspQI enzyme from NEB
For a10 μl total
Incubate at 50°C for 1 h, place on ice.
Ligation
Add the following:
3 μl 5× T4 quick ligase buffer
1.5 μl dH2O
0.5 μl T4 quick ligase
For a 15 μl total
Incubate 8-10 min at room temperature (to overnight). Store at -20°C.
Transformation: To prevent recombination at repetitive elements in the plasmid, grow transformations and overnight cultures at 30°C. Our standard protocol uses NEB Stable Competent E. coli (C3040H) cells for cloning and propagation of the GeneWeld pGTag and pPRISM plasmid series to limit recombination.
On ice, thaw 1 (one) vial competent cells (50 μl) for every 2 ligation reactions (approx. 5 min).
While cells are thawing, label the microcentrifuge tubes for each ligation and put on ice.
Once the cells have thawed, use a pipette to transfer 25 μl of the competent cells into each labeled tube.
Add 1.5 μl of a ligation reaction into competent cells to transform.
The amount of ligation reaction added should be less than 5% of the volume of competent cells.
Mix by tapping the tube several times or gently mixing with the pipet tip.
Note: Do NOT mix by pipetting; this will lyse the cells.
Incubate on ice for 5 to 20 min.
Heat-shock the cells by submerging the portion of the tube containing the cells in a 42°C water bath for 40-50 s.
Incubate cells on ice for 2 min.
Add 125 μl of room temperature LB or SOC to each transformation.
Incubate cells at 30°C for 1-1.5 h in a shaking incubator.
While the transformed cells are recovering, spread 40 μl of X-Gal solution and 40 μl IPTG 0.8 M on LB Kanamycin selection plates.
X-Gal is lethal to cells while wet; it is recommended to first label the plates and then place them in a 30°C incubator to dry.
After recovery and the X-Gal is dry, plate 150 μl of each transformation on the corresponding correctly labeled plate.
Incubate plates overnight at 30°C.
Growing colonies
Pick three white colonies from each plate and grow in separate glass culture tubes with 3 ml LB/Kanamycin, overnight at 30°C, or to pre-screen colonies by colony PCR:
Pick up to 8 colonies with a pipet tip and resuspend them in separate aliquots of 5 μl dH2O. Place the tip in 3 ml of LB/Kan, label, and store at 4°C.
Make a master mix for your PCR reactions containing the following amounts times the number of colonies you picked.
7.5 μl 2× GoTaq mastermix
5.5 μl dH2O
0.5 μl primer at 10 μM “F3'-check” 5'-GGCGTTGTCTAGCAAGGAAG-3'
0.5 μl primer at 10 μM “3’_pgtag_seq”5'-ATGGCTCATAACACCCCTTG-3'
For a 14 μl total
Aliquot 14 μl of mixed master mix into separate labeled PCR tubes.
Add 1 μl of colony to each reaction as template, or 20 ng purified plasmid as control.
Cycle in a thermocycler
95°C 2 min
95°C 30 s
57°C 30 s 35 cycles
72°C 30 s
72°C 5 min
4°C hold
Run 5 μl of PCR product on a 1% agarose gel. Image gel on iBright FL1500 Imaging System or another gel-documentation imaging system. There should be bands that are a different size than the control.
Mini Prep Cultures
Follow Qiagen Protocol
Sequencing of Plasmids
The 5’ homology arm can be sequenced by the 5'_pgtag_seq primer:
5'-GCATGGATGTTTTCCCAGTC-3’.
The 3’ homology arm can be sequenced with the “3’_pgtag_seq”primer:
5'-ATGGCTCATAACACCCCTTG-3'.
Injection of GeneWeld Reagents (spCas9 mRNA, Universal sgRNA (UgRNA), genomic sgRNA, and pGTag homology vector) into 1-cell zebrafish embryos
Prepare and collect the following reagents for injection:
Prepare nCas9n mRNA from pT3TS-nCas9n (Addgene #46757) (Jao et al., 2013) (See Section B 5. Preparation of SpCas9 mRNA).
The UgRNA and genomic sgRNA can be directly ordered from IDT or Synthego and resuspended in Molecular Grade RNase/DNase-free water.
The pGTag homology vectors should be purified a second time prior to microinjection under RNase free conditions with the Promega PureYield Plasmid Miniprep System beginning at the endotoxin removal wash. Plasmid DNA is eluted in Molecular Grade RNase/DNase-Free water.
Embryo Injections for Integration of pGTag vectors.
Injections are performed into single cell embryos at a volume of 2 nl per embryo containing the following concentration of RNAs and vector:
In injection solution In embryo
75 pg/nl of nCas9n mRNA 150 pg of nCas9n mRNA
12.5 pg/nl of genomic sgRNA 25 pg of genomic sgRNA
12.5 pg/nl of UgRNA 25 pg of UgRNA
5 pg/nl of pGTag DNA 10 pg of pGTag DNA
Test injected embryos for evidence of precision on-target integration
Examine injected embryos for fluorescence under a Zeiss Discovery dissecting microscope with a 1× objective at 70-100× magnification. If weak signals are observed, manually dechorionate the embryos, and view on a glass depression well slide on a standard upright compound microscope with epi-illumination. High resolution confocal live imaging can also be carried out, as shown in Wierson et al. (2020) Figure 3 (https://elifesciences.org/articles/53968/figures#fig3).
The type of light source used for fluorescent protein activation significantly affects the ability to visualize fluorescence signals. The X-Cite 120W metal halide light source with fiber optic cable (Excilitas Technologies) works well to visualize fluorescence after somatic targeting. The TagRFP protein also is shifted in its excitation, and filters optimized for this protein are recommended. Filters optimized for GFP and BFP are also recommended. If no or weak signal is observed, integration of pGTag-Gal4VP16 can be used to amplify reporter expression in the 14XUAS-RFP transgenic line (Balciuniene et al., 2013).
Perform junction fragment PCR analysis on positive embryos that display widespread fluorescence in expression domains consistent with the targeted gene. Isolate genomic DNA from individual embryos and a control embryo (See Section D 2. Digestion of embryos for isolation of genomic DNA for mutagenesis analysis). PCR amplifies the genomic DNA-integrated cassette 5’ and 3’ junctions fragments. An example of F0 embryo junction analysis is shown in Figure 3s1 in Wierson et al., 2020 (https://elifesciences.org/articles/53968/figures#fig3s1).
The following primers are used for junction fragment analysis and must be paired with gene-specific primers (5’ to 3’):
5’ pGTag junctions:
R-Gal4-5'juncM GCCTTGATTCCACTTCTGTCA and a gene-specific forward primer
R-RFP-5'junc CcttaatcagttcctcgcccttagA
R-eGFP-5'-junc gctgaacttgtggccgttt
3’ pGTag junctions:
F-Gal4-3'juncM GCAAACGGCCTTAACTTTCC and a gene specific reverse primer
F-Gal4-3'junc CTACGGCGCTCTGGATATGT
F-RFP-3'junc cgacctccctagcaaactgggg
F-eGFP-3'junc Acatggtcctgctggagttc
To control for PCR amplification artifacts as described in (Won and Dawid, 2017), perform PCR junction analysis on embryos injected with all targeting reagents minus the genomic sgRNA.
The alternate primers F-Gal4-3'juncM and F-Gal4-3'juncJ may increase primer specificity, depending on the target gene.
7.5 μl 2× GoTaq mastermix
5.5 μl dH2O
0.5 μl primer at 10 μM genomic primer
0.5 μl primer at 10 μM pGTag primer
For a 14 μl total
Aliquot 14 μl of mixed master mix into separate labeled PCR tubes.
Add 1 μl of genomic DNA to each reaction as template.
Cycle in a thermocycler with the following steps:
Run 5 μl of PCR product on a 1.2% agarose gel in 1× TAE. Image gel on the iBright FL1500 Imaging System or another gel-documentation imaging system. Putative junction fragments should give bands that are of the predicted size.
Establish a new transgenic line of a precision targeted integration allele
Raise to adulthood fluorescence reporter-expressing F0 siblings of injected embryos that showed positive bands on the 5’ and 3’ junction analysis, indicating precision targeted integration. Outcross F0 adults to wild type and examine the progeny for reporter gene fluorescence as described above to identify F1 embryos that have inherited a stable germline integration allele. For Gal4Vp16 integration alleles, cross the F0 adults to the 14XUAS:RFP reporter line. Silencing of the 14XUAS:RFP reporter may result in mosaic expression patterns in Gal4Vp16 targeted F1 embryos.
Test F1 fluorescence positive embryos for precise transgene integration by junction fragment PCR analysis as described above. Raise F1 siblings to adulthood and fin-clip to identify individuals with precise targeted transgene integration as shown in Figure 4s 2-4 of Wierson et al. (2020) (https://elifesciences.org/articles/53968/figures#fig4s2).
Outcross a single positive F1 adult to establish F2 families. F1s can also be sacrificed 3 weeks post-fertilization to the confirm location and precision of targeted integrations by genomic Southern Blot RFLP analysis as inFigure 4s1 of Wierson et al. (2020) (https://elifesciences.org/articles/53968/figures#fig4s1). Continue to maintain lines by outcrossing to wild type in subsequent generations. Tables 1 and 2 of Wierson et al. (2020) (https://elifesciences.org/articles/53968/figures) show the range of germline transmission frequencies of precision targeted integration alleles at eight zebrafish loci.
To perform an initial assessment of whether the targeted integration allele causes a loss of function phenotype, F0 and F1 identified fish can be incrossed or crossed to a known indel allele of the targeted gene.
Data analysis
Links to numerical data in the original article (Wierson et al., 2020) are included in the protocol.
Recipes
Zebrafish embryo E2 Medium (Westerfield, 1995) (https://wahoo.cns.umass.edu/book/export/html/867)
Acknowledgments
This work was supported by the NIH grant R24OD020166 (JJE, MM, DD, KJC, and SCE). Research reported in this publication was made possible in part by the services of the Kansas University Genome Sequencing Core Laboratory supported by the National Institute of General Medical Sciences (NIGMS) of the NIH under award number P20GM103638. The GeneWeld protocol is associated with Wierson et al., 2020.
Competing interests
JJE, MM, and KJC have a financial conflict of interest with Recombinetics, Inc.; JJE and SCE with Immusoft, Inc.; JJE, MM, WAW, KJC, and SCE with LifEngine and LifEngine Animal Technologies.
Ethics
All zebrafish experiments described in this protocol were carried out under approved protocols from Iowa State University Animal Care and Use Committee Log#11-06-6252, in compliance with American Veterinary Medical Association and NIH guidelines for the humane use of animals in research.
References
- Aida, T., Nakade, S., Sakuma, T., Izu, Y., Oishi, A., Mochida, K., Ishikubo, H., Usami, T., Aizawa, H., Yamamoto, T. and Tanaka, K. (2016). Gene cassette knock-in in mammalian cells and zygotes by enhanced MMEJ. BMC Genomics 17(1): 979.
- Almeida, M. P., Welker, J. M., Siddiqui, S., Luiken, J., Ekker, S. C., Clark, K. J., Essner, J. J. and McGrail, M. (2021). Endogenous zebrafish proneural Cre drivers generated by CRISPR/Cas9 short homology directed targeted integration. Sci Rep 11(1): 1732.
- Balciuniene, J., Nagelberg, D., Walsh, K. T., Camerota, D., Georlette, D., Biemar, F., Bellipanni, G. and Balciunas, D. (2013). Efficient disruption of Zebrafish genes using a Gal4-containing gene trap. BMC Genomics 14: 619.
- Bedell, V. M., Wang, Y., Campbell, J. M., Poshusta, T. L., Starker, C. G., Krug, R. G., 2nd, Tan, W., Penheiter, S. G., Ma, A. C., Leung, A. Y., Fahrenkrug, S. C., Carlson, D. F., Voytas, D. F., Clark, K. J., Essner, J. J. and Ekker, S. C. (2012). In vivo genome editing using a high-efficiency TALEN system. Nature 491(7422): 114-118.
- Beumer, K. J., Trautman, J. K., Bozas, A., Liu, J. L., Rutter, J., Gall, J. G. and Carroll, D. (2008). Efficient gene targeting in Drosophila by direct embryo injection with zinc-finger nucleases. Proc Natl Acad Sci U S A 105(50): 19821-19826.
- Carlson, D. F., Tan, W., Lillico, S. G., Stverakova, D., Proudfoot, C., Christian, M., Voytas, D. F., Long, C. R., Whitelaw, C. B. and Fahrenkrug, S. C. (2012). Efficient TALEN-mediated gene knockout in livestock. Proc Natl Acad Sci U S A 109(43): 17382-17387.
- Ceccaldi, R., Rondinelli, B. and D'Andrea, A. D. (2016). Repair Pathway Choices and Consequences at the Double-Strand Break. Trends Cell Biol 26(1): 52-64.
- Geurts, A. M., Cost, G. J., Freyvert, Y., Zeitler, B., Miller, J. C., Choi, V. M., Jenkins, S. S., Wood, A., Cui, X., Meng, X., Vincent, A., Lam, S., Michalkiewicz, M., Schilling, R., Foeckler, J., Kalloway, S., Weiler, H., Menoret, S., Anegon, I., Davis, G. D., Zhang, L., Rebar, E. J., Gregory, P. D., Urnov, F. D., Jacob, H. J. and Buelow, R. (2009). Knockout rats via embryo microinjection of zinc-finger nucleases. Science 325(5939): 433.
- Grzesiuk, E. and Carroll, D. (1987). Recombination of DNAs in Xenopus oocytes based on short homologous overlaps. Nucleic Acids Res 15(3): 971-985.
- Hasty, P., Rivera-Perez, J., Chang, C. and Bradley, A. (1991). Target frequency and integration pattern for insertion and replacement vectors in embryonic stem cells. Mol Cell Biol 11(9): 4509-4517.
- Hisano, Y., Sakuma, T., Nakade, S., Ohga, R., Ota, S., Okamoto, H., Yamamoto, T. and Kawahara, A. (2015). Precise in-frame integration of exogenous DNA mediated by CRISPR/Cas9 system in zebrafish. Sci Rep 5: 8841.
- Hoshijima, K., Jurynec, M. J. and Grunwald, D. J. (2016). Precise Editing of the Zebrafish Genome Made Simple and Efficient. Dev Cell 36(6): 654-667.
- Jao, L. E., Wente, S. R. and Chen, W. (2013). Efficient multiplex biallelic zebrafish genome editing using a CRISPR nuclease system. Proc Natl Acad Sci U S A 110(34): 13904-13909.
- Jasin, M. and Berg, P. (1988). Homologous integration in mammalian cells without target gene selection. Genes Dev 2(11): 1353-1363.
- Kanca, O., Zirin, J., Garcia-Marques, J., Knight, S. M., Yang-Zhou, D., Amador, G., Chung, H., Zuo, Z., Ma, L., He, Y., Lin, W. W., Fang, Y., Ge, M., Yamamoto, S., Schulze, K. L., Hu, Y., Spradling, A. C., Mohr, S. E., Perrimon, N. and Bellen, H. J. (2019). An efficient CRISPR-based strategy to insert small and large fragments of DNA using short homology arms. Elife 8: e51539.
- Luo, J. J., Bian, W. P., Liu, Y., Huang, H. Y., Yin, Q., Yang, X. J. and Pei, D. S. (2018). CRISPR/Cas9-based genome engineering of zebrafish using a seamless integration strategy. FASEB J 32(9): 5132-5142.
- Mann, C.M., Martinez-Galvez, G., Welker, J.M., Wierson, W.A., Ata, H., Almeida, M.P., Clark, K.J., Essner, J.J., McGrail, M., Ekker, S.C., et al. (2019). The Gene Sculpt Suite: a set of tools for genome editing. Nucleic Acids Res 47: W175-W182.
- Moreno-Mateos, M. A., Vejnar, C. E., Beaudoin, J. D., Fernandez, J. P., Mis, E. K., Khokha, M. K. and Giraldez, A. J. (2015). CRISPRscan: designing highly efficient sgRNAs for CRISPR-Cas9 targeting in vivo. Nat Methods 12(10): 982-988.
- Nakade, S., Tsubota, T., Sakane, Y., Kume, S., Sakamoto, N., Obara, M., Daimon, T., Sezutsu, H., Yamamoto, T., Sakuma, T. and Suzuki, K. T. (2014). Microhomology-mediated end-joining-dependent integration of donor DNA in cells and animals using TALENs and CRISPR/Cas9. Nat Commun 5: 5560.
- Orr-Weaver, T. L., Szostak, J. W. and Rothstein, R. J. (1981). Yeast transformation: a model system for the study of recombination. Proc Natl Acad Sci U S A 78(10): 6354-6358.
- Rong, Y. S. and Golic, K. G. (2000). Gene targeting by homologous recombination in Drosophila. Science 288(5473): 2013-2018.
- Rosen, J. N., Sweeney, M. F. and Mably, J. D. (2009). Microinjection of zebrafish embryos to analyze gene function. J Vis Exp(25). doi:10.3791/1115.
- Shin, J., Chen, J. and Solnica-Krezel, L. (2014). Efficient homologous recombination-mediated genome engineering in zebrafish using TALE nucleases. Development 141(19): 3807-3818.
- Solin, S. L., Shive, H. R., Woolard, K. D., Essner, J. J. and McGrail, M. (2015). Rapid tumor induction in zebrafish by TALEN-mediated somatic inactivation of the retinoblastoma1 tumor suppressor rb1. Sci Rep 5: 13745.
- Westerfield, M. (1995). The zebrafish book: a guide for the laboratory use of zebrafish (Danio rerio), 3rd edn (University of Oregon Press).
- Wierson, W. A., Welker, J. M., Almeida, M. P., Mann, C. M., Webster, D. A., Torrie, M. E., Weiss, T. J., Kambakam, S., Vollbrecht, M. K., Lan, M., McKeighan, K. C., Levey, J., Ming, Z., Wehmeier, A., Mikelson, C. S., Haltom, J. A., Kwan, K. M., Chien, C. B., Balciunas, D., Ekker, S. C., Clark, K. J., Webber, B. R., Moriarity, B. S., Solin, S. L., Carlson, D. F., Dobbs, D. L., McGrail, M. and Essner, J. (2020). Efficient targeted integration directed by short homology in zebrafish and mammalian cells. Elife 9: e53968.
- Won, M. and Dawid, I. B. (2017). PCR artifact in testing for homologous recombination in genomic editing in zebrafish. PLoS One 12(3): e0172802.
- Yang, H., Wang, H., Shivalila, C. S., Cheng, A. W., Shi, L. and Jaenisch, R. (2013). One-step generation of mice carrying reporter and conditional alleles by CRISPR/Cas-mediated genome engineering. Cell 154(6): 1370-1379.
- Zhang, J. P., Li, X. L., Li, G. H., Chen, W., Arakaki, C., Botimer, G. D., Baylink, D., Zhang, L., Wen, W., Fu, Y. W., Xu, J., Chun, N., Yuan, W., Cheng, T. and Zhang, X. B. (2017). Efficient precise knockin with a double cut HDR donor after CRISPR/Cas9-mediated double-stranded DNA cleavage. Genome Biol 18(1): 35.
- Zu, Y., Tong, X., Wang, Z., Liu, D., Pan, R., Li, Z., Hu, Y., Luo, Z., Huang, P., Wu, Q., Zhu, Z., Zhang, B. and Lin, S. (2013). TALEN-mediated precise genome modification by homologous recombination in zebrafish. Nat Methods 10(4): 329-331.
文章信息
版权信息
![]() Welker et al. This article is distributed under the terms of the Creative Commons Attribution License (CC BY 4.0).
Welker et al. This article is distributed under the terms of the Creative Commons Attribution License (CC BY 4.0).
如何引用
Readers should cite both the Bio-protocol article and the original research article where this protocol was used:
- Welker, J. M., Wierson, W. A., Almeida, M. P., Mann, C. M., Torrie, M. E., Ming, Z., Ekker, S. C., Clark, K. J., Dobbs, D. L., Essner, J. J. and McGrail, M. (2021). GeneWeld: Efficient Targeted Integration Directed by Short Homology in Zebrafish. Bio-protocol 11(14): e4100. DOI: 10.21769/BioProtoc.4100.
- Wierson, W. A., Welker, J. M., Almeida, M. P., Mann, C. M., Webster, D. A., Torrie, M. E., Weiss, T. J., Kambakam, S., Vollbrecht, M. K., Lan, M., McKeighan, K. C., Levey, J., Ming, Z., Wehmeier, A., Mikelson, C. S., Haltom, J. A., Kwan, K. M., Chien, C. B., Balciunas, D., Ekker, S. C., Clark, K. J., Webber, B. R., Moriarity, B. S., Solin, S. L., Carlson, D. F., Dobbs, D. L., McGrail, M. and Essner, J. (2020). Efficient targeted integration directed by short homology in zebrafish and mammalian cells. Elife 9: e53968.
分类
发育生物学 > 基因组编辑 > 靶向整合
分子生物学 > DNA > 诱/突变
您对这篇实验方法有问题吗?
在此处发布您的问题,我们将邀请本文作者来回答。同时,我们会将您的问题发布到Bio-protocol Exchange,以便寻求社区成员的帮助。