

Preparation of Human Chondrocytes for Profiling Using Cytometry by Time-of-flight (cyTOF)
用飞行时间(cyTOF flight)流式细胞术制备人软骨细胞用于分析研究
发布: 2021年07月20日第11卷第14期 DOI: 10.21769/BioProtoc.4086 浏览次数: 4085
评审: Ralph Thomas BoettcherToshitsugu FujitaAnonymous reviewer(s)
参见作者原研究论文
The authors used this protocol in:

Mar 2020
Advertisement


Abstract
Single-cell technologies have allowed high-resolution profiling of tissues and thus a deeper understanding of tissue homeostasis and disease heterogeneity. Understanding this heterogeneity can be especially important for tailoring treatments in a patient-specific manner. Here, we detail methods for preparing human cartilage tissue for profiling via cytometry by time-of-flight (cyTOF). We have previously utilized this method to characterize several rare cell populations in cartilage, including cartilage-progenitor cells, inflammation-amplifying cells (Inf-A), and inflammation-dampening cells (Inf-D). Previous bio-protocols have focused on cyTOF staining of PBMCs. Therefore, here we detail the steps unique to the processing of human cartilage and chondrocytes. Briefly, cartilage tissue is digested to release individual chondrocytes, which can be expanded and manipulated in culture. These cells are then collected and fixed in preparation for cyTOF, followed by standard staining and analysis protocols.
Keywords: Chondrocytes (软骨细胞)Background
Fluorescence flow cytometry has historically been used in the skeletal field to isolate particularly rare cell types. In the case of human cartilage biology, such experiments allowed for the isolation of cartilage-progenitor cells (CPCs) and other types of chondrocytes using a limited set of markers. However, the overlap between different fluorophores fundamentally limits the number of target proteins that can be interrogated in a single experiment. Cytometry by time-of-flight (cyTOF) expands this tool kit by conjugating antibodies to heavy metal ions that can then be detected by mass spectrometry, thereby greatly expanding the number of protein targets that can be measured in a single experiment (Bendall et al., 2011). The use of cyTOF complements other available single-cell techniques, such as RNA profiling or chromatin-accessibility profiling, by providing a targeted snapshot of the translated proteome of a cell. This can be particularly advantageous in disease scenarios, such as when studying chondrocytes derived from osteoarthritic (OA) cartilage. CyTOF allows researchers to profile rare populations and simultaneously capture information from 40+ markers, including cell surface receptors and cell signaling markers.
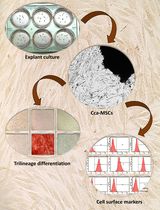
Several protocols have detailed the application of cyTOF to small cells, such as peripheral blood mononuclear cells (PBMCs) (Leipold and Maecker 2015; Lin et al., 2015). Here, we detail the specific application of cyTOF to human chondrocyte cells for use in musculoskeletal research, as we have described previously (Grandi et al., 2020). We first describe how to process patient-derived cartilage tissue to release individual chondrocytes, which can be expanded and manipulated in culture. We then describe how these cells should be collected and prepared for cyTOF, including fixation and cell staining steps. Data acquisition on the cyTOF instrument follows the manufacturer’s recommendations. An overall schematic of the workflow, including pause points, is detailed in Figure 1. This protocol can be applied to study any set of antibody-based protein markers of interest beyond those described in Grandi et al. (2020).
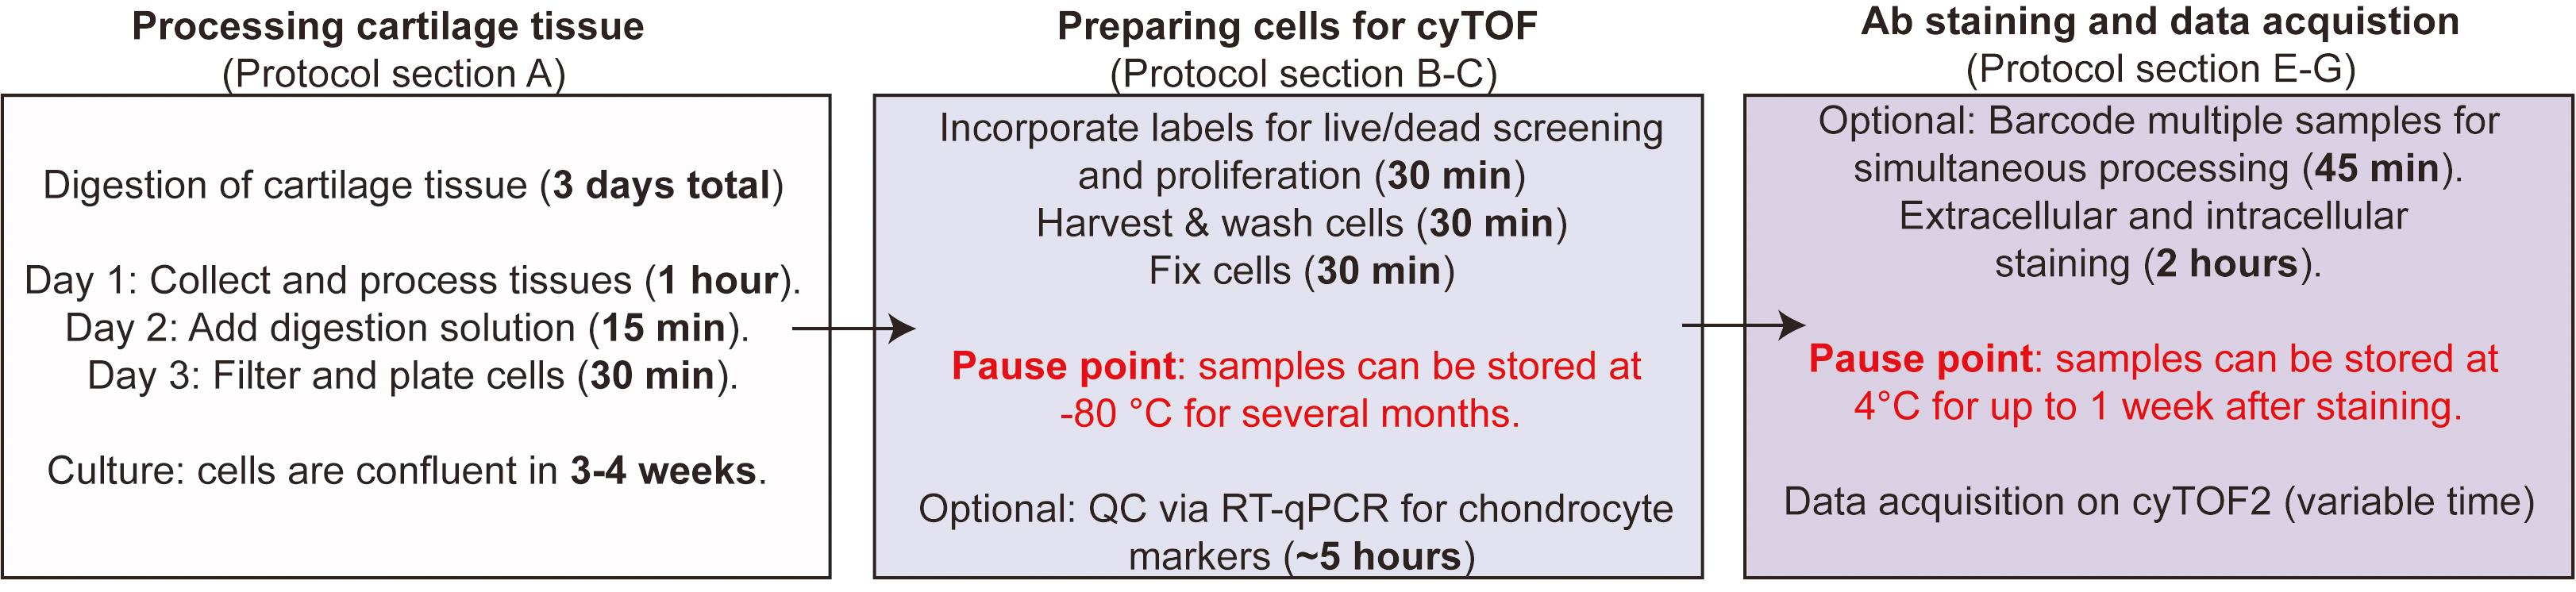
Figure 1. Protocol Overview Schematic. Section A of this protocol details how to process cartilage tissue to extract chondrocytes, which can then be cultured and manipulated. Digestion of cartilage takes 3 days, with minimal hands-on time. Time to confluency may vary, depending on the density at which cells are plated. Sections B-C detail how to prepare the cultured chondrocytes for cyTOF, including the Idu staining for cell cycle analysis and cisplatin staining for live/dead analysis. Chondrocytes are then harvested from the plate and fixed, after which the samples can be stored at -80°C for several months. Finally, sections E-G of this protocol briefly detail how to do the staining with cyTOF conjugated antibodies. After staining, samples can be stored at 4°C for up to one week.
Materials and Reagents
Standard tissue culture supplies (tissue culture treated plates, Phosphate Buffer Saline (PBS), serological pipets, etc.)
Bottle-top vacuum filter bottle, with pore size of 0.22 μm that can hold >50 ml or equivalent filter system (Corning, catalog number: CLS430624)
70 μm cell strainer (Falcon, catalog number: 352350 or equivalent)
5 ml FACS tubes with 35 μm strainer cap (Corning, catalog number: 352235) or equivalent
Collagenase II (Worthington Biochem, catalog number: CLS-2)
Collagenase IV (Worthington Biochem, catalog number: CLS-4)
Hyclone Dulbecco’s modified Eagle’s medium/F12 (GE Healthcare, catalog number: SH3002302)
L-glutamine (Gibco, catalog number: 25-030-149)
Fetal Bovine Serum (FBS) (Corning, catalog number: 35-016-CV)
Antibiotic-antimycotic solution (Gibco, catalog number: 15-240-062)
Ascorbic Acid (Sigma, catalog number: A92902) or equivalent
Trypan Blue Solution 0.4% (Gibco, catalog number: 15250061)
Phosphate Buffer Saline (PBS) (Hyclone, catalog number: SH30256)
Bovine serum albumin lyophilized powder (Sigma, catalog number: A2153)
Sodium azide (Sigma, catalog number: S2002)
(Optional) If doing sample quality-control via qPCR:
RNA extraction kit (Quick-RNA Microprep kit; Zymo, catalog number: R1050)
cDNA synthesis kit (Applied Biosystems, catalog number: 4368814)
qPCR supplies
TaqMan Gene Expression Assay (FAM) (ThermoFisher Scientific, catalog number: 4331192) or equivalent.
TaqMan probes for quality control genes (or Sybr equivalent). We use: Mmp3 (Hs00233962_m1), Mmp9 (Hs00957562_m1), and Mmp13 (Hs00233992_m1), and calculate the Col2a1/Col1a1 Ct ratio using Hs01060358_m1 and Hs00164004_m1 and normalize to actin as a housekeeping gene (Hs01060665_g1) purchased from Thermo Fisher.
Cell-IDTM Cisplatin-194Pt (Fluidigm, catalog number: 201194) or equivalent
Cell-IDTM IdU (Fluidigm, catalog number: 201127) or equivalent
Sodium Chloride (NaCl) (Sigma, catalog number: S988)
Potassium Chloride (KCl) (Sigma, catalog number: P9541)
Sodium Phosphate dibasic (Na2HPO4) (Sigma, catalog number: S7907)
Potassium Phosphate monobasic (KH2PO4) (Sigma, catalog number: P5655)
Sodium Hydroxide (NaOH) (Sigma, catalog number: S8045)
Sterile, double distilled water (Hyclone, catalog number: SH3053801)
0.25% Trypsin, 0.02% EDTA (Sigma, catalog number: 59428C) or equivalent
16% Paraformadehyde Aqueous Solution EM Grade (Electron Microscopy Sciences, catalog number: 15710)
(Optional) Cell-ID 20-plex Pd Barcoding Kit (Fluidigm, catalog number: 201060)
Methanol (Sigma, catalog number: 34860)
Cell-ID Intercalator-Ir (Fluidigm, catalog number: 201192A)
EQ Four Element Calibration Beads (Fluidigm, catalog number: 201078)
Maxpar Cell Staining Buffer (Fluidigm, catalog number: 201068) or homemade according to recipe, taking care not to use containers washed with soaps that have a high barium content, as this will give a lot of background.
Metal conjugated antibody panel
These will be specific to your experiment of interest. Some can be bought pre-conjugated by Fluidigm or can be labeled using the Maxpar X8 Multimetal Labeling Kit (Fluidigm, catalog number: 201300). Please see Grandi et al. (2020) for our full list of antibodies.
(Optional) For quality control of chondrocytes, include SOX9 and CD44 in your panel
SOX9 (Abcam, Clone 3C10)
CD44 (Biolegend, Clone IM7)
Complete Chondrocyte Media (see Recipes)
Collagenase Solution (see Recipes)
Cell Staining Media (CSM) (see Recipes)
Low-barium PBS (1× phosphate buffered saline) (see Recipes)
0.5 μM Cisplatin in low-barium PBS (see Recipes)
Cell Fixation Solution (see Recipes)
CSM with Cell-ID intercalator (see Recipes)
CSM with Cell-ID intercalator and 4% PFA (see Recipes)
Equipment
Cell Incubator (5% CO2, 37°C)
Biological Safety cabinet
Light microscope for cell monitoring
Cell counter or hematocytomer
Vortex Genie 2 (or equivalent)
CyTOFTM version 2 mass cytometer (Fluidigm) or equivalent
(Optional) Super Sampler (Victorian Airship and Scientific Apparatus)
Centrifuge with temperature control
Calibrated pipets
(Optional) Real-Time PCR Machine
Software
Cytobank (https://www.cytobank.org/) for data visualization and quality control
We also used this for the tSNE embedding and FlowSOM analysis, although this can be done with Python or R packages.
Custom scripts for visualizing the data were used as described before (Grandi et al., 2020).
Additionally, other R packages are available for cyTOF data analysis, including FlowSOM (Van Gassen et al., 2015) for cluster generation and Citrus (Bruggner et al., 2014) for determining differences between groups.
Procedure
文章信息
版权信息
© 2021 The Authors; exclusive licensee Bio-protocol LLC.
如何引用
Readers should cite both the Bio-protocol article and the original research article where this protocol was used:
- Grandi, F. C. and Bhutani, N. (2021). Preparation of Human Chondrocytes for Profiling Using Cytometry by Time-of-flight (cyTOF). Bio-protocol 11(14): e4086. DOI: 10.21769/BioProtoc.4086.
- Grandi, F. C., Baskar, R., Smeriglio, P., Murkherjee, S., Indelli, P. F., Amanatullah, D. F., Goodman, S., Chu, C., Bendall, S. and Bhutani, N. (2020). Single-cell mass cytometry reveals cross-talk between inflammation-dampening and inflammation-amplifying cells in osteoarthritic cartilage. Sci Adv 6(11): eaay5352.
分类
细胞生物学 > 细胞分离和培养 > 单层培养
细胞生物学 > 细胞染色 > 全细胞
您对这篇实验方法有问题吗?
在此处发布您的问题,我们将邀请本文作者来回答。同时,我们会将您的问题发布到Bio-protocol Exchange,以便寻求社区成员的帮助。