

A Method for Estimating the Potential Synaptic Connections Between Axons and Dendrites From 2D Neuronal Images
一种从二维神经元图像中估计轴突和树突之间潜在突触连接的方法
(*contributed equally to this work) 发布: 2021年07月05日第11卷第13期 DOI: 10.21769/BioProtoc.4073 浏览次数: 4323
评审: Ehsan KheradpezhouhMaria NguyenNarayan Subramanian
参见作者原研究论文
The authors used this protocol in:
Feb 2021
Advertisement


Abstract
Computational neuroscience aims to model, reproduce, and predict network dynamics for different neuronal ensembles by distilling knowledge derived from electrophysiological and morphological evidence. However, analyses and simulations often remain critically limited by the sparsity of direct experimental constraints on essential parameters, such as electron microscopy and electrophysiology pair/multiple recording evidence of connectivity statistics. Notably, available data are particularly scarce regarding quantitative information on synaptic connections among identified neuronal types. Here, we present a user-friendly data-driven pipeline to estimate connection probabilities, number of contacts per connected pair, and distances from the pre- and postsynaptic somas along the axonal and dendritic paths from commonly available two-dimensional tracings and other broadly accessible measurements. The described procedure does not require any computational background and is accessible to all neuroscientists. This protocol therefore fills the important gap from neuronal morphology to circuit organization and can be applied to many different neural systems, brain regions, animal species, and data sources.
Graphic abstract:
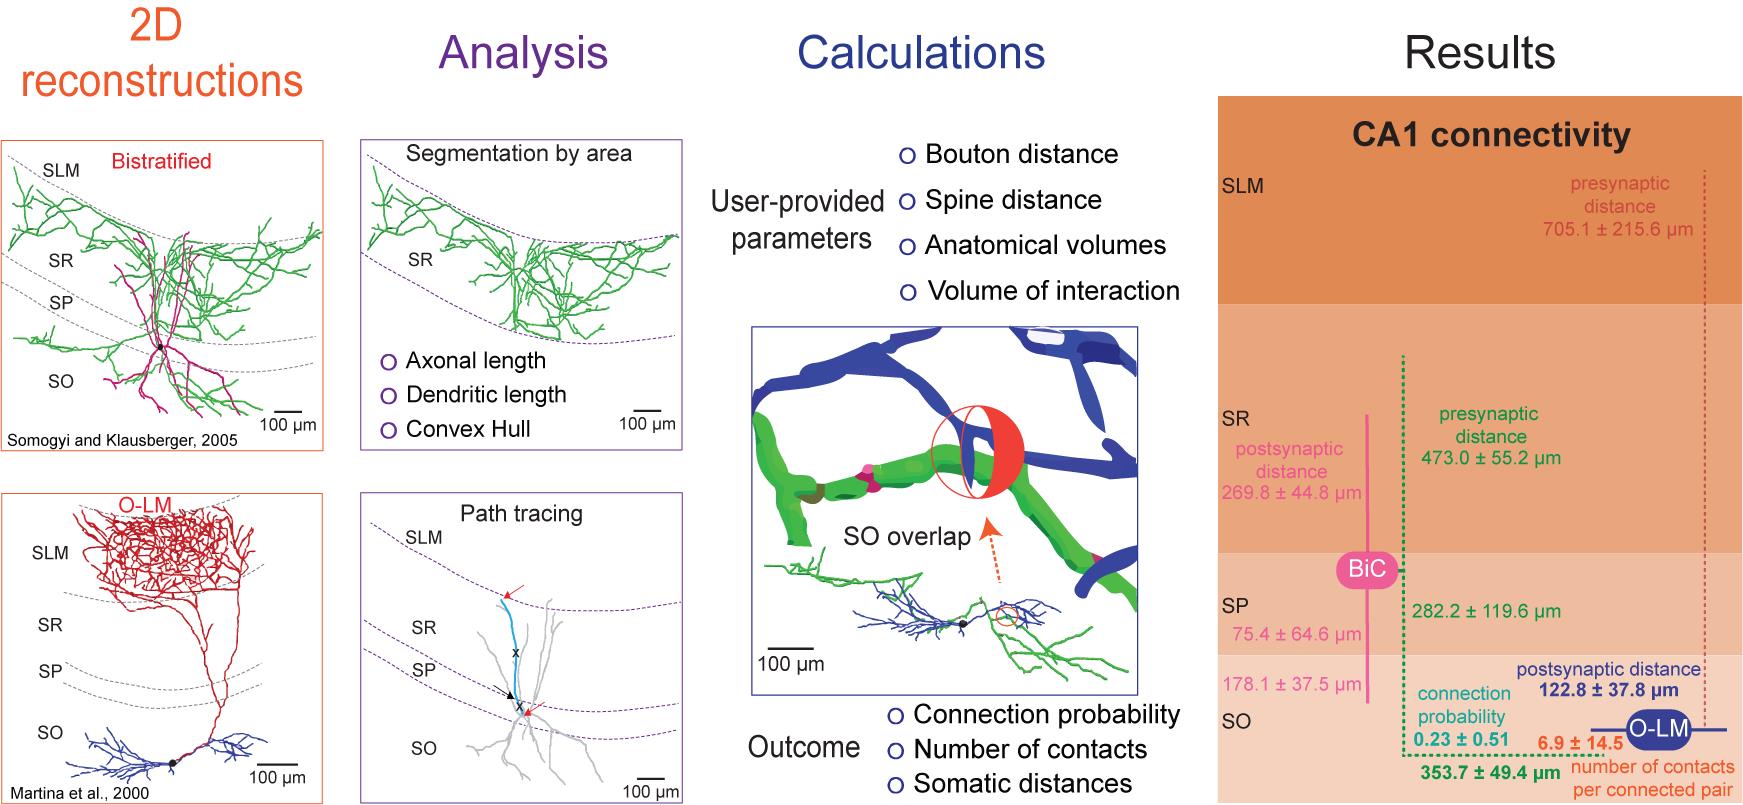
The processing protocol from 2D reconstructions to quantitated synaptic connections
Background
Synaptic connectivity is a key determinant of the interaction between neurons, and its quantitation is pivotal to understanding the organization of brain circuits and the relationship with network function (Ascoli and Atkeson, 2005). Current knowledge of synaptic probability relies on empirical evidence, which is limited by the number of simultaneously recorded neurons (e.g., by pair recording, octopatch, multielectrode array) and affected by experimental conditions (in vitro vs. in vivo, slice orientation and thickness, distance between cells, etc.). Connections in a particular brain region are often probed by evoked responses upon stimulation of the afferent fiber tracts; however, such tests do not allow the identification of the specific neuronal types involved (Moradi and Ascoli, 2020). Alternatively, synaptic connectivity can be calculated computationally by embedding three-dimensionally (3D) reconstructed neuronal morphologies into 3D brain atlases and counting the possible locations of axonal-dendritic overlap (Ropireddy and Ascoli, 2011). Nevertheless, this approach requires a large amount of labor-intensive data, is limited by the precision of the 3D registration, and has so far proven impractical to scale up.
Despite its importance, connectivity information remains incomplete for most animal species and neural systems (Rees et al., 2017). This protocol describes a simple process for the extraction of important quantitative synaptic parameters – namely the connection probability, number of contacts per connected pair, and distance from the pre- and postsynaptic somas along the neurite paths – from commonly available two-dimensional images of axonal and dendritic morphology. To the best of our knowledge, there are no alternative solutions available to obtain the same results. Initially, this approach was used to estimate hippocampal connectivity and demonstrated high correlation of the resulting estimates with sparsely available data (Tecuatl et al., 2021).
The overall workflow of the presented pipeline consists of seven main logical components: (i) quantitation of parcel-specific axonal and dendritic lengths; (ii) determination of parcel-specific axonal and dendritic path distances; (iii) measurement of parcel-specific axonal and dendritic convex hull volume; (iv) calculation of the average number of synapses per neuronal pair in each parcel; (v) calculation of the number of contacts per connected pair; (vi) calculation of the connection probability per neuronal pair; and (vii) calculation of the confidence intervals on these values by propagation of error analysis. All steps can be carried out on a basic desktop or laptop computer using readily available software (Figure 1).
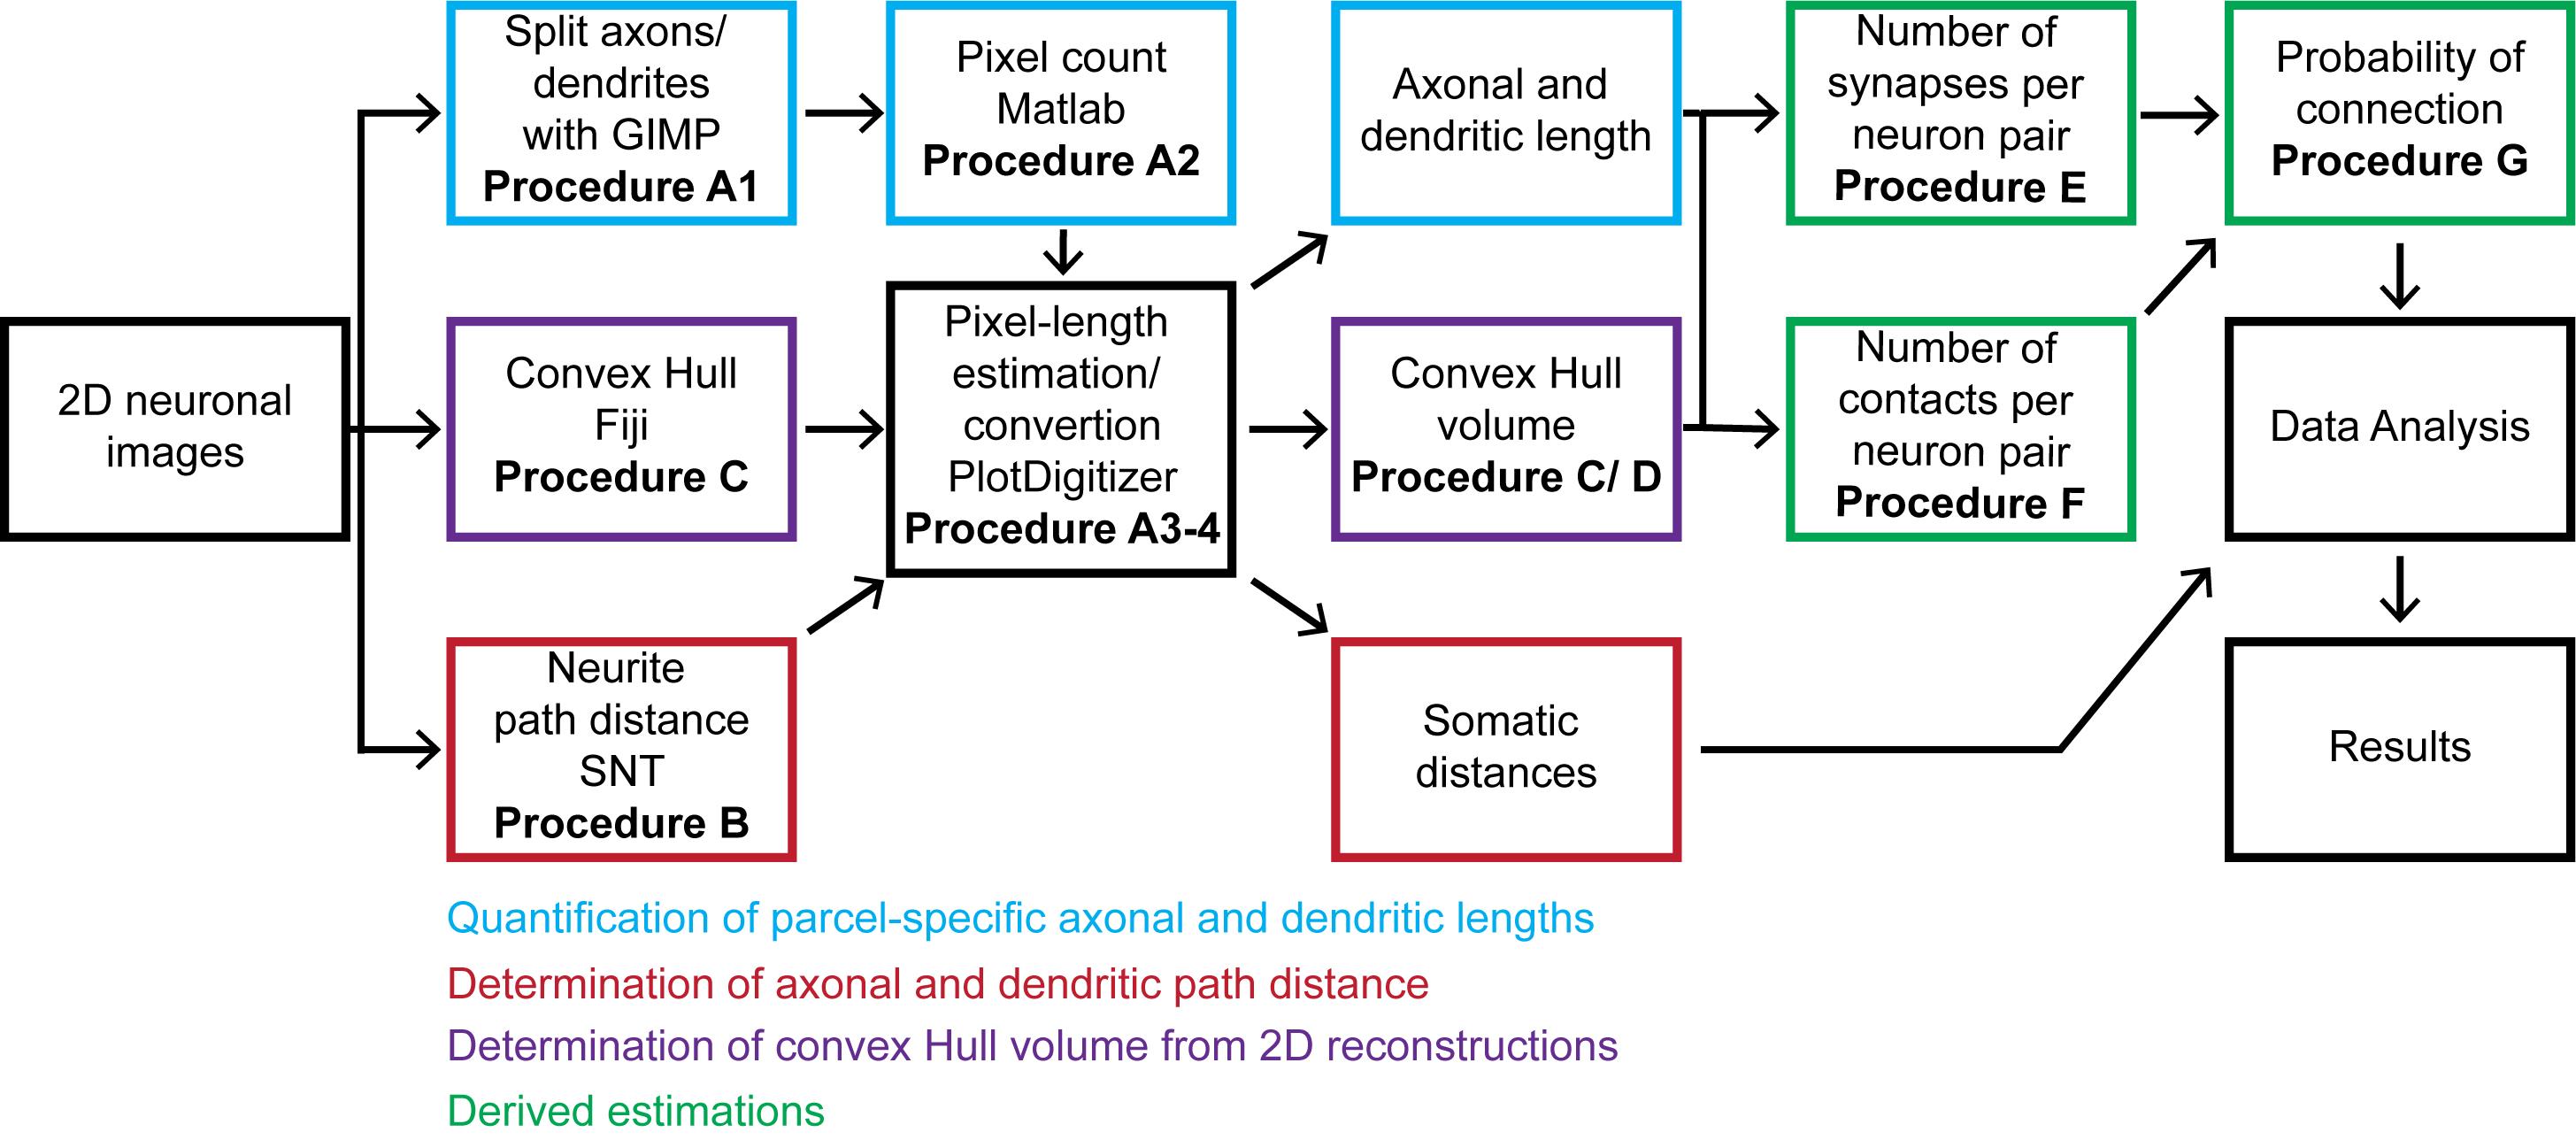
Figure 1. Flow chart of the described pipeline. The procedure starts from 2D neuronal images that are processed to quantitate axonal and dendritic lengths, path distances from the soma by parcel, and convex hull volumes. From these quantitations, we calculate the number of synapses and contacts per neuronal pair and subsequently estimate the probabilities of connection from multiple neuronal pairs. The generated information is analyzed and presented as the mean and standard deviation.
Equipment
Standard personal computer
The described analysis was performed using a Bionic G32 144Hz All In One PC [i7-8700] with Windows 10. The recommended minimal configuration is AMD Ryzen 5 2600X Six-Core Processor 3.60 GHz, 16 GB RAM, 64-bit operating system.
Software
GNU Image Manipulation Program, free access (GIMP 2.8; gimp.org/downloads/).
Custom-made MATLAB algorithm, free access (github.com/Hippocampome-Org/QuantifyNeurites)
Plot Digitizer, free access (plotdigitizer.sourceforge.net)
Fiji: Shape Analysis plugin, free access (Wagner and Lipinski, 2013; imagej.net/Shape_Filter)
Fiji: Simple Neurite Tracer plugin, free access (Longair et al., 2011; imagej.net/Simple_Neurite_Tracer:_Basic_Instructions)
Fiji: 3D Convex Hull, free access (imagej.nih.gov/ij/plugins/3d-convex-hull)
MATLAB: commercial license; 30-day free trial available (mathworks.com/products/get-matlab.html)
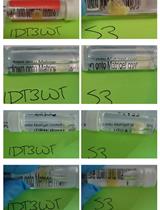
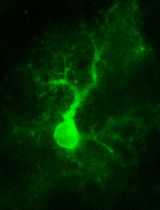
Required are figures containing drawings of neuronal morphology, such as dendritic and axonal arbors (Recipe 1). If both axons and dendrites originate from the same neuron, they need to be drawn in distinct colors. If the arbors invade multiple anatomical parcels, the figure must demarcate the parcel boundaries when parcel-specific data are required. IMPORTANT: All figures need to contain a calibration bar. The examples used in this protocol are accessible at hippocampome.org/php/data/Bio-protocol_sample_files.zip.
Required are estimations of the volumes of anatomical parcels in which the neurons of interest are contained (Recipe 2). The examples used in this protocol are listed in Table 1 and accessible at bbp.epfl.ch/nexus/cell-atlas.
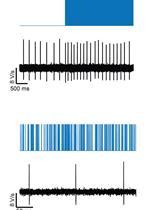
Required are estimations of the average distance between presynaptic elements (boutons) along the axons and of the average distance between postsynaptic elements (spines of shaft densities) along the dendrites for the species and neural system of interest (Recipe 3). The examples used in this protocol are accessible at hippocampome.org/php/data/Bio-protocol_sample_files.zip.
Procedure
文章信息
版权信息
© 2021 The Authors; exclusive licensee Bio-protocol LLC.
如何引用
Readers should cite both the Bio-protocol article and the original research article where this protocol was used:
- Tecuatl, C., Wheeler, D. W. and Ascoli, G. A. (2021). A Method for Estimating the Potential Synaptic Connections Between Axons and Dendrites From 2D Neuronal Images . Bio-protocol 11(13): e4073. DOI: 10.21769/BioProtoc.4073.
- Tecuatl, C., Wheeler, D. W., Sutton, N. and Ascoli, G. A. (2021). Comprehensive estimates of potential synaptic connections in local circuits of the rodent hippocampal formation by axonal-dendritic overlap. J Neurosci 41(8): 1665-1683.
分类
细胞生物学 > 细胞成像 > 固定组织成像
神经科学 > 细胞机理 > 胞内信号传导
您对这篇实验方法有问题吗?
在此处发布您的问题,我们将邀请本文作者来回答。同时,我们会将您的问题发布到Bio-protocol Exchange,以便寻求社区成员的帮助。