

Use of Optogenetic Amyloid-β to Monitor Protein Aggregation in Drosophila melanogaster, Danio rerio and Caenorhabditis elegans
利用光遗传学淀粉样蛋白-β监测黑腹果蝇、斑马鱼和秀丽隐杆线虫体内蛋白质聚集
发布: 2020年12月05日第10卷第23期 DOI: 10.21769/BioProtoc.3856 浏览次数: 5967
评审: David PaulStefania BruniAnonymous reviewer(s)
参见作者原研究论文
The authors used this protocol in:

Mar 2020
Advertisement


Abstract
Alzheimer’s Disease (AD) has long been associated with accumulation of extracellular amyloid plaques (Aβ) originating from the Amyloid Precursor Protein. Plaques have, however, been discovered in healthy individuals and not all AD brains show plaques, suggesting that extracellular Aβ aggregates may play a smaller role than anticipated. One limitation to studying Aβ peptide in vivo during disease progression is the inability to induce aggregation in a controlled manner. We developed an optogenetic method to induce Aβ aggregation and tested its biological influence in three model organisms–D. melanogaster, C. elegans and D. rerio. We generated a fluorescently labeled, optogenetic Aβ peptide that oligomerizes rapidly in vivo in the presence of blue light in all organisms. Here, we detail the procedures for expressing this fusion protein in animal models, investigating the effects on the nervous system using time lapse light-sheet microscopy, and performing metabolic assays to measure changes due to intracellular Aβ aggregation. This method, employing optogenetics to study the pathology of AD, allows spatial and temporal control in vivo that cannot be achieved by any other method at present.
Keywords: Optogenetics (光遗传学)Background
Alzheimer’s disease (AD) is a debilitating, age-associated, neurodegenerative disease (Zhang et al., 2011; De-Paula et al., 2012; Kumar et al., 2015). The accumulation of amyloid beta (Aβ) as extracellular Aβ plaques is believed to be a major cause of the disease (Hardy and Higgins, 1992), but the failure of interventions that target these Aβ plaques and their presence in brains of non-AD symptomatic individuals (Hawkes, 2016; Cummings et al., 2018) suggest further mechanistic analysis is required. An alternative hypothesis of neurotoxicity induced by soluble intracellular Aβ aggregates has been proposed (LaFerla et al., 2007; Ferreira and Klein, 2011), but currently there is a dearth of tools to control Aβ oligomerization in vivo to study the effects of soluble Aβ aggregates on disease progression and the therapeutic potential of drugs.
Optogenetics is the ideal tool for this purpose as it allows highly precise spatial and temporal regulation of proteins in vivo simply by exposure of the organism to light of a specific wavelength (Moglich and Moffat, 2010; Fenno et al., 2011). We have applied this approach to a variety of problems including embryonic development and homeostasis (Kaur et al., 2017; Bunnag et al., 2020), and have recently shown that inducing aggregation of soluble Aβ protein using optogenetics led to metabolic and physical damage and deteriorating lifespan and healthspan in 3 model organisms–Drosophila melanogaster, C. elegans and D. rerio, as well as in standard tissue culture models (Lim and Mathuru, 2017; Lim et al., 2020). Here, we describe the method used to construct an optogenetic light-inducible Aβ protein that oligomerizes on exposure to blue light in vivo in different model organisms and investigate the downstream detrimental effects using various metabolic assays and time-lapse live imaging. We used the photolyase homology region of the Arabidopsis thaliana cryptochrome 2 as an optogenetic switch (CRY2) protein that oligomerizes into photobodies quickly and reversibly in the presence of blue light (Mas et al., 2000; Bugaj et al., 2013). This CRY2 domain was generated as a Aβ-CRY2-mCherry fusion protein to induce aggregation of Aβ protein upon activation by blue light with visualization through the mCherry fluorescent protein.
Incorporation of this versatile tool with easily manipulatable genetic models such as D. melanogaster, C. elegans and D. rerio, gave us temporal control over the induction of soluble Aβ oligomers not feasible with other currently available Alzheimer’s animal models. We were also able to dissect the pathological effects of Aβ oligomers on embryos during development in real-time using live imaging as well as in adult flies (Lim et al., 2020). This model also allows us to generate mosaics of embryos such that only one half of the embryo, or a small portion is exposed to blue light. Hence, we can investigate the effects of targeted light-induced Aβ oligomerization on various anatomical structures such as the nervous system with the unlit portion of the embryo acting as the control. Functionality in both the invertebrate and vertebrate lab models demonstrates this technique’s application to study the biochemistry, metabolism, cellular and neuronal biology of induced Aβ oligomerization. The effects of potential drug interventions on lifespan, health span and metabolism can also be studied with this robust optogenetic approach in various model organisms. We were able to adopt different strategies to express the same transgene in both invertebrates and vertebrates, which should translate to mouse studies through the conditional knock-in approach. Aggregation could be induced in brains of adult mice with exposure to blue light to study the effects of Aβ-CRY2-mCh aggregation on neuronal function and behavior. This protocol is specific to Aβ, but could easily be adapted to other aggregating proteins simply by changing the starting gene.
Materials and Reagents
Molecular cloning of optogenetic transgenes
10 cm Petri dishes (Greiner Bio One International, catalog number: 633185 )
14 ml tubes PP (Bio Lab, catalog number: 352059 )
1.5 ml Micro tubes (Axygen, catalog number: MCT-150-L-C )
Pipette tips (fitting for 100-1,000 μl, 20-200 μl, 2-50 μl and 0.5-10 μl pipettes)
Microloader (Eppendorf)
pUCIDT-attL1-Human ABeta-attR5 (Addgene: 160436)
Note: The Aβ human gene was synthesized with attL1 and attR5 overhangs into a Kanamycin resistant plasmid backbone for use as a Gateway entry vector.
pUCIDT-attL1-Worm ABeta-attR5 (Addgene: 160437)
Note: The Aβ worm gene was synthesized with attL1 and attR5 overhangs into a Kanamycin resistant plasmid backbone for use as a Gateway entry vector.
pDONR-attL5-CRY2-mCh-attL2 (Addgene: 160438)
Note: CRY2-mCh was amplified from pCRY2PHR-mCherryN1 (which was a gift from Chandra Tucker (Addgene plasmid, catalog number: 26866) (Kennedy et al., 2010). attB5 and attB2 sites were added to the CRY2-mCh PCR product and recombined into pDONR P5-P2 vector. The final pDONR-attL5-CRY2-mCh-attL2 plasmid was used as a Gateway entry vector.
pUASg-HA-attB (Drosophila Genomics Resource Center, stock number: 1423)
Note: Vector specific sequencing primers used were HSP
Forward: TATAAATAGAGGCGCTTCGT
HA Reverse: AGCGTAATCTGGAACGTCATA
pDEST-hsp16-2p (a kind gift from Hidehito Kuroyanagi, Medical Research Institute, Tokyo Medical and Dental University)
Note: Vector specific sequencing primer used was Hsp16-2p: CGAATGTGAGTCGCCCTCCT
pDEST-Tol2-PA2-CMV (Tol2 kit). Used in molecular cloning of following transgenes for Danio rerio – a) pDEST-Tol2-PA2-10xUAS-Aβ-CRY2-mCh; b) pDEST-Tol2-PA2-Ubi-Aβ-CRY2-mCh; c) pDEST-Tol2-PA2-CMV-Aβ-mCh (Addgene ID: 160435)
Top 10 competent cells (Thermo Fisher Scientific , catalog number: C404003 )
Agarose, Biotechnology Grade, 500 g (1st Base, catalog number: BIO-1000-500g )
LB Agar Miller, Bacterial Culture media, 500 g (1st Base, catalog number: BIO-4010-500g )
LB Broth Miller, pH 7.0, Bacterial Culture media, 500 g (1st Base, catalog number: BIO-4000-500g )
Ampicillin sodium salt (Sigma, catalog number: A9518G )
Kanamycin sulfate (Sigma, catalog number: K1377 )
MultiSite Gateway® Pro Plus kit (catalog number: 12537100 )
GatewayTM LR ClonaseTM II Enzyme mix (Thermo Fisher Scientific , catalog number: 11791100 )
GatewayTM BP ClonaseTM Enzyme mix (Thermo Fisher Scientific , catalog number: 11789020 )
Phusion High-Fidelity PCR kit (Thermo Fisher Scientific , catalog number: F553S )
Gibson Assembly® Cloning kit (New England Biolabs, catalog number: E5510S )
Low melting point agarose (Promega, catalog number: V2111 )
Expression of optogenetic transgenes in neurons in vivo (for D. melanogaster)
1 L microwave-safe glass beaker
Magnetic stirrer
50 ml glass beaker
Spatula
Compressed carbon dioxide gas cylinder (any brand)
LED lamp (any brand)
Aluminum foil (any brand)
Styrofoam box (any brand)
Fly cages for 60 mm Petri dishes (any, e.g., Small Embryo Collection Cage For 60 mm Petri Dishes, FlyStuff, catalog number: 59-100 )
60 mm Petri dishes (any brand, e.g., NuncTM EasYDishTM Dishes, ThermoFisher Scientific , catalog number: 150462 )
Drosophila sorting brush (any brand) or a very thin paint brush
Drosophila [Bloomington Drosophila Stock Center (NIH P40OD018537)]. Stock number 458, elav promoter driving GAL4 for the GAL4/UAS system (Brand and Perrimon, 1993)
P(ET-QF2.GU)repo [Q system from Bloomington Drosophila Stock Center (NIH P40OD018537), stock number: 66477] (Lin and Potter, 2016)
P(QUAS-mCD8-GFP)X (Q system from Bloomington Drosophila Stock Center [NIH P40OD018537), stock number: 30001) (Lin and Potter, 2016)
Bacto agar
Glucose
Cornmeal
Brewer’s yeast
Nipagin
FlyStuff Grape Agar Premix, For Embryo Collection (25 Packets/Unit) (FlyStuff, catalog number: GEN47-102 )
Yeast paste (Bruggeman Instant Dry Yeast Blue, 500g)
Standard fly food (see Recipes)
Grape juice agar plates (see Recipes)
Yeast paste (see Recipes)
Crosses and expression of constructs (for D. rerio)
3 ml Pasteur Pipette (Tarson, catalog number: T940050 )
Tg gng8:Gal4 (with thanks to Prof. Marnie Halpern) (Hong et al., 2013)
Tg UAS:GCamp6S in nacre background (mitfa-/-)
Tricaine (MS-222 or Ethyl 3-aminobenzoate methanesulfonate; Sigma, catalog number: A5040 )
NaCl
KCl
CaCl2·2H2O
MgSO4·7H2O
Tris-HCl
25x Tricaine stock solution (for D. rerio)
60x E3 stock solution (see Recipes)
Microinjection and expression of UAS construct (for D. rerio)
Standard wall borosilicate glass with filament (SUTTER INSTRUMENT, model: O.D 1 mm, I.D 0.5 mm, Length 7.5 cm, catalog number: BF100-5-7.5 )
Light-sheet microscopy to image neural development during embryogenesis (for D. melanogaster)
Disposable dropper (any brand)
15 ml Falcon tubes (any brand)
Stainless steel dissecting needle, L160 mm (Hammacher, HWO010-16, catalog number: 91-2483 )
Glass capillary, size 2 black, inner diameter of capillary ~1 mm (BRAND GmbH, catalog number: 701932 ) with corresponding plunger
5 cm long electrical copper wire (or any other fine tip wire)
Weighing boat
Halocarbon oil 27 (Chemical Raw Materials Ltd, catalog number: 3904 9000 )
Bleach (Clorox)
Autoclaved MilliQ water
1% Agarose, low gelling temperature Type VII-A (Sigma, catalog number: A0701 ) dissolved in water aliquoted into 1.5 ml Eppendorf tubes (see Recipes)
Light-sheet microscopy to image Aβ-CRY2-mCh in neurons in fish (in D. rerio)
Heating block for mounting medium
D. rerio Mitochondrial metabolic flux assay
D. rerio Adenosine triphosphate (ATP) assay
Firefly Lantern Extract (Sigma-Aldrich, catalog number: FLE250 )
MgSO4·7H2O (Sigma-Aldrich, catalog number: 230391 )
KH2PO4 (Sigma-Aldrich, catalog number: P0662 )
Na2HASO4·7H2O (Sigma-Aldrich, catalog number: S9663 )
TCA powder (Sigma-Aldrich, catalog number: T6399 )
10% Trichloroacetic acid (TCA) solution (see Recipes)
Arsenite ATP buffer (see Recipes)
25x Tricaine stock solution (for D. rerio) (see Recipes)
Fluorescence microscopy to image Aβ aggregates in C. elegans
Equipment
Expression of optogenetic transgenes in neurons in vivo (for D. melanogaster)
Drosophila workstation with CO2 pad (Flowbuddy Complete; Genesee Scientific , catalog number: 59-122WC )
Incubator for 25 °C incubation of flies (any brand, e.g., INVICTUS Drosophila Incubator, Genesee Scientific )
Stereo microscope (any brand, e.g., Leica, model: M50 )
Fluorescence stereo microscope (any brand, e.g., Leica MZ16F )
Light-sheet microscopy to image neural development during embryogenesis (for D. melanogaster)
Dissecting fine-pointed serrated forceps (any brand)
Heat block with temperature range 37 °C and 70 °C (any brand, e.g., Digital block heater, Thermo Fisher Scientific )
Zeiss Light-sheet Z.1 (Carl Zeiss)
Sample chamber
For experiments with D. rerio
Incubator for bacterial culture, 37 °C
Shaker incubator for bacterial culture, 37 °C
Light-sheet microscopy to image Aβ aggregation in imaging zebrafish
Seahorse extracellular flux analyzer (Agilent Technologies, Seahorse Bioscience, model: XFe96 )
Cytation 3 Cell Imaging Multi-Mode Reader (BioTek Instruments)
Micropestle homogenizer
Fluorescence microscopy to image Aβ aggregates in C. elegans
Incubator for zebrafish embryos, 28 °C
Forceps (F.S.T, model: Student Fine Forceps, Straight, catalog number: 91115-10 )
Micropipette puller (SUTTER INSTRUMENT, model: P-1000 )
Microinjection system (Harvard Apparatus, model: PLI-90 Pico-injector )
Confocal microscope (Zeiss, model: LSM800 )
Other assays used to confirm aggregation-induced deficits in C. elegans
Software
Light-sheet microscopy to image neural development during embryogenesis
ZEN 2014 Processing software package for Light-sheet Z.1 (Carl Zeiss, catalog number: 410136-1059-130)
MetaMorph® Microscopy Automation and Image Analysis Software (Molecular Devices)
Procedure
Molecular cloning of optogenetic transgenes for expression in D. melanogaster and C. elegans
Use the human Aβ1-42 amino acid sequence (Aβ Human) to generate transgenes for Drosophila and zebrafish. For C. elegans, use a nematode-codon-optimized version of Aβ1-42 (Aβ Worm) (Fong et al., 2016). For Drosophila expression of human Aβ-CRY2-mCh, obtain the human Aβ DNA sequence with attL1 and attR5 overhangs in a Gateway entry vector (pUCIDT-attL1-Human ABeta-attR5) and the pDONR-attL5-CRY2-mCh-attL2. Perform a multi-site Gateway LR reaction to insert these constructs into the pUASg-HA-attB Drosophila expression vector (Bischof et al., 2007), according to the manufacturer’s instructions (Invitrogen, ThermoFisher Scientific ). For C. elegans expression of worm Aβ-CRY2-mCh, perform a multi-site Gateway LR reaction between the pUCIDT-attL1-Worm ABeta-attR5 entry vector, the pDONR-attL5-CRY2-mCh-attL2 and the pDEST-hsp-16–2p C. elegans expression vector, as per the manufacturer’s instructions (Invitrogen, ThermoFisher Scientific ). For all transgenes generated, use vector specific primers for sequencing to confirm the orientation and insertion of both fragments into the destination vector.
Molecular cloning of optogenetic transgenes for Danio rerio (zebrafish) – a) pDEST-Tol2-PA2-10xUAS-Aβ-CRY2-mCh; b) pDEST-Tol2-PA2-Ubi-Aβ-CRY2-mCh; c) pDEST-Tol2-PA2-CMV-Aβ-mCh
- Cloning single DNA element of interest into gateway compatible vector
PCR amplify 10xUAS, Ubi and CMV sequence with specific primer flanked by attB4 (Forward primer) and attB1 (Reverse primer) and cloned into pDONRTMP4-P1R to generate 5' entry plasmid via BP recombination. Verify correct clones by sequencing primers M13F or 5' GTAAAACGACGGCCAGT3' and M13Rev 5' CAGGAAACAGCTATGAC3'.
PCR amplify the Aβ-CRY2-mCh with specific primer flanked attB1 (Forward primer) and attB2 (Reverse primer) and cloned into pDONR221TM to generate middle entry plasmid via BP recombination. Verify correct clones by M13 primers (same as 1).
Note: The 3' entry vector containing poly-A signal (p3' PolyA) and the Destination plasmid containing the Tol2 recognition sites (pDestTol2PA2) originated in the Kawakami Laboratory and are available as–Tol2 kit (Kawakami, 2007).
Create compatible attL sites on each entry plasmids following BP recombination. LR recombination to generate expression plasmid. Verify correct clones by sequencing primers
Forward: 5' CAAGTTTGTACAAAAAAGCAGGCTTA3'
Reverse: 5' TACCCAGCTTTCTTGTACAAAGTGGGGGA 3'.
Summary of the fragment assembly is shown in Figure 1.
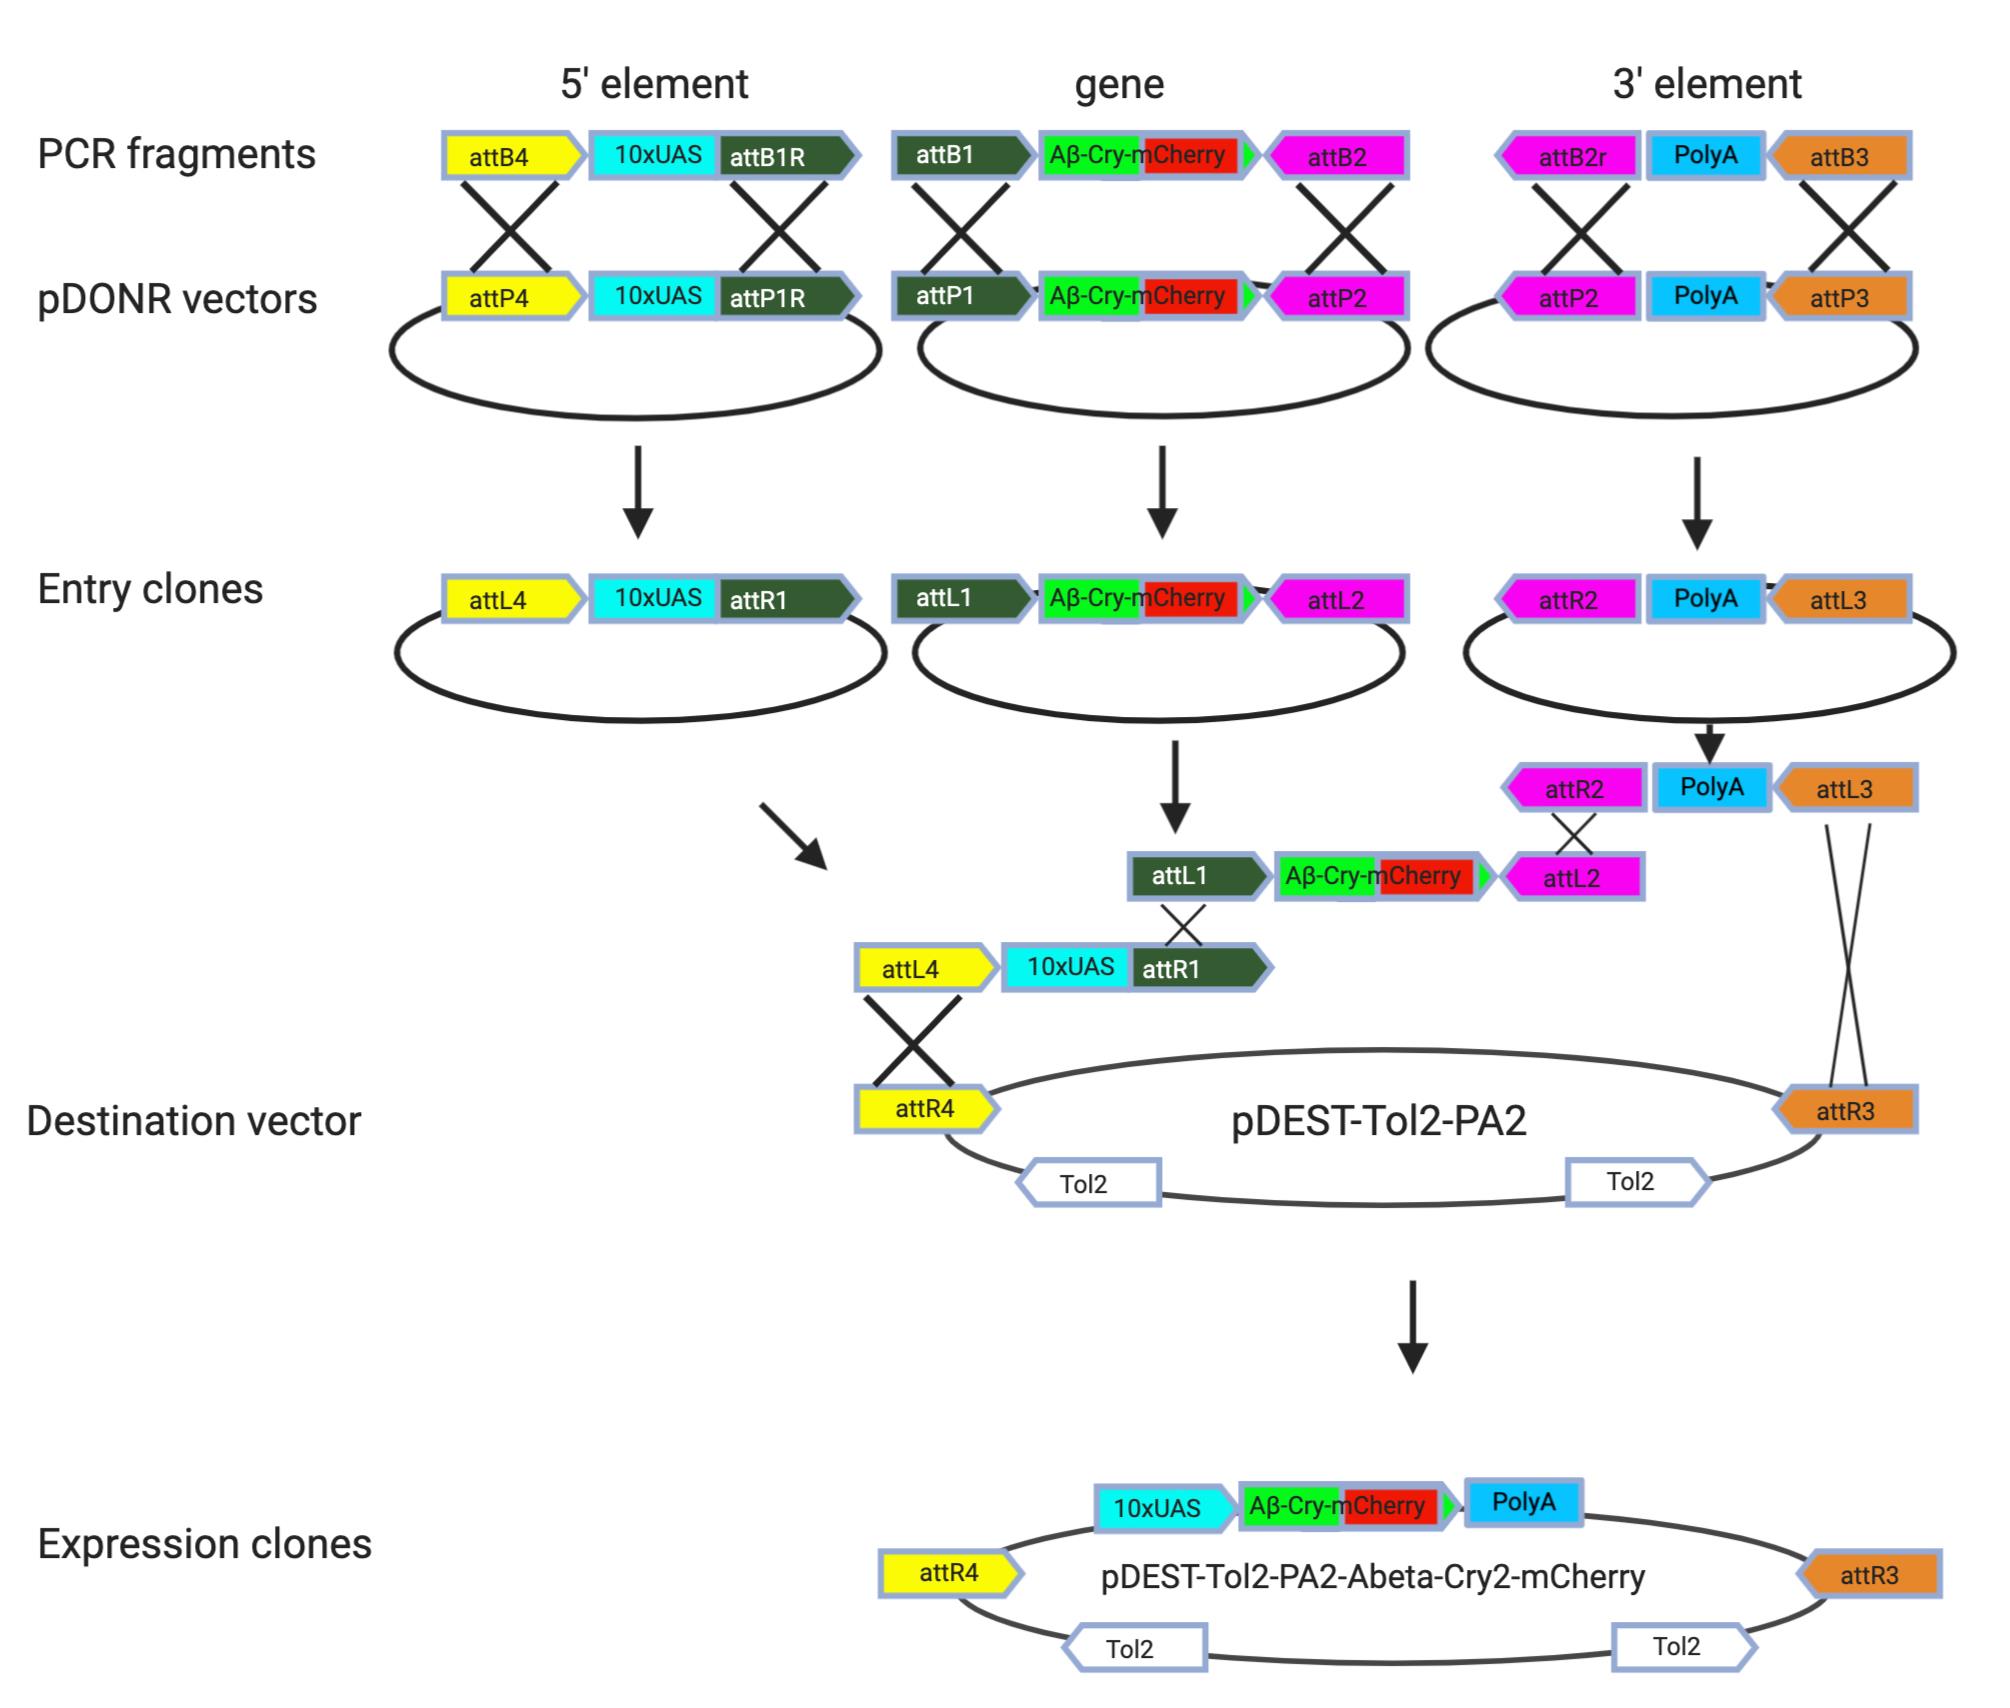
Figure 1. Generation of expression clones for zebrafish transgenic
Expression of optogenetic transgenes in neurons in vivo
For D. melanogaster, inject the pUASg-humanAβ-CRY2-mCh-HA-attB transgene into attP2 (Strain#8622) P[CaryP]attP268A4 (BestGene Inc (California)) (Groth et al., 2004; Markstein et al., 2008). Transgenic flies will be provided upon request. Isolate at least 5 homozygous male UAS-Aβ-CRY2-mCh flies and cross these with at least 10 Elav-Gal4, Repo-QF2; QUAS-GFP female virgin flies to drive neuronal expression of Aβ-CRY2-mCh and glial expression of GFP in the F1 generation. Place these male and female flies in a fly cage and cover with a pre-warmed grape juice agar plate smeared with a small amount of yeast paste to encourage egg laying. Keep the cages in a 25 °C incubator. For control flies, use UAS-TdTomato homozygous males instead. Change the fly plates every day and replace with pre-warmed grape juice agar plates that have a small amount of yeast paste on them. Allow newly set up cages to lay eggs for about 3 days to ensure a good number of developing embryos before using them for experiments.
For C. elegans, obtain transgenic strain (gnaEx1[myo-2p::YFP+hsp-16-2p::Abeta1-42:: CRY2::mCherry]) from Caenorhabditis Genetics Center (CGC). Age-synchronize transgenic nematodes through hypochlorite bleaching (Stiernagle, 2006). To induce in vivo expression of Aβ-CRY2-mCh driven by the hsp16-2 promoter, incubate day 1 adult nematodes at 35 °C for 1 h. After 1 h incubation, separate the nematodes into light/dark groups and grow them in a 20 °C incubator. For dark treatment, wrap the plates containing nematodes with aluminum foil and place the wrapped plates inside a Styrofoam box. Place the Styrofoam box at the top of incubator rack to avoid exposure to the LED light. For light treatment, place the plates containing nematodes directly under the LED light on the bottom rack of the incubator.
For D. rerio: Zebrafish lines (with Gal4; UAS) express the transgene in specific neurons or cells. To prevent oligomerization in ubiquitously expressing larvae, raise injected embryos in a dark incubator until experimentation. Minimize light exposure for transferring plates out or for sorting to avoid exposure to high LED light. For light treatment for mitochondrial flux analysis or ATP measurements, place the larvae under white LED light of a stereoscope for 2 h. Larvae with more restricted expression such as those used in light-sheet imaging were less sensitive to light exposure but were still raised in the dark till imaging as described in the following sections.
Microinjection and expression of UAS construct (preparation on Day -1)
The day before the injection, set up the fish in breeding tanks with dividers (Video 1).
Video 1. Zebrafish microinjection
Using a strainer, collect the embryos and rinse with tap water before transferring them into a 10 cm Petri dishes containing E3 (1x). Remove unfertilized eggs and debris with a Pasteur pipette.
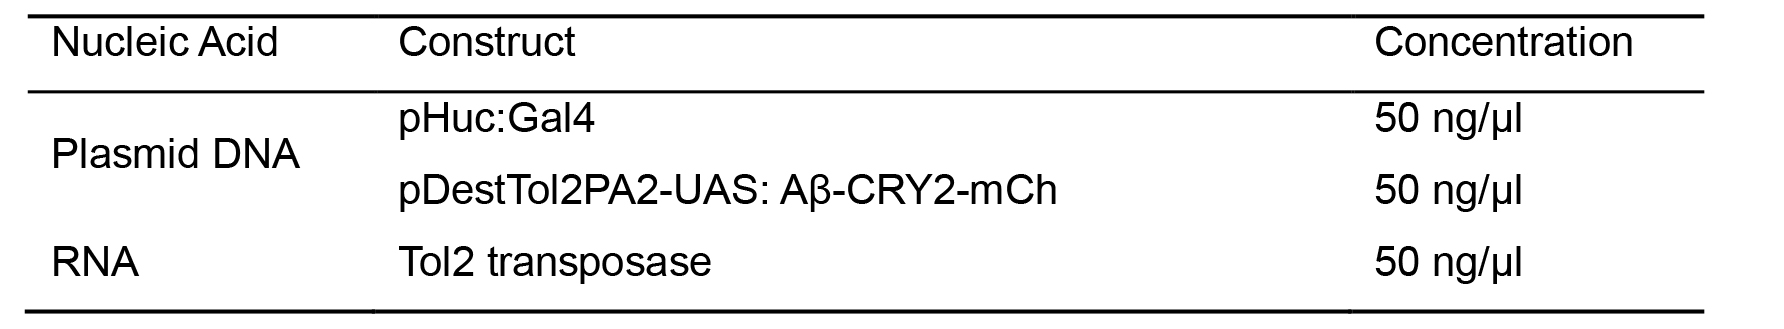
Prepare the injection needle by micropipette puller and backfilled with 3 μl of the mixture listed in the table (Table 1) using a Microloader.
Fix the needle onto the micromanipulator connected to the microinjection system.
Make a microinjection plate with 3% agarose using a custom-built plastic mold with grooves.
Table 1.Microinjections mixture for zebrafish embryos
Microinjection and expression of UAS construct (Day 0)
The following morning (Day 0), remove the divider and allow approximately 15-20 min of undisturbed mating time (Video 1).
Use a Pasteur pipette to align the embryos along the trenches and remove excess water to prevent embryos from moving during injection.
Inject one-cell stage embryos with ~5 pL of DNA + RNA mixture under a stereoscope equipped with the injection apparatus. The apparatus consists of a needle holder attached to an MHC model magnetic stand and connected to PLI-90 Pico-injector , a foot switch to pulse the injection solution into the embryos and assisted by a backpressure unit to gauge the pulse release of pressurized nitrogen. Aim to inject around 200 to 300 embryos in 1 hour.
Immerse injected embryos in E3 (1x). Save and raise 20 to 30 non- injected embryos alongside the injected embryos to assess microinjection induced damage. Use standard zebrafish embryos bleaching protocol (https://zfin.org/zf_info/zfbook/chapt1/1.5.html) and split them into 2 groups after bleaching.
Incubate all the embryos at 28 °C in the dark. Use 1 group of the injected embryos for light exposure and the other as controls (dark).
Fluorescence microscopy to detect mCherry expression in D. rerio
Sort injected embryos under fluorescence stereomicroscope at 24 h post fertilization (hpf) (Day 1) for mCherry expression. Clear dead embryos from injected and uninjected dishes and change the water. Expect 5-10% injected embyos to die by 24 hpf.
Replenish the embryos with fresh E3 (1x) daily until they reached 5 days post fertilization (dpf). Send larval zebrafish with mCherry expression to be grown in separate tanks in the hatchery from the non-expression larvae by 7 dpf.
Cover the lid of the container used to grow baby fish with aluminum foil to prevent direct light exposure. Covering can be removed when fish reach adulthood depending on the expression tissue (for instance, sparse neuronal expression)
To generate a permanent line, genotype adult fish by fin clipping at 8 weeks post fertilization (wpf). Use primers specific for Aβ-CRY2 and Gal4 for genotyping. Cross fish which are positive for both Aβ-CRY2 and Gal4 to obtain F1 embryos. Screen embryos for mCherry expression from 4 dpf onwards and follow the steps above. Tol2 transgenesis usually yields more than 50% transgene. However, due to the properties of the Abeta-CRY2, we found only 10% of the injected fish carries both Aβ-CRY2 and Gal4 at the point of genotyping. And only 1-2% showed germline transmission.
Note: It is possible to find fish which are positive for both Gal4 and Abeta-CRY2 in genotyping but do not express mCherry. This could be due to the silencing of the UAS- regulated effector/reporter genes by methylation at the CpG nucleotides (Akitake et al., 2011) or may also due to other unknown factors such as the genomic location of the insertion.
Light-sheet microscopy to image neural development during embryogenesis (in D. melanogaster)
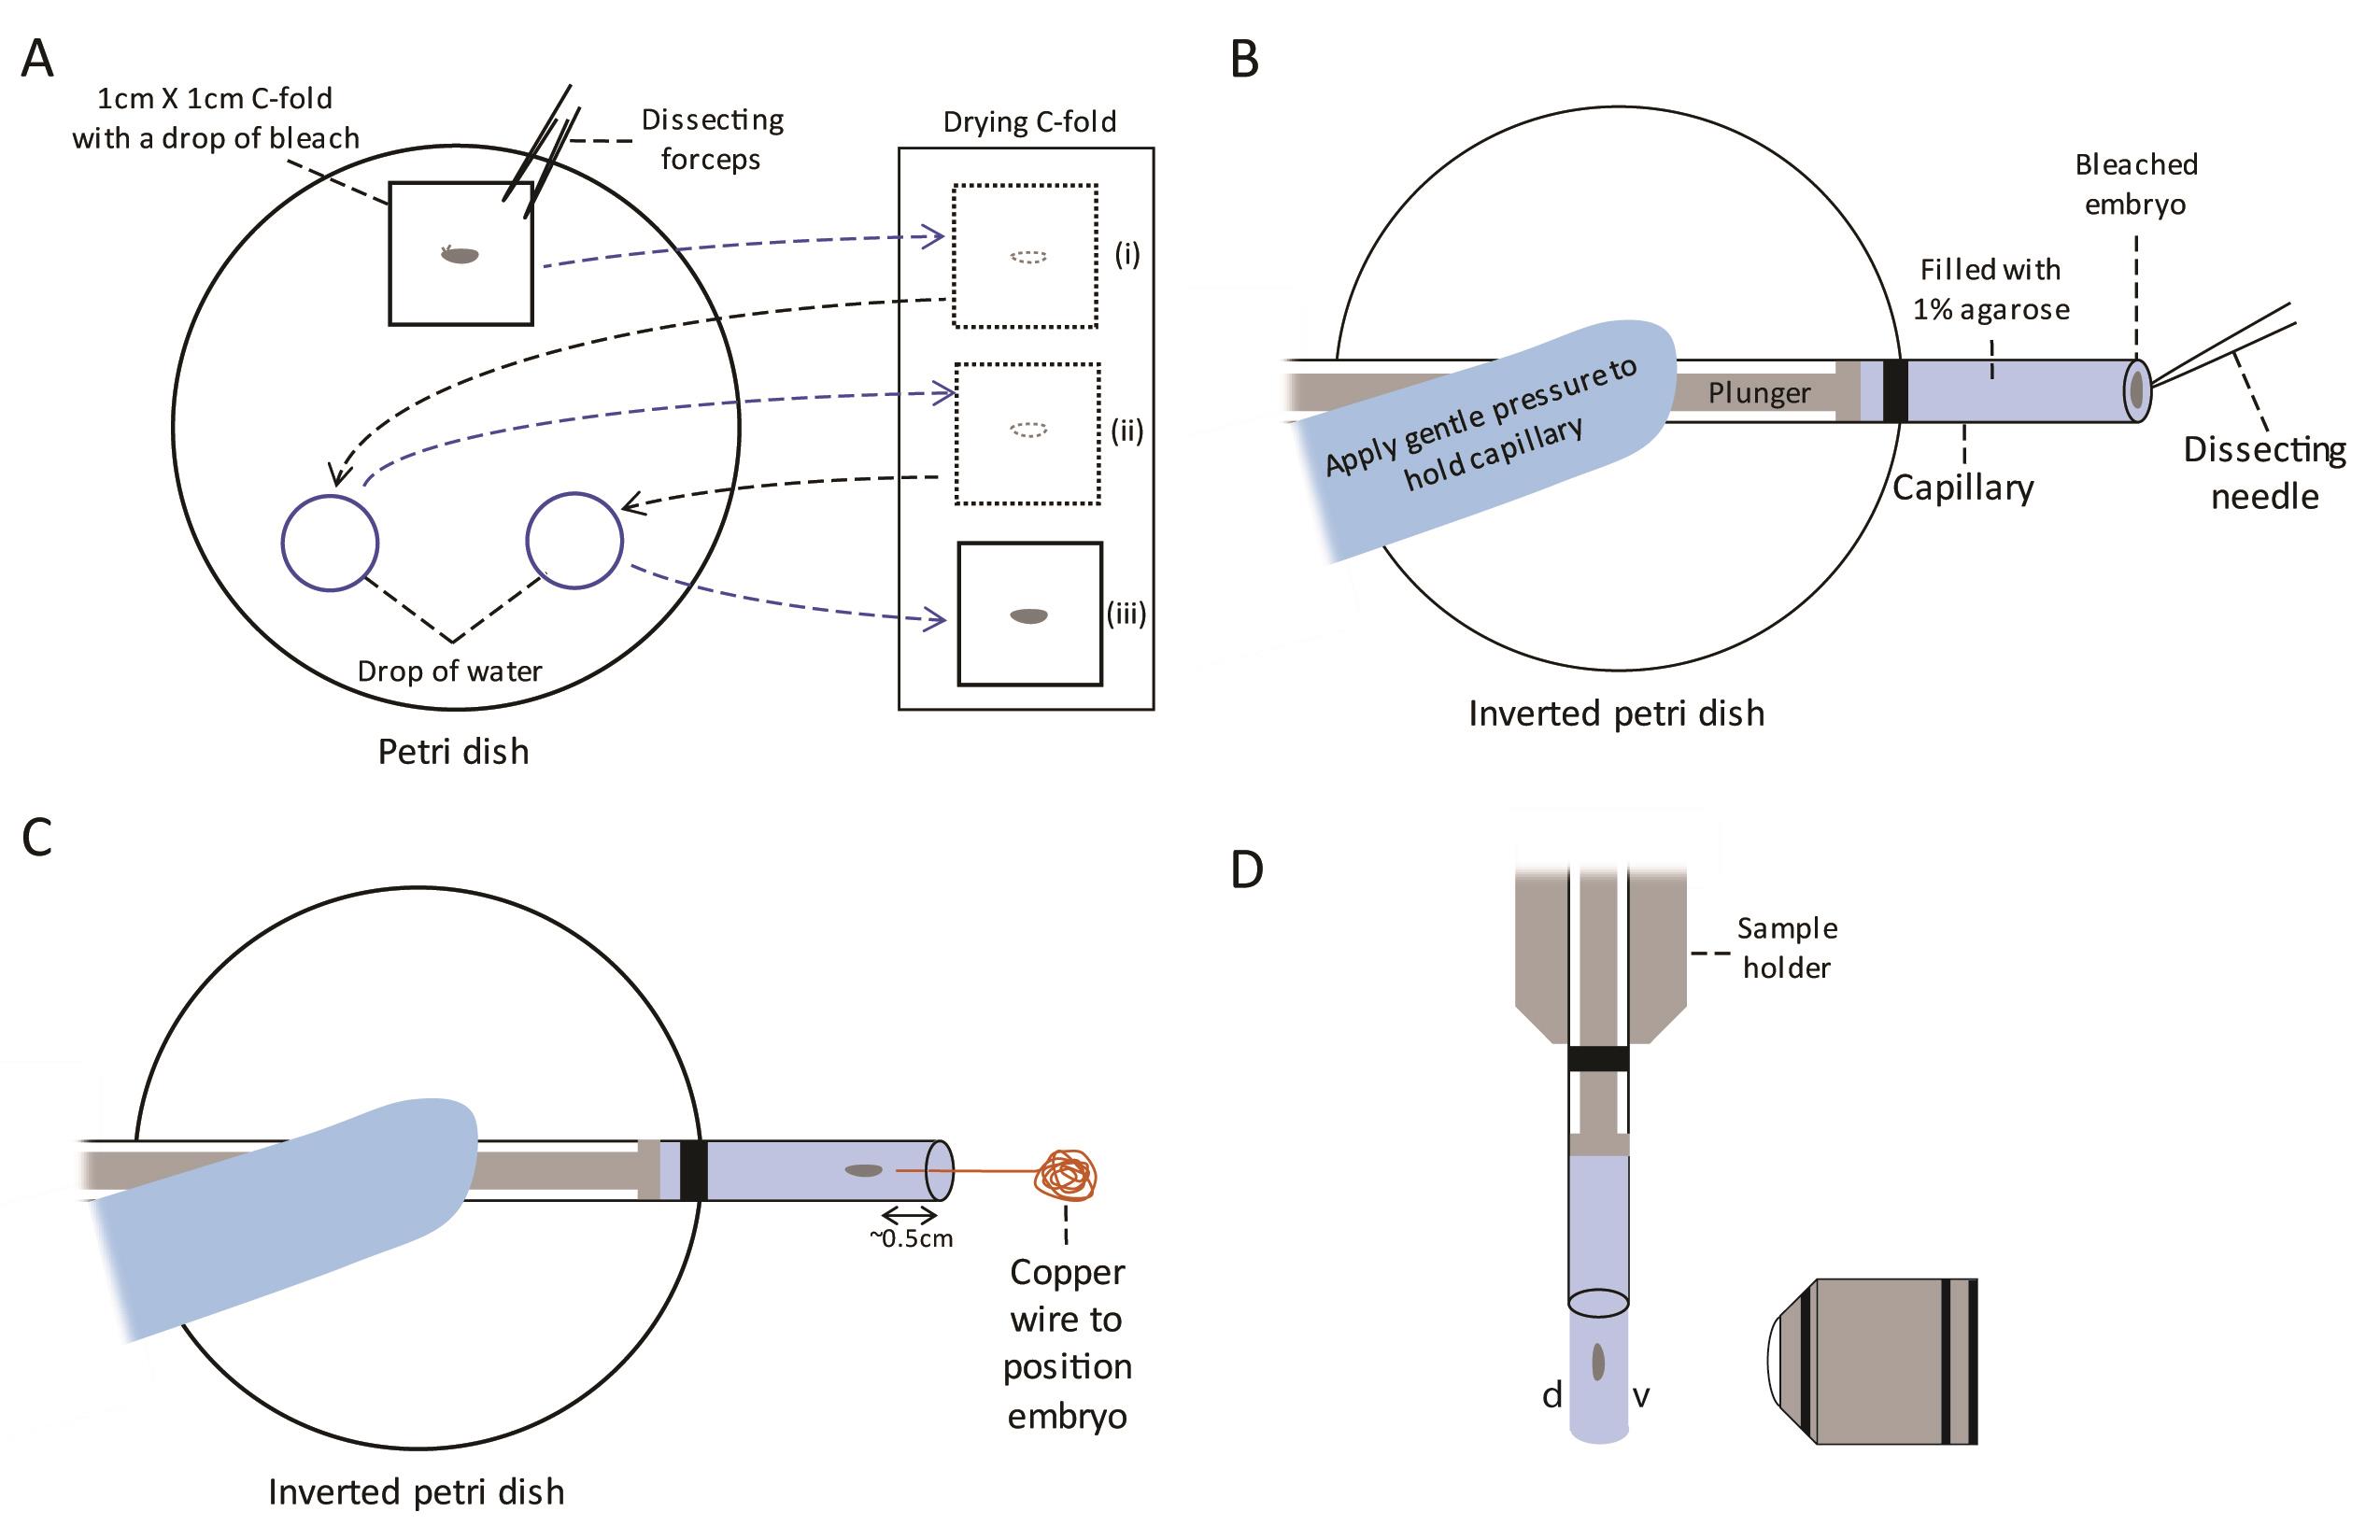
Figure 2. Bleaching and mounting of Drosophila embryo into glass capillary for long term imaging. A. Place a stage 10 embryo in the middle of a piece of C-fold towel and add bleach till soaked. Rotate the embryo to encourage dechorionation. After bleaching, move the C-fold with the embryo on it to a drying C-fold towel using forceps (i). Rinse the embryo with water by transferring the piece of C-fold to a drop of water, let it dry once again on the drying C-fold (ii), and rinse once more in another drop of water before leaving it to dry on the drying C-fold towel (iii). B. Place a capillary filled with melted agarose and hold it in place gently on top of an inverted petri dish. Pick the bleached embryo from the C-fold and place it on the surface of the agarose. C. Push the embryo gently into the agarose using the fine tip of a copper wire and position it parallel to the capillary. D. After allowing the agarose to solidify for 5 min, load the capillary into the sample holder, and lower it into the sample chamber of the Light-sheet Z.1. Eject the agarose slowly such that the embryo just emerges from the capillary. Position the embryo in front of the objective such that the ventral surface (v) faces the objective. d: dorsal. These steps are shown in Video 2.Video 2. Mounting and imaging of Drosophila embryos Melt a tube of 1% low gelling temperature agarose at 70 °C for half an hour in a heat block and then cool it to 37 °C, mix thoroughly by inverting before proceeding with mounting.
Remove the grape agar juice plate from a cup that has been laying eggs for at least 10 h to ensure you obtain a good amount of embryos at stage 10 (Hartenstein, 1993). Pour approximately 1 ml of Halocarbon oil 27 onto the plate with embryos and swirl the oil in a circular manner to spread it out evenly and form a thin layer of oil on the plate. Let it rest for 1 min to allow the oil to penetrate the chorion of all the embryos.
Note: It is best to use plates that have flies laying eggs for 24 h so that proper development and expression of the GFP and mCherry fluorescent proteins in older embryos can be observed before proceeding with mounting and imaging of stage 10 embryos which do not express high levels of these fluorescent tags.
Observe the plate under a fluorescence microscope using transmitted light.
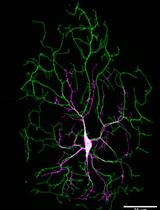
After germ band retraction (stages 14-17 according to [Campos-Ortega and Hartenstein, 1997]), embryos should show a very bright GFP and mCherry signal in the nervous system that mark the glial cells and neurons respectively using reflected light.
Pick 1 stage 10 embryo from the plate using a dissecting needle and transfer it to the center of 1 cm x 1 cm piece of C-fold in a Petri dish under the transmitted light (Figure 2A).
Add a drop of bleach to just soak the piece of C-fold. Add 2 drops of autoclaved water in the same Petri dish as shown in Figure 2A. Use the dissecting needle to roll the embryo up and down on the C-fold and encourage the chorion to peel off. Within 30 s to a minute, the chorion can be seen peeling off under the transmitted light at high magnification with the dorsal appendages disappearing and the matt embryo surface will take on a glossy finish.
As soon the chorion is removed, use dissecting forceps to carefully lift the C-fold from one corner with the dechorionated embryo on it to a dry big piece of C-fold to remove as much bleach as possible (Figure 2A(i)). Rinse the embryo with water by moving the C-fold to the first drop of water, allowing it to soak for 30 s, then move it to another region on the drying C-fold (Figure 2A(ii)). Repeat the rinse with water one last time and allow the C-fold to dry as much as possible by allowing it to rest on an un-used part of the drying C-fold for a minute (Figure 2A(iii)).
Meanwhile, insert the plunger into the size 2 glass capillary and suck up the melted 1% low-melting agarose Type VII-A (Sigma) at 37 °C to just above the black line as shown in Figure 2B. Position the capillary on top of an inverted Petri dish and allow the agarose to cool in the capillary for a minute.
Pick up the dried embryo from the C-fold using a dissecting needle and position it in the center of the capillary (Figure 2B).
Push the embryo into the center of the solidifying agarose using a fine copper wire to a depth of approximately 0.5 cm and maneuver it such that it is parallel to the capillary (Figure 2C). Remove the copper wire very slowly from the agarose once the embryo is in the desired position. Wait for 5 min to allow the agarose to solidify.
Note: Align the embryo in the center of the capillary to ensure it is held securely in the agarose. If it sticks to the glass capillary, push it back into the agarose to avoid slipping out during imaging. This step requires a lot of patience and practice. This was the best way to position the embryo to obtain the highest resolution images. The aliquot of 1% low-melt agarose can be left at 37 °C for use over a long time or cooled and melted when needed several times. However, it will eventually stop solidifying after an extended period of time at 37 °C or after numerous heat-cool cycles. This requires the aliquot in use to be discarded and a new aliquot used thereafter.
Switch on the Light-sheet Z.1 system and start up the Zen 2014 SP software. Inject autoclaved water into the sample chamber such that it filled to the brim as shown in the manufacturer’s protocol.
After the agarose in the capillary has solidified, load the capillary into the sample holder according to the manufacturer’s manual and secure it by tightening the screw. Load the sample holder into the Light-sheet Z.1 and lower it into the sample chamber filled with autoclaved water. Push the embryo out of the capillary slowly such that it is just outside capillary and aligned with the objective (Figure 2D).
Use the Light-sheet Z.1 10x/0.2 Illumination Optics to rotate the capillary such that the ventral surface (v) of the sample faces the objective to obtain high resolution images of the ventral surface (Figure 2D). Acquire images using a Light-sheet Z.1 Illumination objective 40x/1.0 (water immersion). Set up the 20 mW 561 nm laser at 13% laser power with 12.5 ms exposure time and the 30 mW 488 nm at 10% power with 29.95 ms exposure time to activate CRY2 clustering. Set z-stacks at 1 μm intervals and denote the top of the z-stack as approximately 20 sections (20 μm) above the top of the embryo and the bottom of the z-stack as approximately 20 sections (20 μm) from the bottom of the embryo. This is to ensure data is not lost in case the embryo shifts during imaging. Excess z-stack sections can be removed during processing. Set-up a time series acquisition with dual-side illumination in both channels every 2.5 min for 500 cycles. For embryos not exposed to blue light, use only the 561 nm laser. Allow the image acquisition to run for approximately 22 h.
After the imaging is completed, pull the plunger up to insert the embryo back into the capillary and remove the sample holder from the Light-sheet Z.1. Eject the embryo with the agarose and discard these. The capillary can be reused several times.
Light-sheet microscopy to image neuronal damage (in D. rerio)
A custom designed open light-sheet microscope was used for acquiring videos of the zebrafish larvae.
Briefly, mount samples in a customized chamber for light-sheet microscopy on a horizontal stage controlled by an ultrasound motorized 10 nm step size Z-Drive.
Generate a light-sheet using a single illumination arm in front of the sample mounting stage delivering laser beam (488 nm or 561 nm) through a 10x illumination objective.
Acquire images on a Hamamatsu Orca Flash 4.0 V3 sCMOS Camera through a Super High NA (1.0; XLUMPLFLN20xW) 20x water dipping lens.
Use multidimensional acquisition in MetaMorph software with streaming option to acquire data.
Use an acquisition protocol to acquire 1 z-stack with 2 μm step-size per min for 30 min.
Illuminate the sample by 561 nm laser light filtered through a Texas Red/mCherry/AlexaFluor 594 dichroic. At minutes 5 and 6, flood the stage with high intensity transmission white light from X-Cite 120LED System for 45 s. Resume the time lapse imaging for the next 25 min.
Repeat the whole process a second time after acquisition of the first time-lapse.
Make videos from time-lapse images.
Danio rerio Mitochondrial metabolic flux assay
Split injected embryos (C) into 2 dishes for 48 h; one for light exposure condition, and the other as the dark control.
Dechorionate both dishes with minimal reflected light.
Expose experimental embryos to high intensity LED light on a stereoscope for 2 h. Embryos are then loaded into the 96 well plate using a fine Pasteur pipette.
Measure Oxygen Consumption Rate (OCR) using the XF96 Extracellular Flux Analyzer.
Place one embryo (48 hpf) in 175 μl of E3 water in each well and start the experiment.
Measure OCR every 8 min for 6 cycles (48 min), then add a drug.
Calculate the volume of injection needed from the stock concentration of each drug, such that the final concentrations in the well are – a) 9.4 M oligomycin, b) 2.5 μM FCCP and c) 20 mM sodium azide.
The experiment is summarized in Figure 3.
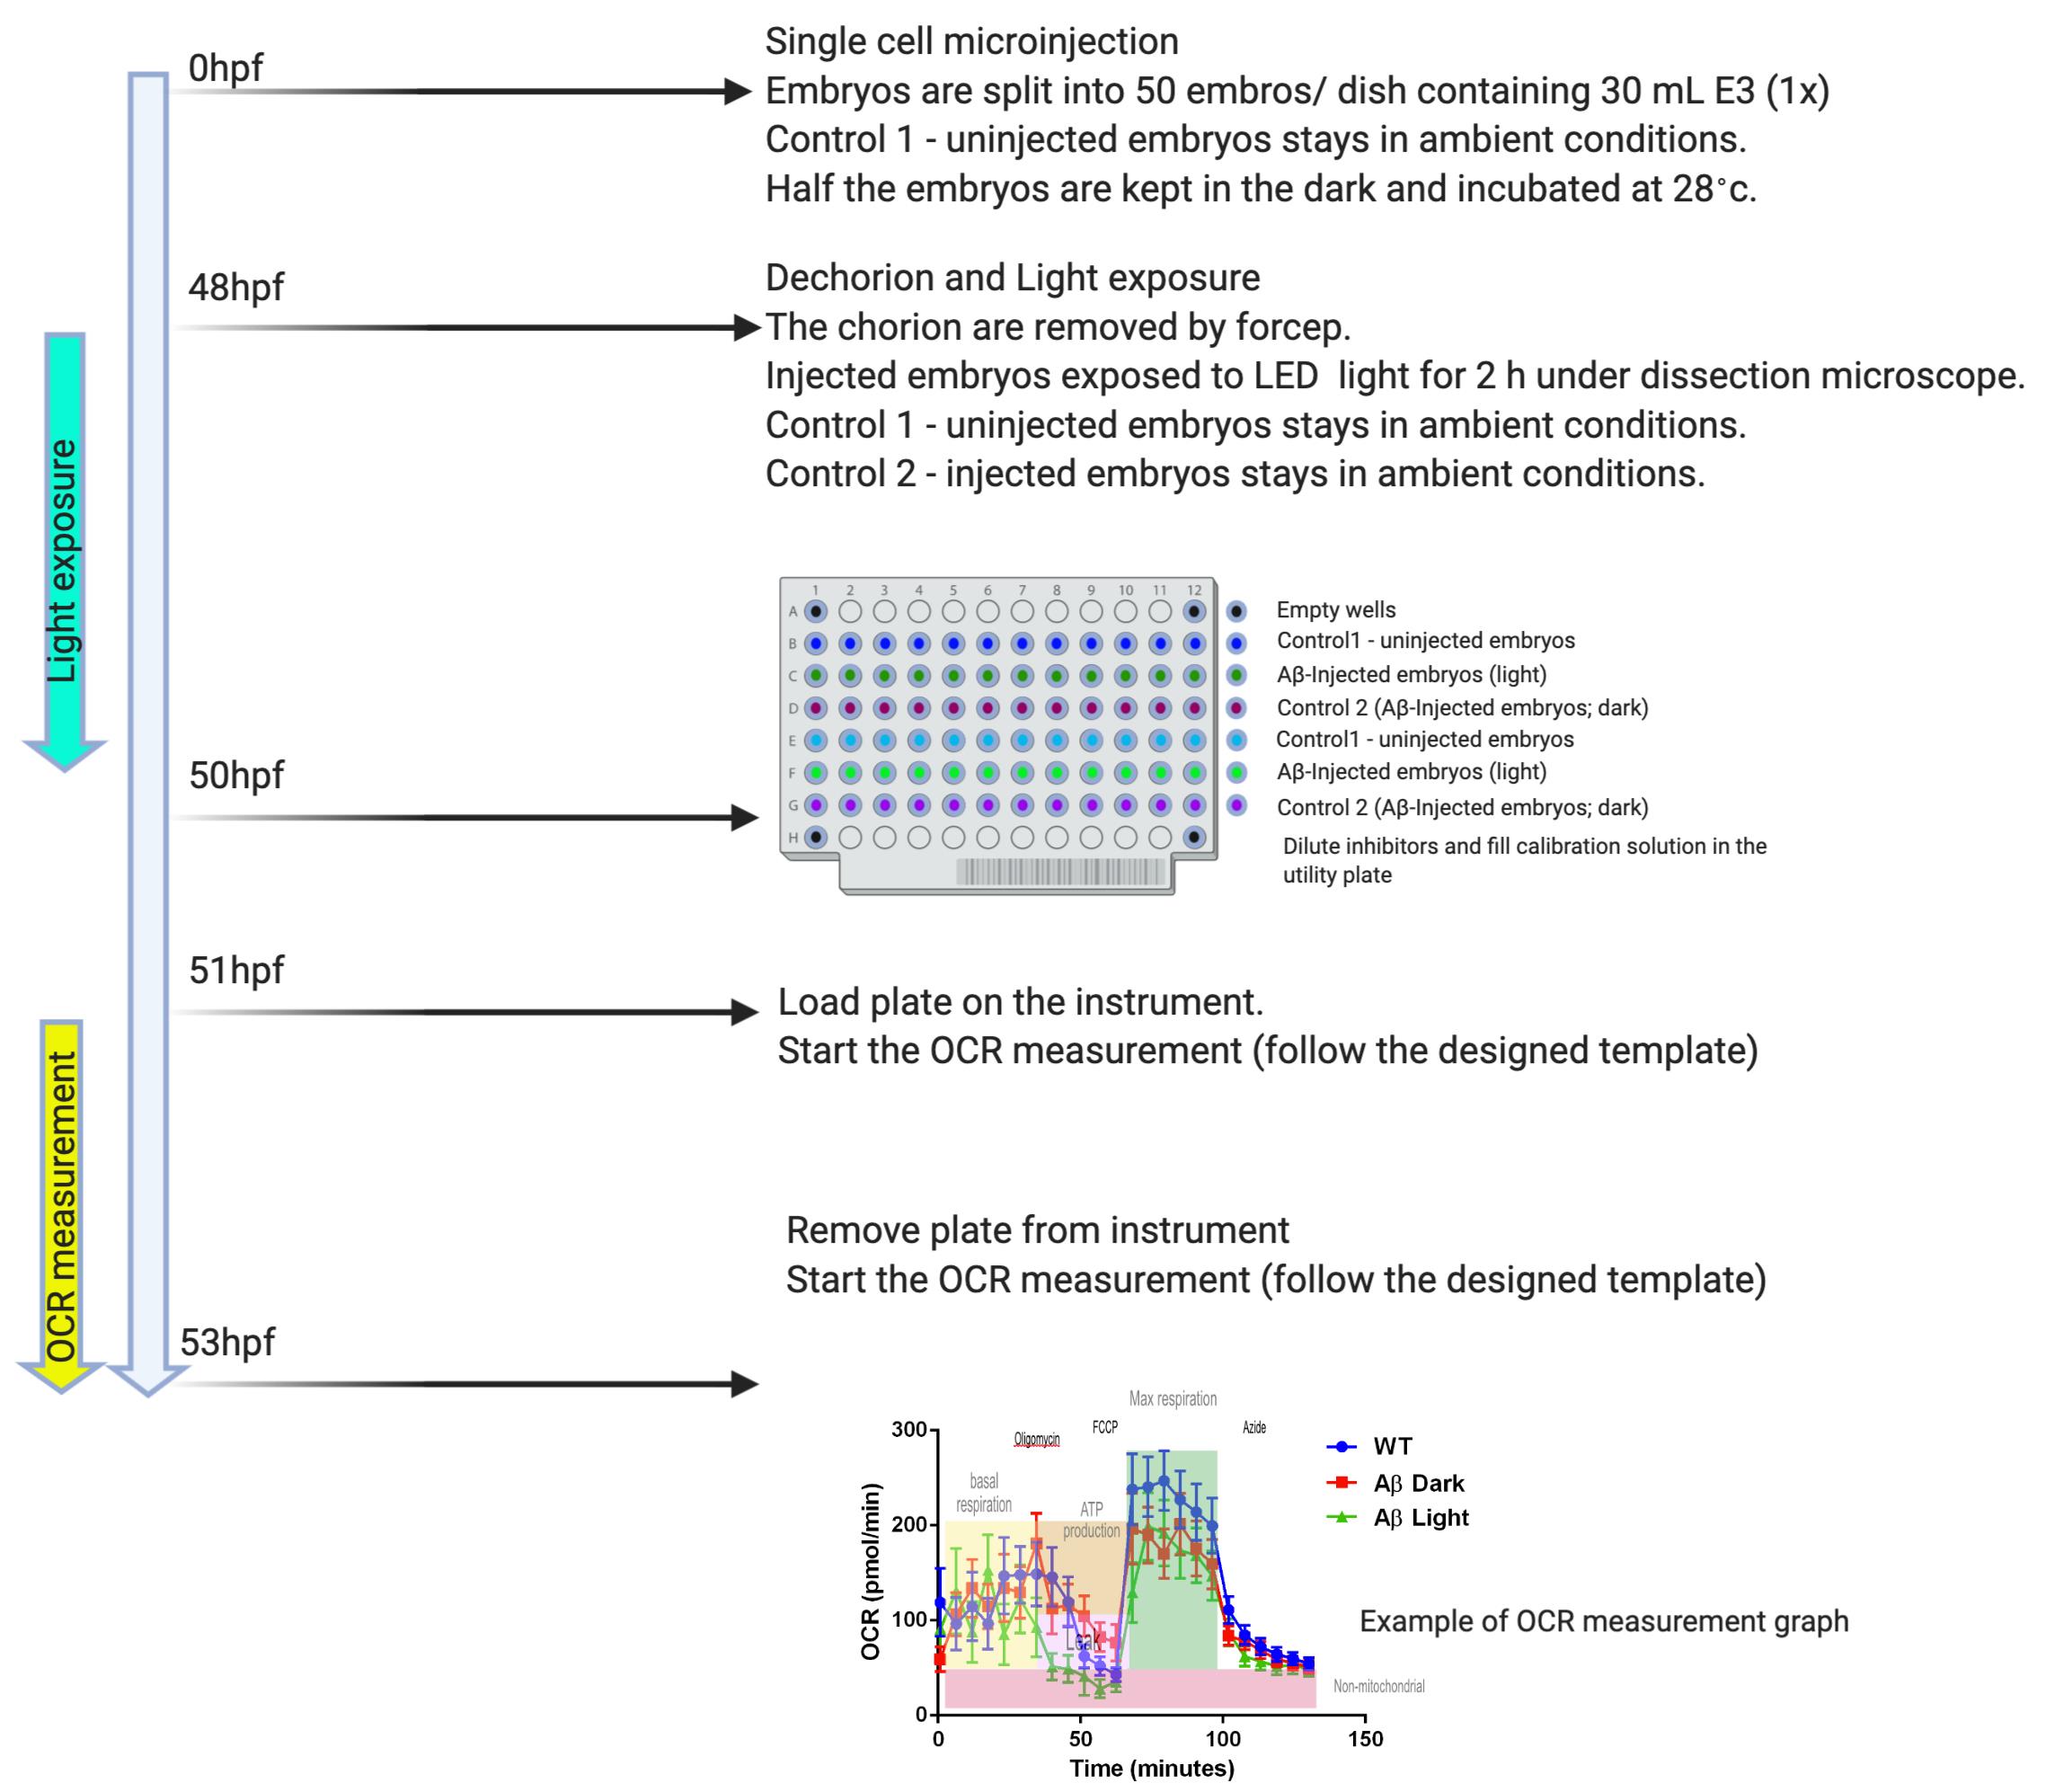
Figure 3. Schematic of metabolic flux assay on transiently expressing Aβ-CRY2-mCherry embryos
D. rerio Adenosine triphosphate (ATP) assay
Use the remaining embryos from (Procedure C) for ATP assay. Or repeat Procedure C to generate more embryos.
Pool five 48 h embryos in 1.5 ml Micro tubes and add 50 μl ice-cold 10% TCA buffer. For each condition make at least 8 such pools (n = 8).
Use a hand held micropestle homogenizer, to homogenize embryos on ice.
Centrifuge the homogenate at 4 °C at 10,000 RPM for 5 minutes.
Transfer the supernatant to a new tube and keep at -80 °C for use later, or use immediately.
Add 5 μl of sample supernatant or ATP standards into a white 96-well microtiter plate (Figure 4).
Measure ATP luminescence using BioTek cytation 3 plate reader preprogrammed to inject arsenite ATP buffer (150 μl/well) followed by firefly lantern extract (45 μl/well).
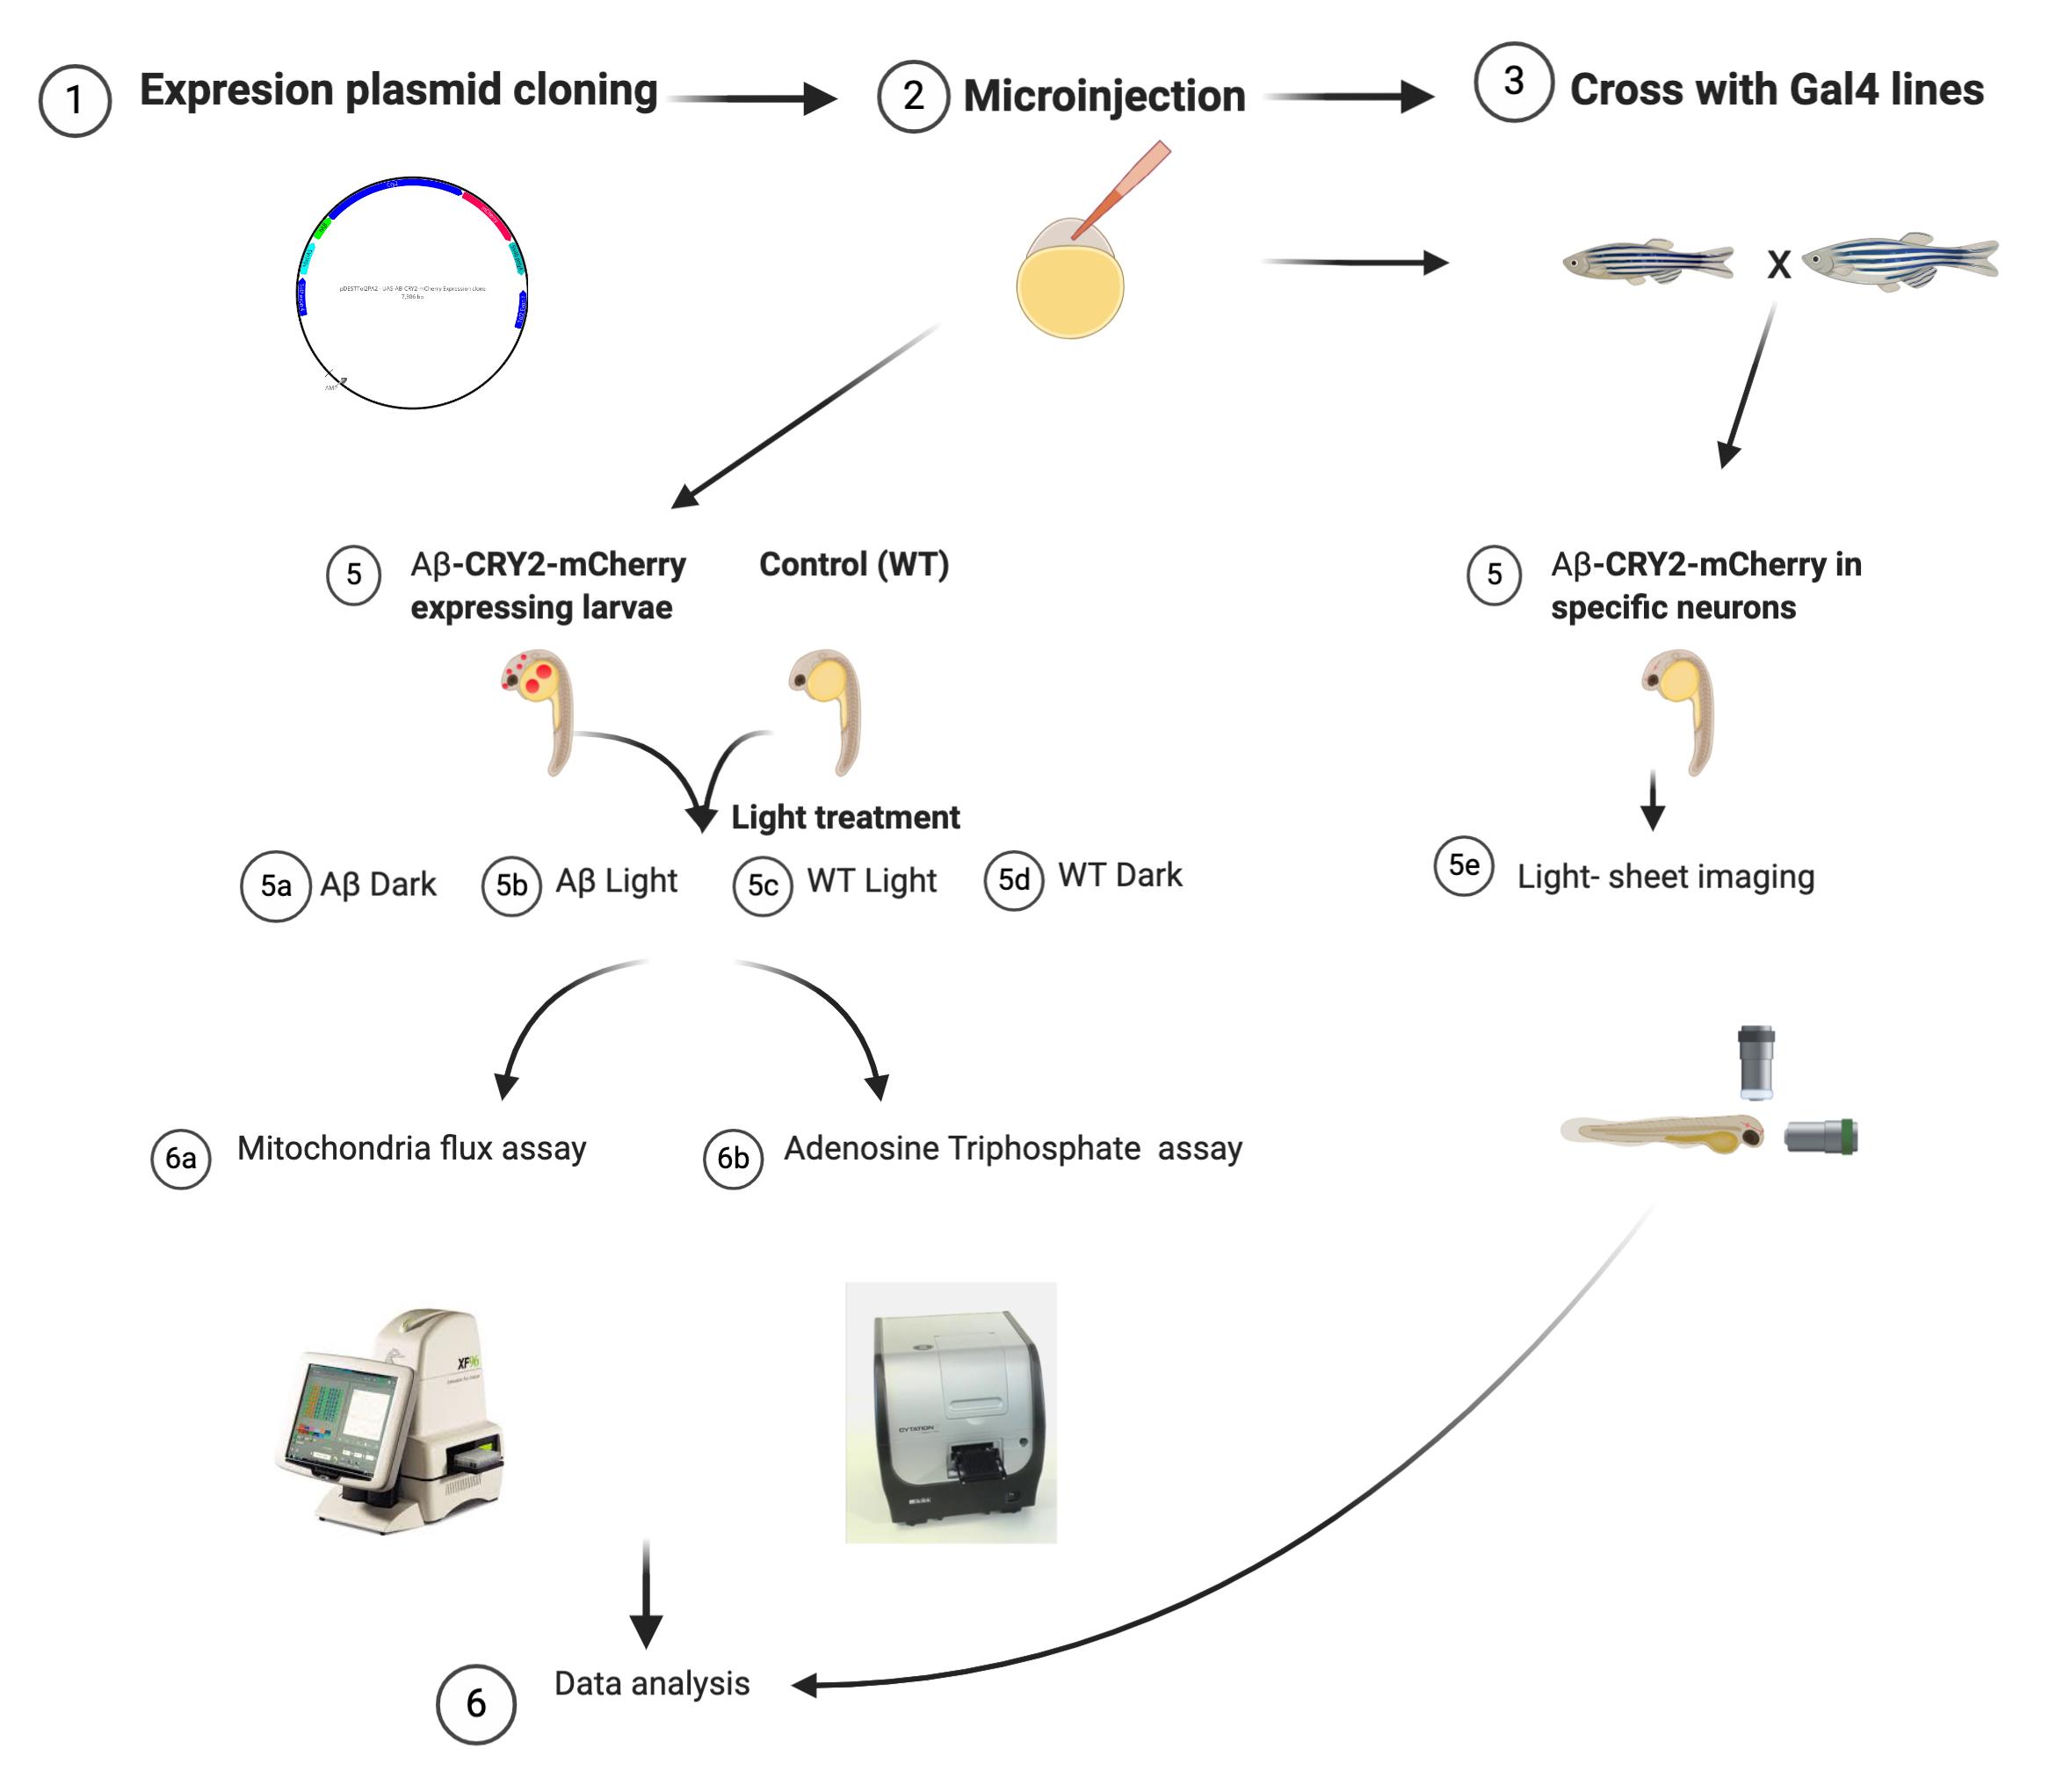
Figure 4. Schematic shows the summary of procedures using zebrafish
Fluorescence microscopy to visualize Aβ aggregates in C. elegans
Wash nematodes off the plates into an Eppendorf tube.
Add 1 mM Levamisole into the worm suspension.
Gently mix the worm suspension and place 20 μl of the worm suspension onto a glass slide containing 2% agarose [see Verbrugghe and Chan (2011) on how to make agarose pad].
Switch off ambient light and bring the slides for imaging using 561 nm and 488 nm laser.
Using 488 nm laser, select pharyngeal-GFP positive nematodes for the transgenic animals.
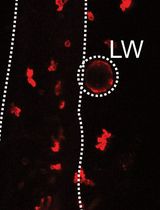
Using 561 nm laser, observe the A&Bgr; expression and aggregate levels.
Other assays used to confirm aggregation-induced deficits in C. elegans
Lifespan assay (He, 2011), mitochondrial metabolic flux assay (Ng and Gruber, 2019) and ATP assay (Schaffer et al., 2011) can be used to confirm A&Bgr; aggregation-induced deficits.
Data analysis
Light-sheet microscopy to image neural development during embryogenesis
Process the acquired images file in the ZEN 2014 SP software.
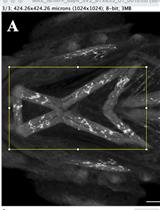
The embryo is likely to shift slightly during imaging. Hence, determine the z-stack section that includes the top of the embryo at every time point (ZT) (Figure 5). Thereafter, note the z-stack section (ZB) in the embryo that stays in focus throughout the time points after which the focus is lost (Figure 5 shows an example of the top, bottom and middle z-stack images for the control embryos which was used to subsequently generate Video 3 in the original research paper [Lim et al., 2020]). Create a subset file including the images from ZT to ZB.
If the embryo does not show any changes in development after a certain time point (T1), create a further subset from the start of imaging to T1.
Create a maximum intensity projection of the final subset file and adjust the display settings that best suit the image. Export the time series as a movie in the format of choice.
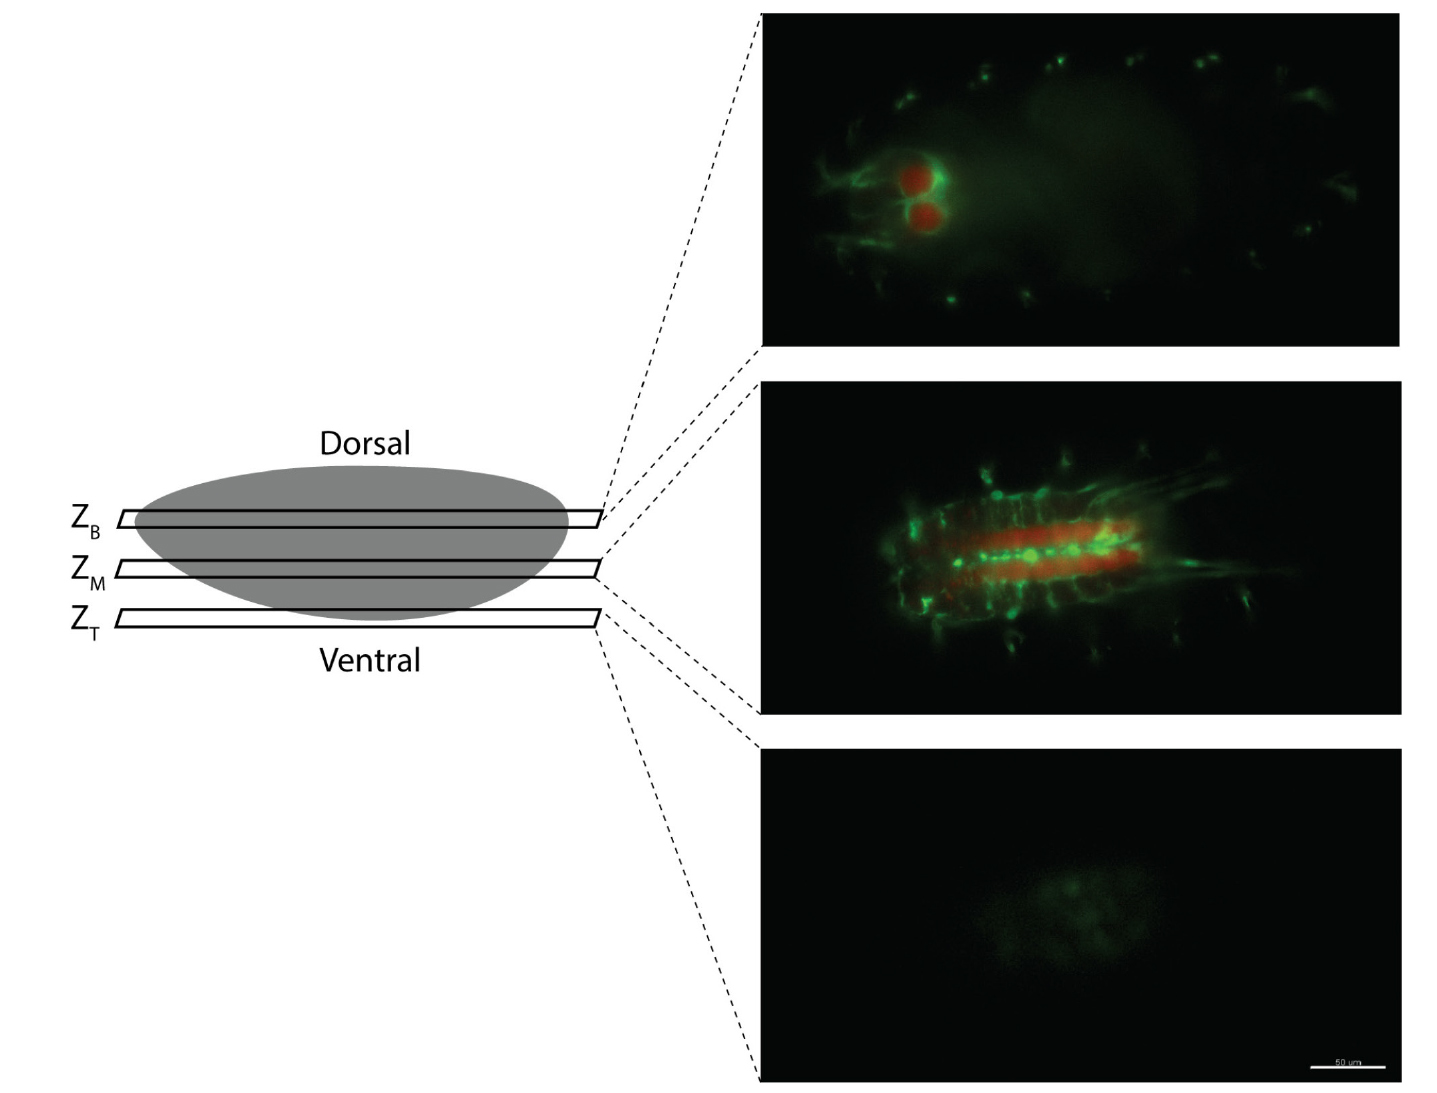
Figure 5. Annotation of the top (ZT) and bottom (ZB) z-stack of the embryo during post-processing of the data file to create a subset file. ZT is defined as the top of the embryo at every time point (ZT) and ZB is the z-stack at which the embryo is in focus throughout the time points after which the focus is lost. Scale bar shows 50 μm.
D. rerio Mitochondrial metabolic flux assay (Figure 4)
Use the Seahorse Wave Controller software, compute the following area under the curve (AUC):
AUC1 = oxygen consumption rate measurement 1 to 6 (pre-injection)
AUC2 = oxygen consumption rate measurement 7 to 12 (after oligomycin injection)AUC3 = oxygen consumption rate measurement 13 to 18 (after FCCP injection)
AUC4 = oxygen consumption rate measurement 19 to 24 (after sodium azide injection)Determine the respective respiration rate as follow:
Basal respiration = AUC1 – AUC4Proton leak = AUC2 – AUC4
ATP-linked respiration = AUC1 – AUC2
Maximum respiration = AUC3 – AUC4
Spare respiratory capacity = AUC3 – AUC1
Non-mitochondria respiration = AUC1 – AUC4Plot the individual respiration rate in bar graph and analyze the group mean using one-way ANOVA.
D. rerio ATP assay
Calculate ATP level for all samples using the standard curve constructed from the ATP standard.
Compute the mean ATP level for different conditions and analyze the data using one-way ANOVA.
Notes
For sample imaging in the Light-sheet Z.1 for D. melanogaster, the sample chamber heats up significantly due to the short time interval of 2.5 min. Hence, the room temperature was set to 18 °C to prevent over-heating of the water in the chamber that prevents development of the embryo. Alternatively, the water can be cooled by setting up a peristaltic pump attached to the sample chamber.
Recipes
Standard Fly food
6 g Bacto agar
114 g glucose
56 g cornmeal
25 g Brewer’s yeast
20 ml of 10% Nipagin in 1 L final volume
Grape juice agar plates
Prepare grape juice agar using FlyStuff Grape Agar Premix, For Embryo Collection (25 Packets/Unit) according to the manufacturer’s instructions and pour approximately 4-5 ml of agar per 60 mm Petri dish. Allow to solidify and store the plates at 4 °C.
Yeast paste
Mix yeast (Bruggeman Instant Dry Yeast Blue, 500 g) with a small amount of water in a plastic beaker to achieve a thick paste. The yeast paste can be kept in a beaker covered with aluminum foil at 4 °C.
1% low gelling temperature agarose in water aliquoted into 1.5 ml Eppendorf tubes
In a 50 ml microwave-safe glass, add 0.1 g of Agarose, low gelling temperature Type VII-A and add 10 ml of autoclaved distilled water
Microwave with intermittent mixing till the agarose just dissolves without boiling to prevent excessive loss of water
Once the agarose has dissolved completely, let the mixture cool slightly and aliquot approximately 1 ml of the 1% agarose into 1.5 ml Eppendorf tubes
Close the Eppendorf tubes after the agarose has solidified and store at room temperature
For mounting, melt a tube of 1% low gelling temperature agarose at 70 °C for half an hour in a heat block and then cool it to 37 °C, mix thoroughly by inverting before using for mounting
2% low gelling temperature agarose in water aliquoted into 1.5 ml Eppendorf tubes (for C. elegans imaging)
Same as above, but dissolve 0.2 g of agarose, low gelling temperature Type VII-A in 10 ml of autoclaved distilled water
60x E3 (embryo medium) stock solution (for D. rerio)
Dissolve 172 g NaCl, 7.6 g KCl, 29 g CaCl2·2H2O and 49 g MgSO4·7H2O in 10 L of Milli-Q water
Dilute 160 ml of 60x stock solution in distilled water to make up to 10 L of E3 (1x)
2 % low melting agarose
Dissolving 1 g of agarose powder in 100 ml E3 (1x)
Cook in microwave for 2 min at low power (for fish imaging)
25x Tricaine stock solution (for D. rerio)
Dissolving 400 mg Tricaine in 97.9 ml DD water
Adjust pH to 7 using Tris-HCl (1 M)
To use Tricaine for anesthesia, dilute stock solution by adding 96 ml E3 (1x) to 4 ml of 25x stock solution in a beaker
Diluted Tricaine should be disposed in activated charcoal
10% TCA buffer
Dissolve 1 g TCA powder in 10 ml distilled water
Arsenite ATP buffer
Mix 80 mM MgSO4·7H2O
10 mM KH2PO4
100 mM Na2HASO4·7H2O in 1:1:1 ratio
Acknowledgments
We are thankful for the funding provided by Ministry of Education Singapore AcRF grant IG17-LR005, IG17-BS101 and IG18-BS002 to JG, Yale-NUS College grant R-607-265-225-121 to ASM, AcRF grants IG17-LR006 and IG18-LR001 to NST.
Competing interests
We have no conflicts of interest to declare.
Ethics
Institutional biosafety and genetic manipulation guidelines of IMCB were followed for generation of transgenic zebrafish. Fish husbandry, rearing and maintenance were performed following approved protocols by Institutional Animal Care and Use Committee (IACUC) of the Biological Resource Center at A*STAR. Approved experimental protocols (IACUC 191501) were followed.
References
- Akitake, C. M., Macurak, M., Halpern, M. E. and Goll, M. G. (2011). Transgenerational analysis of transcriptional silencing in zebrafish. Dev Biol 352(2): 191-201.
- Bischof, J., Maeda, R. K., Hediger, M., Karch, F. and Basler, K. (2007). An optimized transgenesis system for Drosophila using germ-line-specific phiC31 integrases. Proc Natl Acad Sci U S A 104(9): 3312-3317.
- Brand, A. H. and Perrimon, N. (1993). Targeted gene expression as a means of altering cell fates and generating dominant phenotypes. Development 118(2): 401-415.
- Bugaj, L. J., Choksi, A. T., Mesuda, C. K., Kane, R. S. and Schaffer, D. V. (2013). Optogenetic protein clustering and signaling activation in mammalian cells. Nat Methods 10(3): 249-252.
- Bunnag, N., Tan, Q. H., Kaur, P., Ramamoorthy, A., Sung, I. C. H., Lusk, J. and Tolwinski, N. S. (2020). An Optogenetic Method to Study Signal Transduction in Intestinal Stem Cell Homeostasis. J Mol Biol 432(10): 3159-3176.
- Campos-Ortega, J. A. and Hartenstein, V. (1997). Stages of Drosophila Embryogenesis. In. The Embryonic Development of Drosophila melanogaster. Berlin, Heidelberg: Springer.
- Cummings, J., Lee, G., Ritter, A. and Zhong, K. (2018). Alzheimer's disease drug development pipeline. Alzheimers Dement(N Y) 4: 195-214.
- De-Paula, V. J., Radanovic, M., Diniz, B. S. and Forlenza, O. V. (2012). Alzheimer's disease. Subcell Biochem 65: 329-352.
- Fenno, L., Yizhar, O. and Deisseroth, K. (2011). The development and application of optogenetics. Annu Rev Neurosci 34: 389-412.
- Ferreira, S. T. and Klein, W. L. (2011). The Abeta oligomer hypothesis for synapse failure and memory loss in Alzheimer's disease. Neurobiol Learn Mem 96(4): 529-543.
- Fong, S., Teo, E., Ng, L. F., Chen, C. B., Lakshmanan, L. N., Tsoi, S. Y., Moore, P. K., Inoue, T., Halliwell, B. and Gruber, J. (2016). Energy crisis precedes global metabolic failure in a novel Caenorhabditis elegans Alzheimer Disease model. Sci Rep 6: 33781.
- Groth, A. C., Fish, M., Nusse, R. and Calos, M. P. (2004). Construction of transgenic Drosophila by using the site-specific integrase from phage phiC31. Genetics 166(4): 1775-1782.
- Hardy, J. A. and Higgins, G. A. (1992). Alzheimer's disease: the amyloid cascade hypothesis. Science 256(5054): 184-185.
- Hartenstein, V., (1993). Atlas of Drosophila development. Plainview, N.Y.: Cold Spring Harbor Laboratory Press.
- Hawkes, N., (2016). Sixty seconds on... solanezumab. BMJ 355: i6389.
- He, F., (2011). Lifespan Assay. Bio-101 1 (7): e57.
- Hong, E., Santhakumar, K., Akitake, C. A., Ahn, S. J., Thisse, C., Thisse, B., Wyart, C., Mangin, J. M. and Halpern, M. E. (2013). Cholinergic left-right asymmetry in the habenulo-interpeduncular pathway. Proc Natl Acad Sci U S A 110(52): 21171-21176.
- Kaur, P., Saunders, T. E. and Tolwinski, N. S. (2017). Coupling optogenetics and light-sheet microscopy, a method to study Wnt signaling during embryogenesis. Sci Rep 7(1): 16636.
- Kawakami, K., (2007). Tol2: a versatile gene transfer vector in vertebrates. Genome Biol 8 Suppl 1: S7.
- Kennedy, M. J., Hughes, R. M., Peteya, L. A., Schwartz, J. W., Ehlers, M. D. and Tucker, C. L. (2010). Rapid blue-light-mediated induction of protein interactions in living cells. Nat Methods 7(12): 973-975.
- Kumar, A. and Singh, A. (2015). A review on Alzheimer's disease pathophysiology and its management: an update. Pharmacol Rep 67(2): 195-203.
- LaFerla, F. M., Green, K. N. and Oddo, S. (2007). Intracellular amyloid-beta in Alzheimer's disease. Nat Rev Neurosci 8(7): 499-509.
- Lim, C. H., Kaur, P., Teo, E., Lam, V. Y. M., Zhu, F., Kibat, C., Gruber, J., Mathuru, A. S. and Tolwinski, N. S. (2020). Application of optogenetic Amyloid-beta distinguishes between metabolic and physical damages in neurodegeneration. Elife 9: e52589.
- Lim, C. H. and Mathuru, A. S. (2017). Modeling Alzheimer's and Other Age Related Human Diseases in Embryonic Systems. J Dev Biol .1. 6(1). doi:10.3390/jdb6010001.
- Lin, C. C. and Potter, C. J. (2016). Editing Transgenic DNA Components by Inducible Gene Replacement in Drosophila melanogaster. Genetics 203(4): 1613-1628.
- Markstein, M., Pitsouli, C., Villalta, C., Celniker, S. E. and Perrimon, N. (2008). Exploiting position effects and the gypsy retrovirus insulator to engineer precisely expressed transgenes. Nat Genet 40(4): 476-483.
- Mas, P., Devlin, P. F., Panda, S. and Kay, S. A. (2000). Functional interaction of phytochrome B and cryptochrome. Nature 408(6809): 207-211.
- Moglich, A. and Moffat, K. (2010). Engineered photoreceptors as novel optogenetic tools. Photochem Photobiol Sci 9(10): 1286-1300.
- Ng, L. F. and Gruber, J. (2019). Measurement of Respiration Rate in Live Caenorhabditis elegans. Bio-protocol 9(10): e3243.
- Schaffer, S., Gruber, J., Ng, L. F., Fong, S., Wong, Y. T., Tang, S. Y. and Halliwell, B. (2011). The effect of dichloroacetate on health- and lifespan in C. elegans. Biogerontology 12(3): 195-209.
- Stiernagle, T., (2006). Maintenance of C. elegans. WormBook, 1-11. doi:10.1895/wormbook.1.101.1
- Verbrugghe, K. J. and Chan, R. C. (2011). Imaging C. elegans embryos using an epifluorescent microscope and open source software. J Vis Exp (49). doi:10.3791/2625.
- Zhang, Y. W., Thompson, R., Zhang, H. and Xu, H. (2011). APP processing in Alzheimer's disease. Mol Brain 4: 3. doi:10.1186/1756-6606-4-3.
文章信息
版权信息
![]() Kaur et al. This article is distributed under the terms of the Creative Commons Attribution License (CC BY 4.0).
Kaur et al. This article is distributed under the terms of the Creative Commons Attribution License (CC BY 4.0).
如何引用
Readers should cite both the Bio-protocol article and the original research article where this protocol was used:
- Kaur, P., Kibat, C., Teo, E., Gruber, J., Mathuru, A. and Tolwinski, N. (2020). Use of Optogenetic Amyloid-β to Monitor Protein Aggregation in Drosophila melanogaster, Danio rerio and Caenorhabditis elegans. Bio-protocol 10(23): e3856. DOI: 10.21769/BioProtoc.3856.
- Lim, C. H., Kaur, P., Teo, E., Lam, V. Y. M., Zhu, F., Kibat, C., Gruber, J., Mathuru, A. S. and Tolwinski, N. S. (2020). Application of optogenetic Amyloid-beta distinguishes between metabolic and physical damages in neurodegeneration. Elife 9: e52589.
分类
神经科学 > 神经系统疾病 > 神经退行性病变
发育生物学 > 细胞生长和命运决定 > 退化
细胞生物学 > 细胞成像 > 共聚焦显微镜
您对这篇实验方法有问题吗?
在此处发布您的问题,我们将邀请本文作者来回答。同时,我们会将您的问题发布到Bio-protocol Exchange,以便寻求社区成员的帮助。