

Simple Time-lapse Imaging for Quantifying the Hydrostatic Production of Oxygenic Photogranules
用于定量含氧光颗粒静水压力的简单时差成像


发布: 2020年10月05日第10卷第19期 DOI: 10.21769/BioProtoc.3784 浏览次数: 3543
评审: Dennis J NürnbergJoseph Gitau GikonyoAnonymous reviewer(s)
参见作者原研究论文
The authors used this protocol in:

Dec 2017
Advertisement


Abstract
Oxygenic photogranules (OPGs) are dense, three-dimensional aggregates containing a syntrophic, light-driven microbial community. Their temporal and spatial development interests microbial ecologists working at the bioprocess engineering interface, as this knowledge can be used to optimize biotechnological applications, such as wastewater treatment and biomass valorization. The method presented here enables the high-throughput quantification of photogranulation. OPGs are produced from a loose sludge-like microbial matrix in hydrostatic batch cultures exposed to light. This matrix transforms into a consolidated, roughly spherical aggregate over time. Photogranulation is quantified by time-lapse imaging coupled to automated image analysis. This allows studying the development of many OPGs simultaneously and in a fully automated way to systematically test what factors drive photogranulation. The protocol can also be used to quantify other types of (a)biotic aggregation.
Keywords: Oxygenic photogranules (含氧感光颗粒)Background
OPGs are dense, roughly spherical aggregates with diameters of several millimeters containing a syntrophic community of heterotrophic and phototrophic microorganisms (Milferstedt et al., 2017). Microbial ecologists study photogranulation to understand what factors drive the formation of the three-dimensional (3D) structure. This knowledge can be applied to steer ecosystem function towards a desired function for biotechnological processes, such as wastewater treatment and the production of value-added products (Abouhend et al., 2018; Quijano et al., 2017). OPGs can be produced from a sludge-like microbial matrix, i.e., activated sludge from the aeration basin of a wastewater treatment plant (Milferstedt et al., 2017; Park and Dolan, 2015). The transformation of this sludge takes place in closed, unagitated vials exposed to light. Over the course of several weeks, the sludge bed compacts (i.e., reduces in height) and contracts (i.e., reduces in diameter) and transforms into one consolidated, 3D aggregate per vial (Figure 1A). Experimental images are automatically acquired through the bottom of vials at a pre-set interval (Figure 1B) of multiple replicates simultaneously. Images are treated in ImageJ (Schneider et al., 2012), extending a macro developed for the quantification of naturally occurring OPGs called cryoconite granules (Irvine-Fynn et al., 2010). Dynamics of biomass contraction is calculated and plotted in the software environment R (R Core Team, 2019). This protocol enables testing photogranulation in a large number of repetitions, e.g., using different sludge sources or environmental conditions to advance the understanding of photogranulation. The protocol can also be used to quantify other types of (a)biotic aggregation.
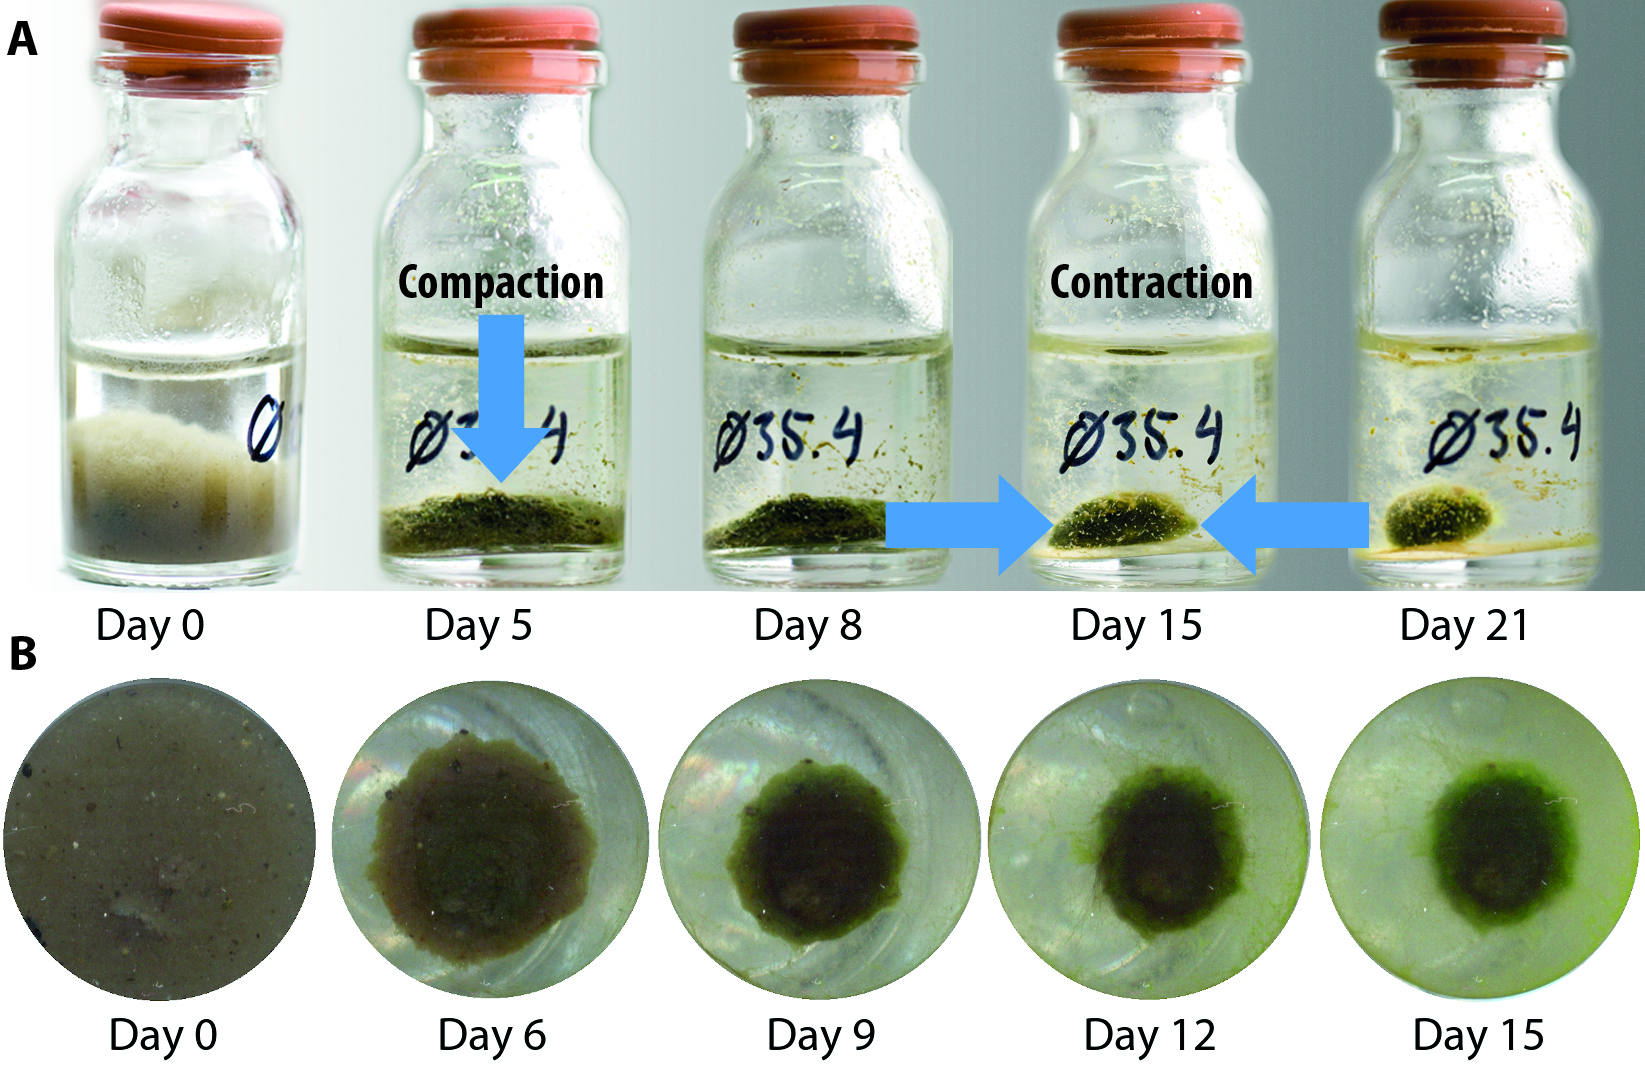
Figure 1. Typical course of photogranulation, including compaction and contraction. Note the displayed images are for illustration purposes and were not obtained with the protocol presented here. A. Temporal progression of the transformation of loose activated sludge into a consolidated OPG in a 10 ml serum bottle with an outer diameter of 24 mm (adapted from Milferstedt et al., 2017). Arrows illustrate the terms compaction and contraction; B. Temporal progression of biomass contraction seen through the bottom of one well of a 24-well microplate with an outer diameter of 16 mm.
Materials and Reagents
- Fresh activated sludge from the aeration basin of a wastewater treatment plant
- 0.5-5 ml pipette with tips (Thermo Fisher Scientific, FinnpipetteTM F1, catalog number: 4641110N ; 5 ml FinntipTM, catalog number: 9402030 )
- Grid for aligning and spacing vials on scanner surface. Custom-made dark gray metal grid measuring 30.4 × 22.2 × 0.2 cm (L × W × thickness) (Figures 2A-2B)
The grid should be sufficiently low so that it does not shadow the biomass from the side, e.g., it should not be much higher than the thickness of the vial bottom (Figure 3A-3B). The required cut-out where to place the vials can be produced using computer numerical control (CNC) metal milling or 3D printing. You can also make the grid out of other materials, such as paper. - Light-impermeable box for covering distance between vials and light source to prevent loss of light and uncontrolled illumination. Home-made cardboard box of the approximate dimensions of 65 × 35 × 65 cm (L × W × H), enclosing the scanner and the lighting device.
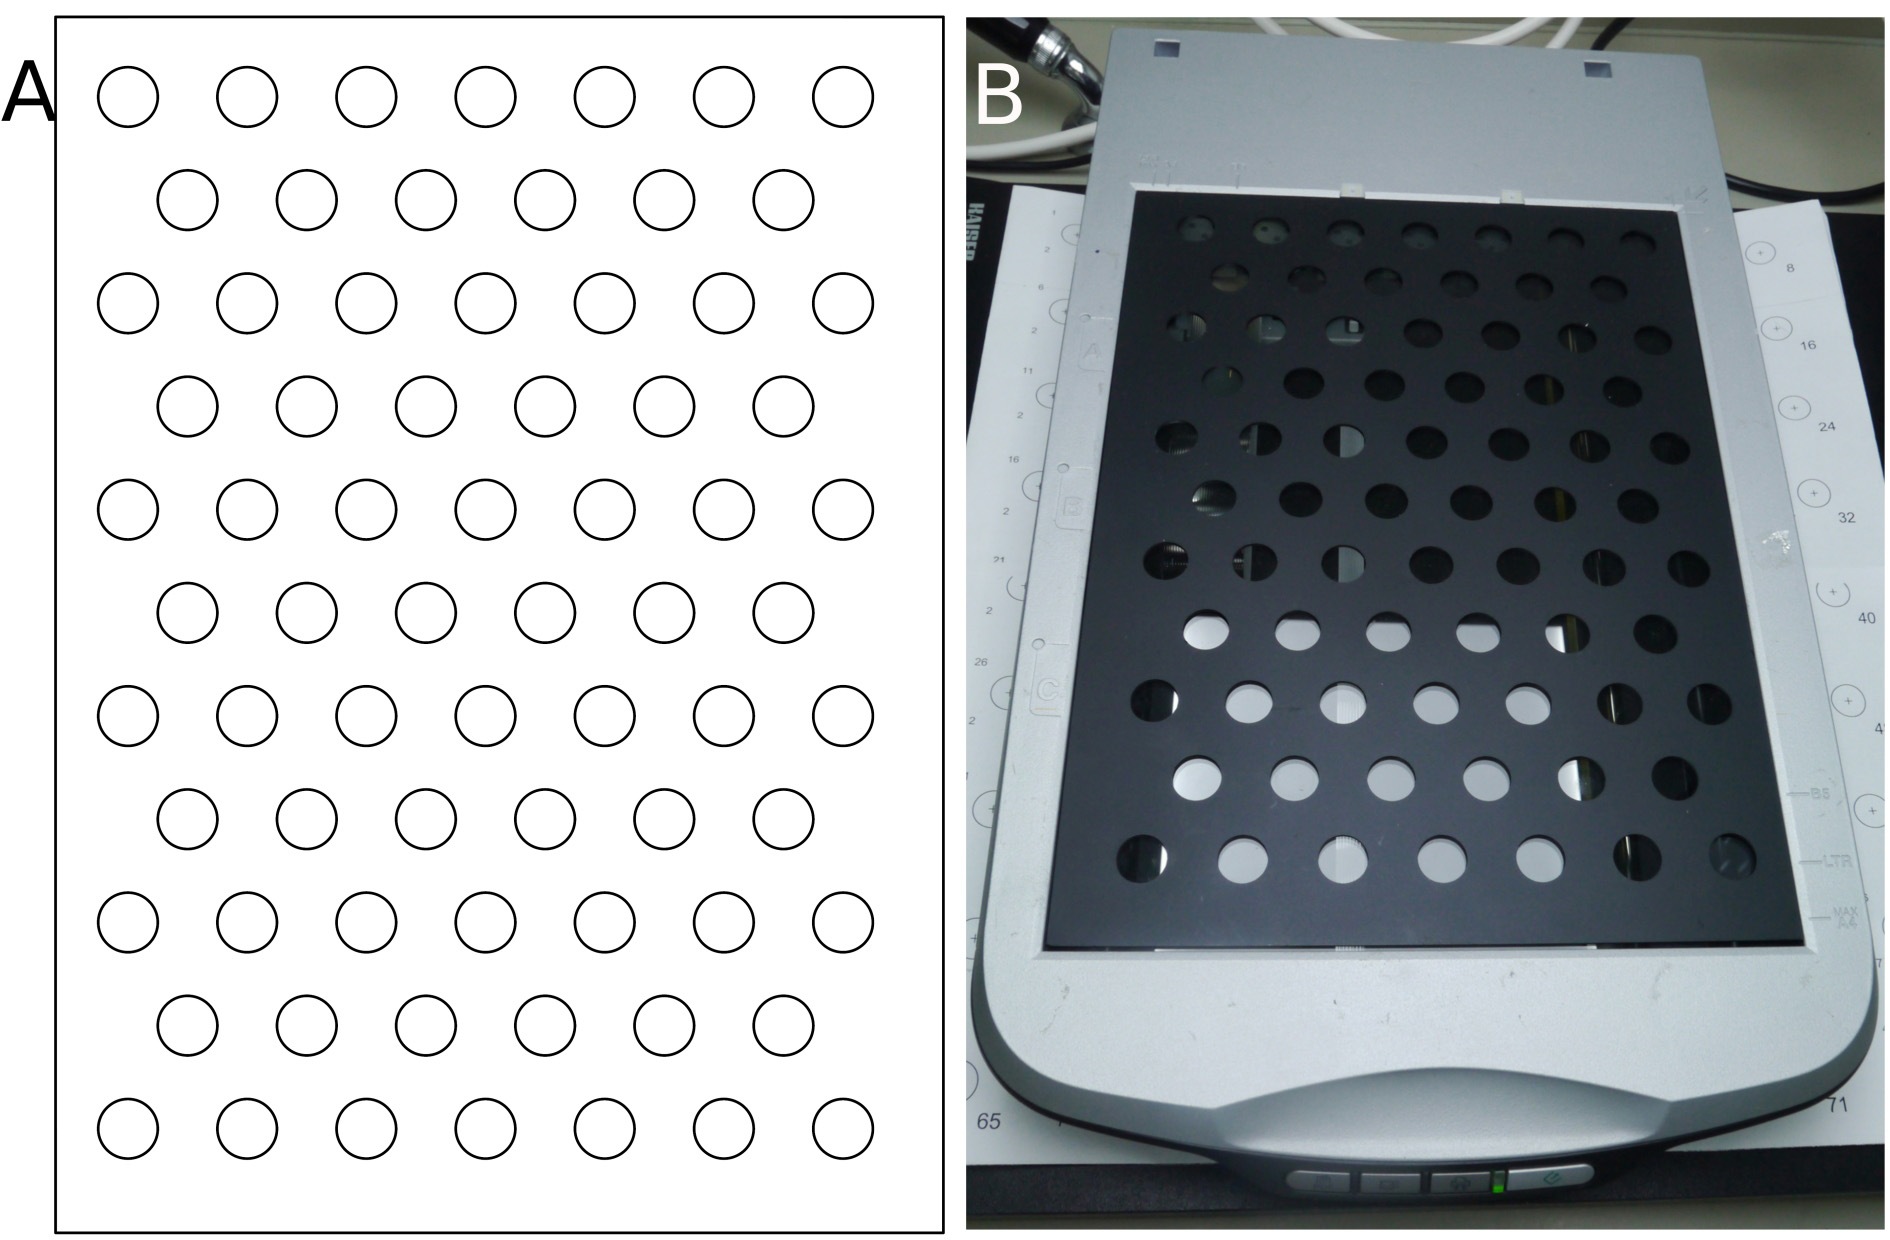
Figure 2. Grid. A. Grid design; B. Custom-made dark gray metal grid positioned on top of the scanner.
Equipment
- 1 L break resistant bottle with a wide neck for sampling (Fisher Scientific, Gosselin, catalog number: 11728643 )
- 2 L polypropylene beaker for mixing (Thermo Fisher Scientific, Nalgene, catalog number: 1201-2000 )
- 4 ml clear glass vials measuring 15 mm × 45 mm × 8 mm (outer diameter × height × inner diameter) with a screw top for cultivations (Sigma-Aldrich, Supelco, catalog number: 27111) (Figure 3A)
A clear, smooth and flat bottom is critical for the success of this experiment (Figure 3C). We used glass vials here, and successfully used polystyrene vials previously. - Screw caps with a contrasting color to the biomass for image treatment (Agilent Technologies, catalog number: 5183-4305 )
- Magnetic stirrer and stir bar (Bioblock Scientific, AM AMC BBS 3000 ) to homogenize activated sludge so that differences in sample composition between vials are minimized
- Holding device for mounting a light source, e.g., copy stand with camera arm (Kaiser, RS1, RA1, catalog number: 205510 )
- Flat light source, e.g., light emitting diode (LED) panel measuring 59.5 × 59.5 (cropped to 30) × 1.06 cm (L × W × H) (Rexel, LEDVANCE, PANEL LED 600, 40W, 6500K, 4000 lm, catalog number: 4058075000582 )
We used cool white light (6,500 K) for this experiment, but other light temperatures were also successfully tested (e.g., 5,600 and 6,000 K) - Photoactive synthetically radiation (PAR) quantum light sensor and display meter system (Skye Instruments Ltd, SKP 215/S 39520 , SKP 200 39521 )
- Desktop scanner (Epson, Perfection V500 Photo, model: J251A)
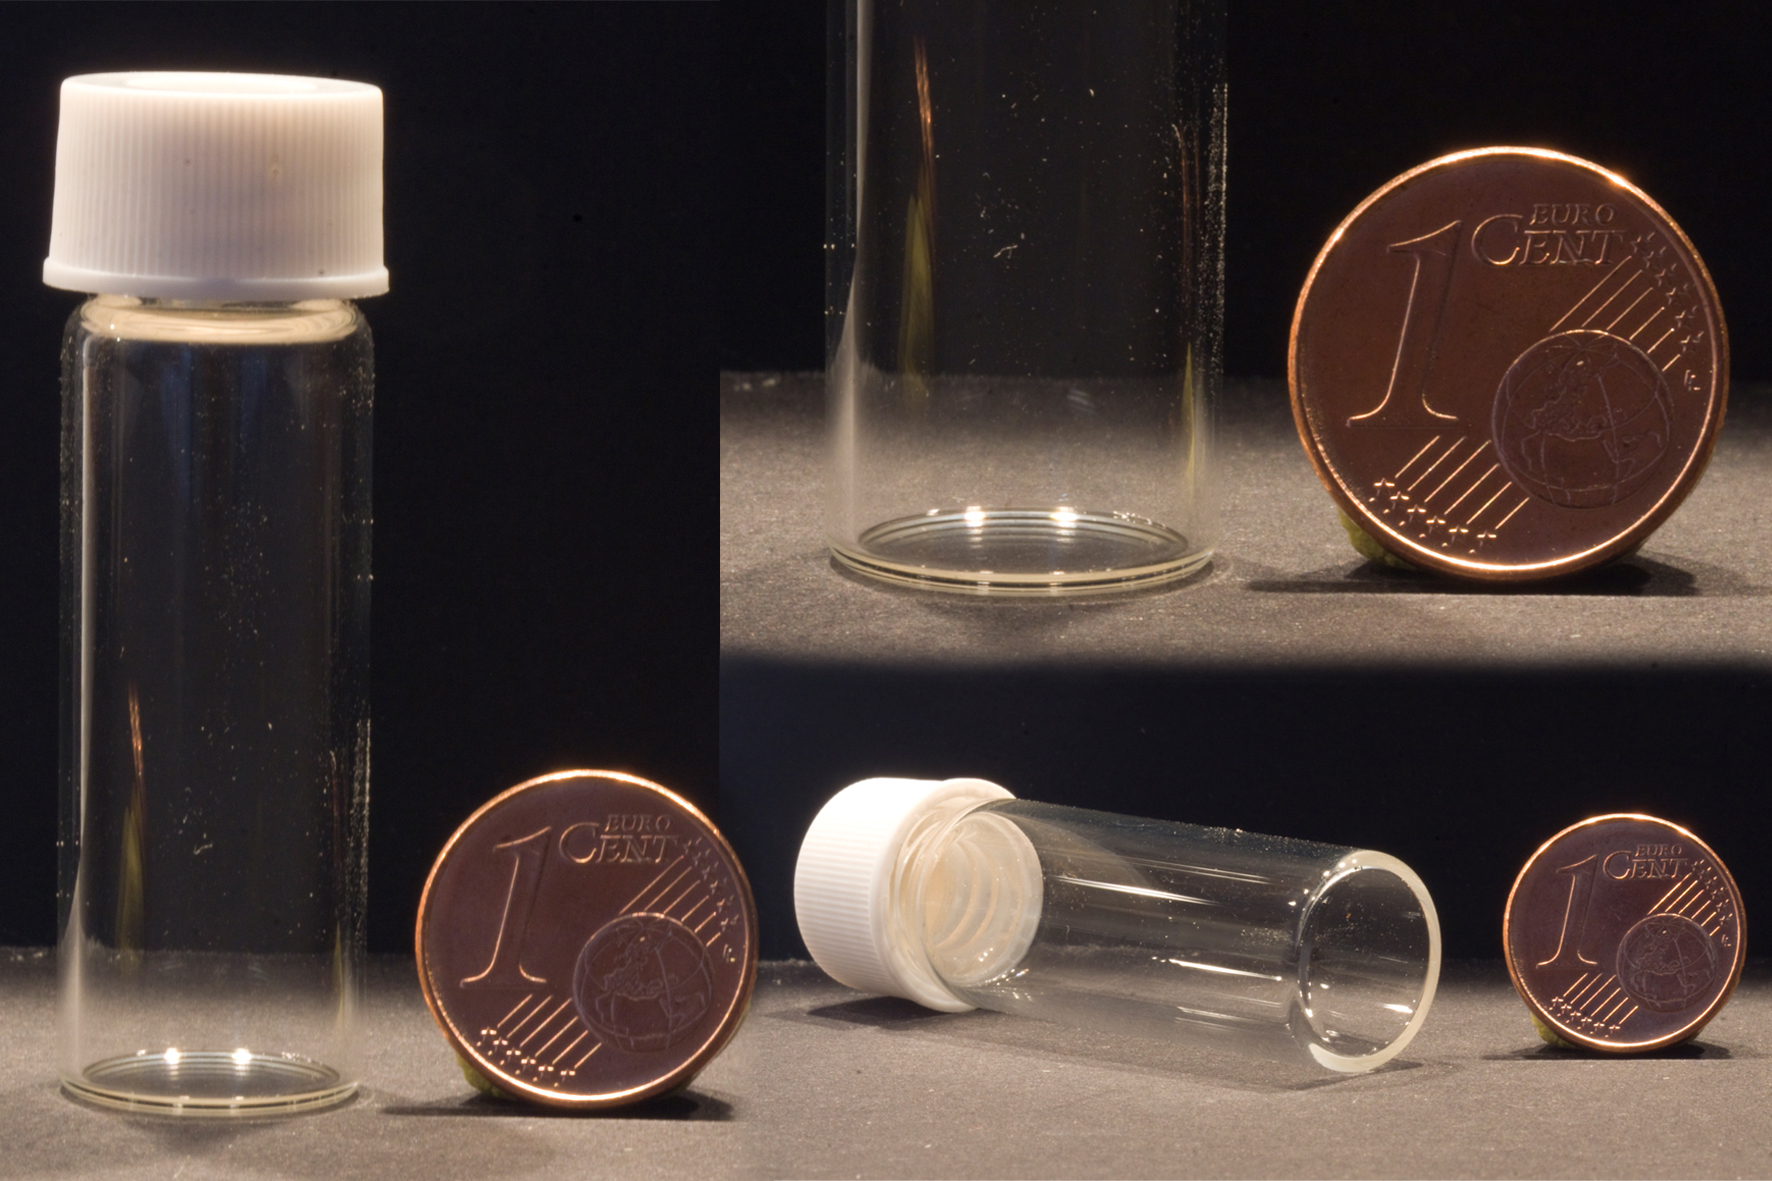
Figure 3. Vials. A. Glass vial with screw cap; B. Vial bottom thickness; C. Clear, smooth and flat vial bottom.
Software
- Scanner driver allowing time-lapse acquisition of images using a desktop scanner, e.g., VueScan version 9.5.51 (Hamrick Software, https://www.hamrick.com/)
- Tool to read, write and edit meta information in batches of images, e.g., ExifTool version 11.78 (Phil Harvey, https://exiftool.org/)
- ImageJ version 1.52a (image processing program) (National Insitutes of Health (NIH), https://imagej.nih.gov/ij/) (Schneider et al., 2012)
MorphoLibJ plugin to ImageJ version 1.4.0 (collection of mathematical morphology methods and plugins) (INRA-IJPB Modeling and Digital Imaging lab, https://imagej.net/MorphoLibJ) (Legland et al., 2016). - R version 3.6.0 (software environment for statistical computing and graphics) (R Core Team, https://www.r-project.org/) (R Core Team, 2019)
exiftoolr package version 0.1.3 (O’Brien, 2020)
ggplot2 package version 3.2.0 (Wickham, 2016)
plyr package version 1.8.4 (Wickham, 2011)
readr package version 1.3.1 (Wickham et al., 2018)
Procedure
文章信息
版权信息
© 2020 The Authors; exclusive licensee Bio-protocol LLC.
如何引用
Joosten, E. D., Hamelin, J. and Milferstedt, K. (2020). Simple Time-lapse Imaging for Quantifying the Hydrostatic Production of Oxygenic Photogranules. Bio-protocol 10(19): e3784. DOI: 10.21769/BioProtoc.3784.
分类
微生物学 > 微生物生物膜 > 生物膜培养
生物科学 > 微生物学 > 微生物群落
细胞生物学 > 细胞成像 > 活细胞成像
您对这篇实验方法有问题吗?
在此处发布您的问题,我们将邀请本文作者来回答。同时,我们会将您的问题发布到Bio-protocol Exchange,以便寻求社区成员的帮助。