

An in vitro DNA Sensor-based Assay to Measure Receptor-specific Adhesion Forces of Eukaryotic Cells and Pathogens
基于DNA传感器的真核细胞与病原体受体特异性粘附力的体外检测
(*contributed equally to this work) 发布: 2020年09月05日第10卷第17期 DOI: 10.21769/BioProtoc.3733 浏览次数: 5851
评审: Amberley D. StephensYINNIAN FENGVikash Verma
参见作者原研究论文
The authors used this protocol in:

Jan 2020
Advertisement


Abstract
Motility of eukaryotic cells or pathogens within tissues is mediated by the turnover of specific interactions with other cells or with the extracellular matrix. Biophysical characterization of these ligand-receptor adhesions helps to unravel the molecular mechanisms driving migration. Traction force microscopy or optical tweezers are typically used to measure the cellular forces exerted by cells on a substrate. However, the spatial resolution of traction force microscopy is limited to ~2 µm and performing experiments with optical traps is very time-consuming.
Here we present the production of biomimetic surfaces that enable specific cell adhesion via synthetic ligands and at the same time monitor the transmitted forces by using molecular tension sensors. The ligands were coupled to double-stranded DNA probes with defined force thresholds for DNA unzipping. Receptor-mediated forces in the pN range are thereby semi-quantitatively converted into fluorescence signals, which can be detected by standard fluorescence microscopy at the resolution limit (~0.2 µm).
The modular design of the assay allows to vary the presented ligands and the mechanical strength of the DNA probes, which provides a number of possibilities to probe the adhesion of different eukaryotic cell types and pathogens and is exemplified here with osteosarcoma cells and Plasmodium berghei Sporozoites.
Background
Motile cells and pathogens interact in many different ways with their environment (Parsons et al., 2010; Nan, 2017; Muthinja et al., 2018). For example, transmembrane receptors anchor single cells in their environment and allow them to interact with other cells (Hynes, 1992). Integrins, which are the main class of receptors connecting cells to the extracellular matrix, transmit forces in a bidirectional manner (Schoen et al., 2013). On the one hand, extracellular mechanical signals are transduced to the cytosol, where they trigger signaling cascades and thereby control various cellular functions like proliferation, differentiation and migration (Wang et al., 1993; Janmey and Miller, 2011; Totaro et al., 2017). On the other hand, forces generated by the cytoskeleton can be applied to the extracellular environment, causing tissue shape changes and modulate cellular motility in specialized cells (Iskratsch et al., 2014).
To test for integrin-specific adhesion of cells, here, we first describe a method “option I” to prepare substrates presenting cyclic Arginin-Glycin-Aspartic acid (cRGD) ligands while non-specific surface interactions being prevented by a polyethylene glycol (PEG)-based passivation layer (Figure 1A). Of note, this method can be easily adopted to other receptors by varying the ligand.
To characterize the different aspects of cellular force transmission like absolute tension values, direction or the spatiotemporal distribution of forces several methods exist, which are based on the deformation of hydrogels, micropillars or unfolding of molecules, which differ in their spatial resolution and force range (Polacheck and Chen, 2016). One of the latest approaches visualizes traction forces exerted on single ligands via fluorescent DNA-based tension sensors (Wang and Ha, 2013; Blakely et al., 2014; Zhang et al., 2014). These double-stranded (ds) DNA or hairpin (particularly self-annealing single stranded (ss) DNA structures) sensors are immobilized on an in vitro surface and carry a ligand (e.g., cRGD) that enables for receptor (integrin)-specific cell interactions. Upon force, the dsDNA regions can be unfolded, which is detected with a fluorescent sensor (Figure 1B). In combination with standard wide-field or total internal reflection microscopy the spatiotemporal distribution of forces can be determined at high resolution, which is only limited by the optical resolution (~0.2 µm). The mechanical stability of dsDNA depends on its length and the GC content (Zhang et al., 2015). The force F1/2 that is required to unfold 50% of the DNA sensors, has been calibrated in previous single-molecule studies between ~4-60 pN for varying DNA sequences (Wang and Ha, 2013; Zhang et al., 2014).
The herein presented method “option II” builds on DNA hairpins, which allow to quantify single-molecular, force transmission in the range of 4-19 pN (Zhang et al., 2014; Liu et al., 2016). We modified the DNA strands to enable coupling of various ligands in a modular manner depending on the receptors of interest. In the closed configuration, the fluorescent tag is in close proximity to a quencher and thus dark. Above a specific threshold force the DNA-hairpins unzip and elongate, which lowers the quenching efficiency and gives rise to a digital ON/OFF signal (Figure 1B) (Woodside et al., 2006). They can refold if the force no longer persists (Bonnet et al., 1998; Woodside et al., 2006), which is accompanied by a decrease in fluorescence. This is especially important for the characterization of cells with high turnover of adhesion formations like motile pathogens. Here, DNA hairpin sensors were immobilized via gold nanoparticles, which serve as additional fluorescence quenchers. This reduces the background signals induced by thermodynamic fluctuations as well as the photobleaching in comparison to other sensor surfaces (Lang et al., 2004; Liu et al., 2016). If the range of forces a certain receptor can transmit is not previously known, it is advisable to start with the lowest force probe as it quantitively detects forces above its threshold. Next, the assay can be expanded by multiplexing sensors with different force thresholds and distinct fluorescent dyes to obtain semi-quantitative information on the distribution of cellular forces (Zhang et al., 2014).
Finally, we show how to combine substrate specific adhesion as established in “option I” with the molecular tension sensors “option II” allowing for traction measurements while assuring proper cell adhesion to the surface. This method “option III” can prevent frequent detaching of small and motile cells like Plasmodium sporozoites, even if they show low binding affinities for the ligands coupled to the force sensors.
By immobilizing the molecular tension sensors on such adaptable substrates, they can be used in a wide range of biophysical studies of cell adhesion to extracellular ligands. We recently employed molecular tension sensors to study the specific adhesion between pathogenic agents like viral particles and mammalian cells (Wiegand et al., 2020). Here we provide a protocol to study the interaction of different cell types, including Plasmodium sporozoites, with specific matrix ligands. The rapid movement of the Malaria parasites is a crucial part in the infection cycle (Frischknecht and Matuschewski, 2017) and has been investigated with traction force microscopy (Münter et al., 2009) and laser tweezers (Quadt et al., 2016). Note that the molecular sensors semi-quantitatively detect distribution of forces transduced via single receptors, while they do not report on the overall forces transmitted per cell (Goktas and Blank, 2017) nor the direction of force without integration of further fluorescence polarization techniques (Brockman et al., 2018). Since the methods are very sensitive to changes in the experimental procedure, we recommend to carefully control each step of the protocol.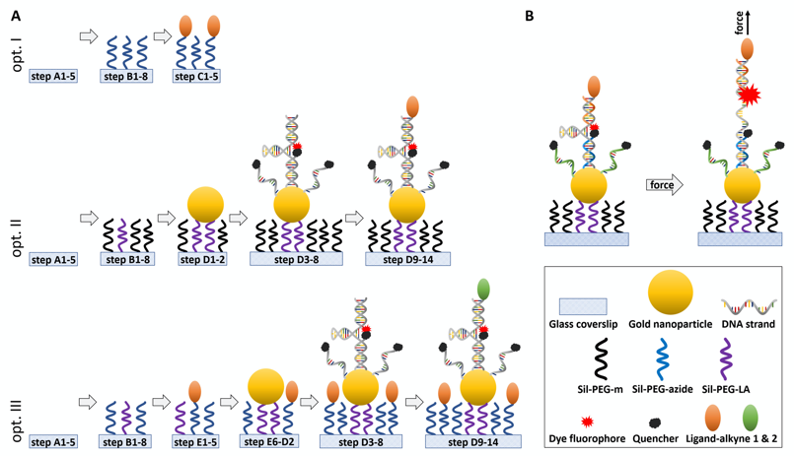
Figure 1. Schematic of the experimental design and working principle of the in vitro DNA-sensor force assay. A. Step-by-step representation of the individual steps in this protocol to generate ligand-presenting surfaces (Opt. I), surfaces with DNA-based force sensors (Opt. II) and combination of cell adhesion ligands presented in the background of the surface and DNA-based force sensor bearing another type of ligand (Opt. III). Briefly, glass coverslips are cleaned, passivated with a PEG-layer and cellular ligands, gold nanoparticles and DNA strands are immobilized on top. For details, the indicated steps lead to the corresponding sections in the procedure chapter. B. Design of the DNA hairpin force sensors in relaxed conformation and under load. ‘Hairpin’ ssDNA (grey) forms the backbone of the sensors and is linked to the Gold nanoparticle at the bottom and a ligand at the top. Top ssDNA (orange) is linked to the fluorescent dye, bottom ssDNA (blue) is linked to a quencher. Additional bottom ssDNA (green) increases the quenching of background fluorescence. Annealing procedure of the DNA hairpin probe is described in Recipe 8. When a force is applied the partially self-annealing ‘hairpin’ strand unfolds by rupturing the hydrogen bonds between nucleotides, lowering the quenching efficiency between the two dyes, and thus local increase in the fluorescent signal. Figure is not drawn to scale.
Materials and Reagents
Standard
- 1.5 ml plastic reaction tube (e.g., Eppendorf, catalog number: 00 30125150 )
- Aluminum foil
- Cell hood
- Erlenmeyer flask of different sizes
- Flasks for buffers
- Glass beaker of different sizes
- Heat-resistant glass tub for oil bath
- Pipettes of different sizes with tips
- Schlenk flasks of different sizes
- Fine-tipped metallic tweezers, e.g., #4, #7 (Sigma, catalog number: T6165 )
- Ice
- Ultra-pure deionized water max. resistance of 18.2 MΩ·cm, e.g., MilliQ purified
- Inert gas (Ar)
- Nitrogen gas
- Schlenk line (Schlenk flask with wide opening, lid for Schlenk flask, connection tubing for Vaccuum and Nitrogen gas)
- Deionised (DI) water
Consumables
- 20 x 20 mm coverslips #1 (Carl Roth, catalog number: H873.2 )
- DWK Life Sciences DURANTM Filter Funnels (No. 3) (Fisher Scientific, catalog number: 09-841-090 )
- GE Healthcare illustraTM, NAP-5 column (Fisher Scientific, catalog number: 10054394 )
- Glass coverslip holder (home-built)
- Kimwipe tissues (Kimberly-Clark Worldwide, catalog number: 0 5517 )
- Molecular sieve 3 Å (Carl Roth, catalog number: 8487 )
- Pasteur pipettes ISO 7712 (230 mm) (Karl Hecht, catalog number: 40567002 )
- Petri dish, PS, 35/10 mm with vents (Greiner Bio-One, catalog number: 627102 )
- Rotilabo-syringe filter, CME, sterile (Carl Roth, catalog number: P818.1 )
- Silicon chamber (Ibidi GmbH, catalog number: 80841 )
- Teflon coverslip holder (home-built, commercially available, e.g., at Thermo Fisher Scientific, catalog number: C14784 )
- Silicon glue‚ Twinsil 22, Addition-curing duplucating silicone (Picodent GmbH, catalog number: 13001000 )
- Silicon oil for oil bath (Sigma-Aldrich, catalog number: 85409 )
Chemicals
- Gold Nanospheres, 9 nm (nanoComposix, custom size, 9 ± 2 nm, 0.05 mg ml−1 in tannic acid)
- (+)-Sodium L-ascorbate (Sigma-Aldrich, catalog number: A7631 )
- 3-(triethoxysilyl)propylisocyanate (Sigma-Aldrich, catalog number: 413364 )
- Acetic acid ethyl ester (Carl Roth, catalog number: 6784 )
- Acetonitrile (CHROMASOLV for HPLC) (Honeywell International, catalog number: 60-002-31 )
- Aminoguanidine hydrochloride (Sigma-Aldrich, catalog number: A8835 )
- ɑ-Silane-ω-alkyne PEG, (CH3O)3-Si-PEG(3000)-C≡CH (Rapp Polymere, catalog number: 133000-70-71 )
- ɑ-Silane-ω-azido PEG, (CH3O)3-Si-PEG(3000)-N3 (Rapp Polymere, catalog number: 133000-5-71 )
- Copper sulfate (Sigma-Aldrich, catalog number: C1297 )
- Diethyl ether (Sigma-Aldrich, catalog number: 309966 )
- Dimethyl sulfoxide (for spectroscopy) (DMSO) (Merck, catalog number: 102950 )
- cRGD-alkyne (Biotrend Chemicals, custom synthesis: Cyclo(Arg-Gly-Asp-D-Phe-Pra))
- Hydrogen peroxide 30% (Merck, catalog number: 107209 )
- LA-PEG(3400)-NH2 (Biochempeg Scientific, catalog number: HE039005-3.4K )
- Methanol (Carl Roth, catalog number: 00 82 )
- N,N-Dimethylformamide (anhydrous, 99.8%) (DMF) (Sigma-Aldrich, catalog number: 227056 )
- Potassium chloride (KCl) (Sigma-Aldrich, catalog number: P9333 )
- Potassium hydroxide (for cleaning bath) (Sigma-Aldrich, catalog number: P5958 )
- Potassium phosphate monobasic (KH2PO4) (Sigma-Aldrich, catalog number: P5655 )
- QSY21 (Thermo Fisher Scientific, InvitrogenTM, catalog number: Q20131 )
- Silane-PEG-methoxy, Sil-PEG(2000)-m (Biochempeg Scientific, catalog number: MF001020-2K )
- Sodium carbonate (Na2CO3) (Carl Roth, catalog number: A135 )
- Sodium chloride (NaCl) (Sigma-Aldrich, catalog number: S7653 )
- Sodium phosphate dibasic (Na2HPO4) (Sigma-Aldrich, catalog number: 255793 )
- StarRed-NHS (Abberior) (Abberior, catalog number: 1-0101-011-3 )
- Sulfuric acid 96% (VWR CHEMICALS, catalog number: 1.08131.1000 )
- Toluene (Merck, catalog number: 108325 )
- Triethylamine (Sigma-Aldrich, catalog number: 471283 )
- Triethylammonium acetate (TEAA) (Sigma-Aldrich, catalog number: 69372 )
- Tris(3-hydroxypropyltriazolylmethyl)amine (THPTA) (Sigma-Aldrich, catalog number: 762342 )
- Click reaction mixture (CuAAC) (see Recipes)
- Dried toluene (see Recipes)
- Sil-PEG(3500)-LA (see Recipes)
DNA strands (custom synthesis by Integrated DNA Technologies, Inc.)
Note: Self-annealing sections underlined, top strand annealing dotted, bottom strand annealing dashed; a list of the hairpins used in literature and their calibration can be found in Zhang et al., 2014 and Liu et al., 2016.
- Top: 5′- /5AmMC6/ CGC ATC TGT GCG GTA TTT CAC -3′
- Bottom NH2-quencher:
5′- /5ThioMC6-D/TTT GCT GGG CTA CGT GGC GCT CTT/3AmMO/ -3′ - Hairpin 4.2 pN:
5'- /5AzideN/GTG AAA TAC CGC ACA GAT GCG TTT - GTA TAA ATG TTT TTT TCA TTT ATA C - TTT AAG AGC GCC ACG TAG CCC AGC AAA/3ThioMC3-D/ -3’ - Hairpin 12 pN:
5'- /5AzideN/GTG AAA TAC CGC ACA GAT GCG TTT - GGG TTA ACA TCT AGA TTC TAT TTT TAG AAT CTA GAT GTT AAC CC - TTT AAG AGC GCC ACG TAG CCC AGC AAA/3ThioMC3-D/ -3′ - Hairpin 19 pN:
5'- /5AzideN/GTG AAA TAC CGC ACA GAT GCG TTT - CGC CGC GGG CCG GCG CGC GGT TTT CCG CGC GCC GGC CCG CGG CG - TTT AAG AGC GCC ACG TAG CCC AGC AAA/3ThioMC3-D/ -3′ - Labeled DNA strands (see Recipes)
- Annealed DNA strands (see Recipes)
Enzymes
- StemPro Accutase Cell Dissociation Reagent (Thermo Fisher Scientific, Gibco®, catalog number: A1110501 )
Medium
- Albumin Fraction V (Carl Roth, catalog number: 8076 )
- Fetal Bovine Serum (USA) (Sigma-Aldrich, catalog number: F2442 )
- MEM α (Thermo Fisher Scientific, Gibco®, catalog number: 12561 )
- Penicillin-Streptomycin (10,000 U/ml) (Thermo Fisher Scientific, Gibco®, catalog number: 15140148 )
- RPMI 1640 Medium (Thermo Fisher Scientific, Gibco®, catalog number: 11-875 )
- Sodium Pyruvate 100 mM (100x) (Thermo Fisher Scientific, Gibco®, catalog number: 11360070 )
- Microscopy U2OS medium (see Recipes)
- Microscopy sporozoite gliding medium (see Recipes)
- PBS buffer (see Recipes)
Cell lines
- Plasmodium berghei ANKA strain (BEI resources (ATCC), catalog number: MRA-871 )
- Plasmodium berghei NK65 strain, CS-GFP line (optional usage, see Step H4) (not commercially available, requestable from cooperating parasitological institutes; further information can be found in Natarajan et al., 2001)
- U2OS, osteosarcoma cells (ATCC, catalog number: HTB-96 )
Equipment
- 300 °C Oven
- Freezer (-20 °C and -80 °C)
- Fridge (4 °C)
- Fume hood
- Centrifuge (Thermo Fisher Scientific, model: Heraeus Biofuge Pico )
- Centrifuge (Thermo Fisher Scientific, model: Heraeus Multifuge 1S-R ; catalog number: 75004331 )
- Hot Plates Accessories (IKA, model: ETS-D5 , catalog number: 0003378000 )
- HPLC (GE Comp Healthcare Life Sciences, model: ÄKTA Pure Chromatography System )
- HPLC column (Phenomenex, model: Luna 5u C18(2)-RP-HPLC , catalog number: 00G-4252-N0 )
- Lyophilisator (Labconco, model: FreeZone Plus 2.5 Liter Cascade Benchtop Freeze Dry System , catalog number: 7670020 )
- Magnetic Stirrers (IKA, model: C-MAG HS 7 , catalog number: 0003581200 )
- Wide-field, inverted fluorescence microscope (Applied Precision, model: DeltaVisionTM Elite Microscope System, based on an Olympus IX71 body) with home-built environmental chamber (commercially available incubators e.g., at OKOLAB)
- Microscope filter set (Applied Precision, model: DeltaVisionTM Elite Filter Sets)
- Microscope objective (Olympus, model: Objective 60x/1.4 NA PlanApo IX70 )
- Sonicator (EMAG Technologies, model: Emmi-H22 , catalog number: 9 82 17-DE)
- Spectrophotometer (NanoDrop Technologies, model: PEQLAB Nano Drop ND-1000 )
- Thermal cycler (Bio-Rad Laboratories, model: Bio-Rad T100 , catalog number: 1861096 )
Software
- Fiji is just ImageJ (Version 1.52e; https://fiji.sc/) (Schindelin et al., 2012)
- Stack contrast adjustment, plugin for Fiji (Michálek et al., 2007)
Procedure
文章信息
版权信息
© 2020 The Authors; exclusive licensee Bio-protocol LLC.
如何引用
Wack, M., Wiegand, T., Frischknecht, F. and Cavalcanti-Adam, E. A. (2020). An in vitro DNA Sensor-based Assay to Measure Receptor-specific Adhesion Forces of Eukaryotic Cells and Pathogens. Bio-protocol 10(17): e3733. DOI: 10.21769/BioProtoc.3733.
分类
细胞生物学 > 基于细胞的分析方法 > 细胞粘附
微生物学 > 微生物-宿主相互作用 > 离体模型
您对这篇实验方法有问题吗?
在此处发布您的问题,我们将邀请本文作者来回答。同时,我们会将您的问题发布到Bio-protocol Exchange,以便寻求社区成员的帮助。