

Tandem Tag Assay Optimized for Semi-automated in vivo Autophagic Activity Measurement in Arabidopsis thaliana roots
优化的串联标签检测用于拟南芥根组织中体内半自动化自噬活性测定


发布: 2020年03月05日第10卷第5期 DOI: 10.21769/BioProtoc.3535 浏览次数: 5727
评审: Samik BhattacharyaTohir BozorovLi-Qing ChenAnonymous reviewer(s)
参见作者原研究论文
The authors used this protocol in:
Nov 2019


Abstract
Autophagy is the main catabolic process in eukaryotes and plays a key role in cell homeostasis. In vivo measurement of autophagic activity (flux) is a powerful tool for investigating the role of the pathway in organism development and stress responses. Here we describe a significant optimization of the tandem tag assay for detection of autophagic flux in planta in epidermal root cells of Arabidopsis thaliana seedlings. The tandem tag consists of TagRFP and mWasabi fluorescent proteins fused to ATG8a, and is expressed in wildtype or autophagy-deficient backgrounds to obtain reporter and control lines, respectively. Upon autophagy activation, the TagRFP-mWasabi-ATG8a fusion protein is incorporated into autophagosomes and delivered to the lytic vacuole. Ratiometric quantification of the low pH-tolerant TagRFP and low pH-sensitive mWasabi fluorescence in the vacuoles of control and reporter lines allows for a reliable estimation of autophagic activity. We provide a step by step protocol for plant growth, imaging and semi-automated data analysis. The protocol presents a rapid and robust method that can be applied for any studies requiring in planta quantification of autophagic flux.
Keywords: Plant autophagy (植物自噬)Background
The Tandem Tag (TT) assay is a widespread approach for quantifying autophagic flux in yeast and mammalian cells (Zhou et al., 2012; Klionsky et al., 2016; Yoshii and Mizushima, 2017). It has been previously described to be applicable for plant cells in a study using tobacco BY-2 cell suspension cultures (Hanamata et al., 2013; Klionsky et al., 2016). Here we provide a detailed protocol for in planta quantification of autophagic flux in epidermal root cells of Arabidopsis thaliana seedlings (Figure 1). The TT assay employs ratiometric quantification of red and green fluorescence and allows to quantify relative induction or inhibition of autophagy. Another advantage of this method is that it provides valuable information on subcellular localization of ATG8, i.e., translocation of ATG8 from the nuclei to cytoplasm (Zhou et al., 2012), incorporation into puncta of different morphologies and motility, and its accumulation in the vacuole.
For this protocol we used stable transgenic Arabidopsis lines expressing the optimized TT (Huang et al., 2015) fused to AtATG8a and driven by a double 35S promoter. The TT-AtATG8a fusion was introduced into wild-type or atg5atg7 double knockout backgrounds, to produce reporter and control lines, respectively (Dauphinee et al., 2019). Under normal growth conditions TT-AtATG8a is localized in the cytoplasm and in the nuclei of the root epidermal cells, but upon induction of autophagy it is gradually translocated to the cytoplasm, then incorporated into autophagosome membranes and delivered together with the cargo to the lytic vacuole. While TagRFP shows relatively high tolerance to the pH of the lytic compartments (Huang et al., 2015), fluorescence of mWasabi is significantly reduced under the same conditions. Thus, ratiometric measurement of the TagRFP and mWasabi fluorescence allows to estimate the delivery rate of the fusion protein to the lytic compartment and eliminates potential bias coming from differences in fusion protein expression. Furthermore, since the assay relies on confocal microscopy image acquisition and analysis, it is possible to obtain time-resolved and dose-dependent data about the changes in autophagic activity. Although we describe only a protocol for detection of the TT-AtATG8a delivery to the vacuole, it is also possible to use the same imaging data to visualize and quantify dynamics of autophagosome formation.
We observed that response to known modulators of autophagic activity, such as AZD8055, which induces autophagy by inhibiting TORC1 activity, and concanamycin A (ConA) (Dauphinee et al., 2019), which inhibits autophagy by inactivating vacuolar vATPase and thus changing the pH of the lytic compartment, in Arabidopsis roots significantly varied depending on the area of the root zone scanned. By comparing data obtained from different root zones, we established that the most reproducible measurements could be obtained by analyzing images of root epidermal cells located in the beginning of the differentiation zone. Nevertheless, we still observed quite significant variation between responses in tricho- and atrichoblasts. Hence, a relatively large number of images was required for the data analysis to obtain a reliable mean value representative of average autophagic activity in root cells.
This assay provides a significant improvement of autophagic activity measurement in planta. It is based on high-throughput image analysis, thus improving reproducibility and robustness of the results. It relies on the use of designated macros written in ImageJ Macro Language (IJM) and R scripts. We ensured that it can be universally used for imaging data obtained using confocal laser scanning microscopes (CLSMs) of various manufacturers. Furthermore, to enable applicability of the protocol for images obtained on different CLSM systems that will naturally vary in efficacy of detection, we added an extra step of threshold values adjustments that will maximize the capacity of the vacuole area selection tool.
Importantly, the TT assay described here allows quantification of autophagy-dependent delivery of ATG8 to the lytic vacuole. Although it can be used as a very good indication for estimating autophagic activity, it is still preferable to combine this assay with other techniques verifying degradation of autophagic cargo e.g., the GFP-ATG8 cleavage assay or long-lived proteins assay (Dauphinee et al., 2019; Klionsky et al., 2016).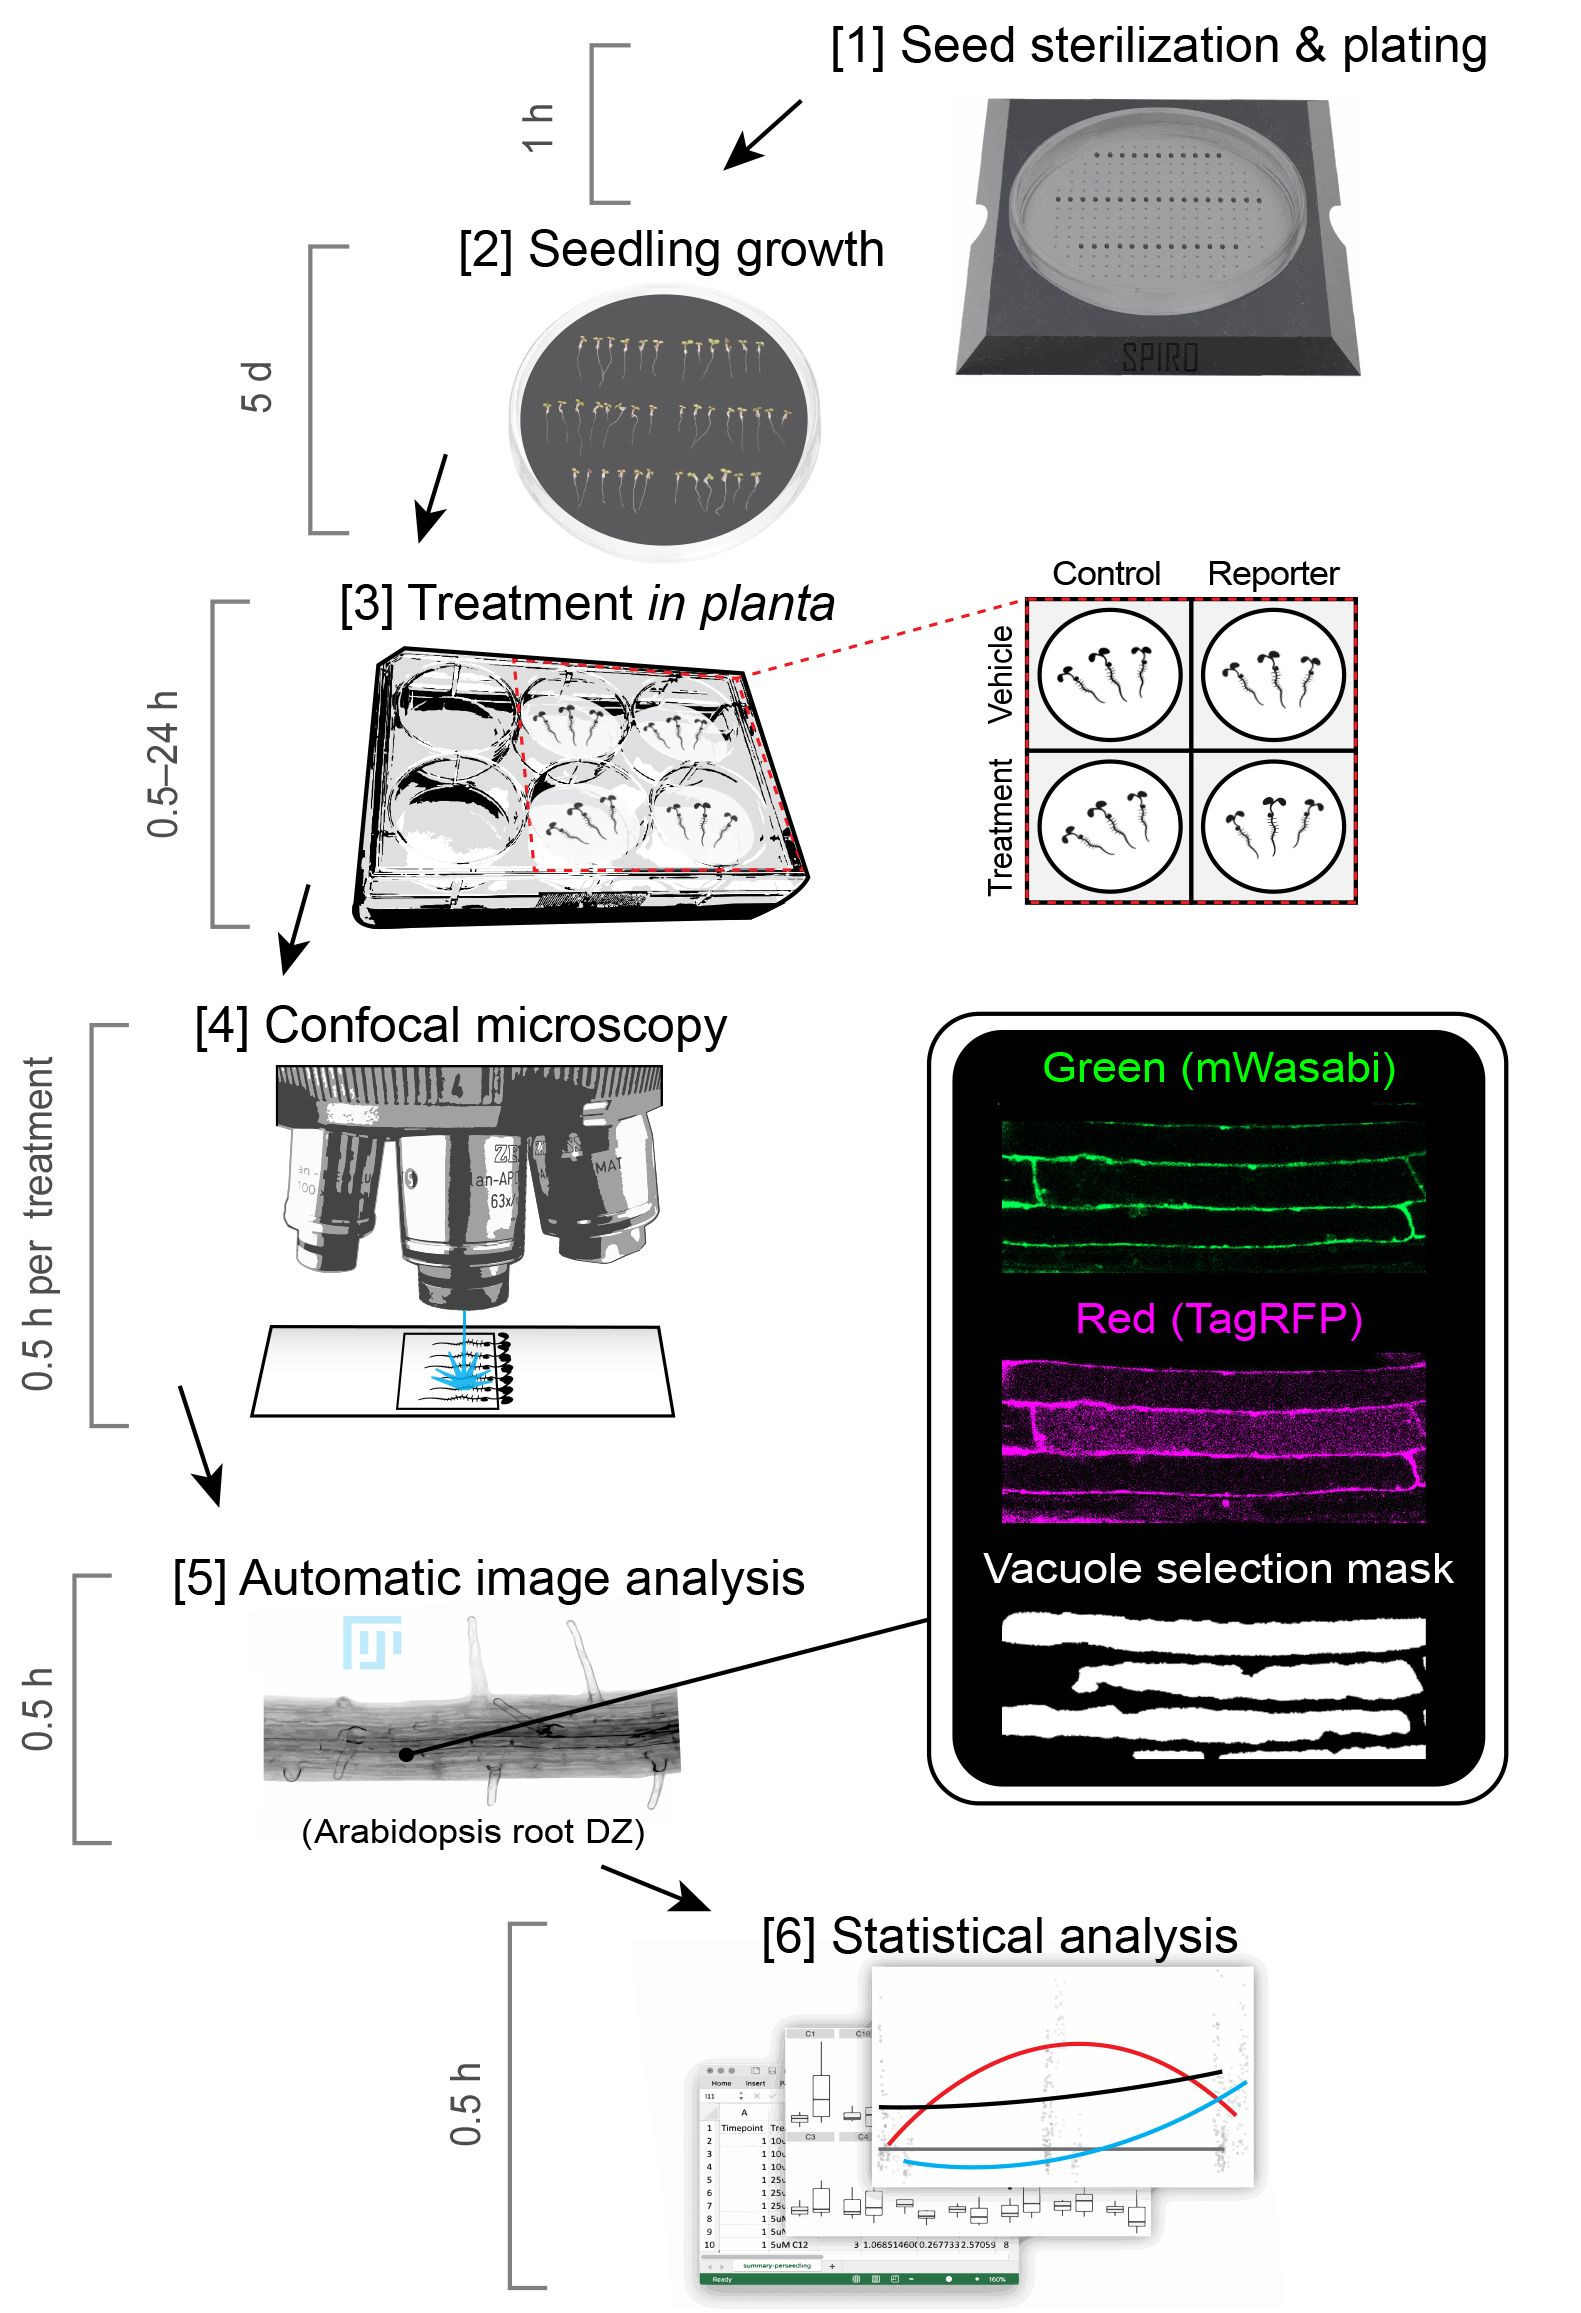
Figure 1. A workflow scheme of the Tandem Tag assay. The protocol for the assay comprises six major steps. The time required for each step was estimated based on experienced user progress. It is recommended to use a seed plating guide in the first step to establish equal distance between seedlings and reproducible growth conditions. In the second step, seedlings are grown on the vertically positioned plates to ensure that roots remain on the surface of the medium. We suggest to perform drug treatments in liquid medium for faster, more even and more reproducible delivery of the drugs into the root cells. The required treatment time will be compound-specific. The time required for confocal microscopy might vary depending on microscope configuration and software.
Materials and Reagents
- 1.5 ml Eppendorf tubes
- Petri dishes (Thermo Fisher Scientific, catalog number: 150239 )
- Pipette tips
- 6-well tissue culture plates (Thermo Fisher Scientific, catalog number: 15213338 )
- Micro cover glass 25 x 50 mm and 25 x 25 mm (VWR, catalog numbers: 48382-136 and 48366-089 )
- Sealing Film, PVC (Phytotechlab, Product ID: A003) or Parafilm (VWR, catalog number: 52859-079 )
- Bleach solution (Klorin, Colgate Palmolive)
- Tween-20, Polysorbate (VWR, catalog number: 97062 )
- 3D printed seed plating guide (https://www.thingiverse.com/thing:4016917)
- Murashige and Skoog, MS medium (Duchefa Biochemi, catalog number: M0222 ) liquid medium
- MES, 2-(N-morpholino) ethanesulfonic acid (Duchefa Biochemi, catalog number: M1503 )
- Sucrose (Duchefa Biochemi, catalog number: S0809 )
- KOH (VWR, catalog number: 470302 )
- Plant agar (Duchefa Biochemi, catalog number: P1001 )
- DMSO (Sigma-Aldrich, catalog number: 276855 ) or other vehicle
- AZD8055 (Selleckchem, catalog number: S1555 )
- Immersion oil (Zeiss, catalog number: 444960 )
- Transgenic Arabidopsis lines used to establish this protocol were published in Dauphinee et al. (2019)
- Milli-Q (MQ) water
- Liquid 0.5x MS medium (see Recipes)
- Solid 0.5x MS medium (see Recipes)
- Bleach solution (see Recipes)
- ConA 1 mM stock in DMSO (see Recipes)
Equipment
- Pipettes for 100-1,000 µl and 1-10 μl
- Forceps (Dumont, catalog number: 11251-10 )
- 4 °C fridge
- Arabidopsis growth cabinet/growth room: 20-22 °C, 50-70% humidity, 150 µM light
- Confocal Laser Scanning Microscope (CLSM; Zeiss, LSM 800)
Software
- Fiji, the version of ImageJ with included set of plugins (https://fiji.sc/, for this study, we utilized versions 1.51s and 2.0.0-rc-69/1.52i).
- AuTToFlux repository containing three ImageJ macro and three R script files (https://github.com/jonasoh/AuTToFlux/archive/master.zip):
- CalibrateThreshold.ijm
- ImageProcessor.ijm
- FluorescenceIntensity.ijm
- EvaluateCalibration.R
- Control-vs-Reporter.R
- Flux-vs-Time.R
- R (https://www.r-project.org, we used 3.5.2 and 3.5.1)
- RStudio (https://www.rstudio.com/, we used versions 1.1.453 and 1.2.1186).
- Git (https://git-scm.com/downloads, we used the version 2.24.1)
- R packages:
Procedure
文章信息
版权信息
© 2020 The Authors; exclusive licensee Bio-protocol LLC.
如何引用
Readers should cite both the Bio-protocol article and the original research article where this protocol was used:
- Dauphinee, A. N., Ohlsson, J. A. and Minina, E. A. (2020). Tandem Tag Assay Optimized for Semi-automated in vivo Autophagic Activity Measurement in Arabidopsis thaliana roots. Bio-protocol 10(5): e3535. DOI: 10.21769/BioProtoc.3535.
- Dauphinee, A. N., Cardoso, C., Dalman, K., Ohlsson, J. A., Berglund Fick, S., Robert, S., Hicks, G. R., Bozhkov, P. and Minina, E. A. (2019). Chemical screening pipeline for identification of specific plant autophagy modulators. Plant Physiol 181(3):855-866.
分类
植物科学 > 植物细胞生物学 > 细胞成像
发育生物学 > 细胞生长和命运决定 > 增殖
细胞生物学 > 细胞成像 > 共聚焦显微镜
您对这篇实验方法有问题吗?
在此处发布您的问题,我们将邀请本文作者来回答。同时,我们会将您的问题发布到Bio-protocol Exchange,以便寻求社区成员的帮助。