

A Protocol to Map the Spatial Proteome Using HyperLOPIT in Saccharomyces cerevisiae
利用HyperLOPIT绘制酿酒酵母空间蛋白质组图谱的方法
发布: 2019年07月20日第9卷第14期 DOI: 10.21769/BioProtoc.3303 浏览次数: 7498
评审: Alessandro DidonnaJulie WeidnerAnonymous reviewer(s)
参见作者原研究论文
The authors used this protocol in:
Apr 2014
Advertisement


Abstract
The correct subcellular localization of proteins is vital for cellular function and the study of this process at the systems level will therefore enrich our understanding of the roles of proteins within the cell. Multiple methods are available for the study of protein subcellular localization, including fluorescence microscopy, organelle cataloging, proximity labeling methods, and whole-cell protein correlation profiling methods. We provide here a protocol for the systems-level study of the subcellular localization of the yeast proteome, using a version of hyperplexed Localization of Organelle Proteins by Isotope Tagging (hyperLOPIT) that has been optimized for use with Saccharomyces cerevisiae. The entire protocol encompasses cell culture, cell lysis by nitrogen cavitation, subcellular fractionation, monitoring of the fractionation using Western blotting, labeling of samples with TMT isobaric tags and mass spectrometric analysis. Also included is a brief explanation of downstream processing of the mass spectrometry data to produce a map of the spatial proteome. If required, the nitrogen cavitation lysis and Western blotting portions of the protocol may be performed independently of the mass spectrometry analysis. The protocol in its entirety, however, enables the unbiased, systems-level and high-resolution analysis of the localizations of thousands of proteins in parallel within a single experiment.
Keywords: Saccharomyces cerevisiae (酿酒酵母)Background
Knowledge of the subcellular localization of a protein is crucial in defining its functions within the cell and regulation of the spatial organization of the proteome is essential for cellular homeostasis. Subcellular protein localization allows proteins to act as members of higher-order complexes with binding partners such as proteins, metabolites and co-factors, and contribute to the functions of organelles. In some cases, the sequestration of enzymes within specific subcellular compartments is critical to ensure that intermediates are not exchanged between different metabolic pathways or that potentially detrimental reactions (e.g., proteolysis) are confined to a ‘safe’ space. Protein localization can be influenced by post-translational modification, such as the phosphorylation of proteins within signaling cascades that ultimately allow proteins such as transcription factors (TFs) to localize within the nucleus to exercise their gene regulatory functions, or allowing other proteins to traverse the nuclear membrane and regulate nuclear-localized transcription factors. One example is the case of the osmostress response pathway in yeast, where a signaling cascade is activated that results in the phosphorylation of the protein Hog1p, whereupon it can translocate to the nucleus and phosphorylate the TF Hot1p which, in turn, can recruit RNA polymerase II to the promoters of responsive genes (Alepuz et al., 2003).
A growing body of evidence suggests that differential protein localization, even within the same cell type, may allow the protein to fulfil different roles depending on its respective localization within a cell, sometimes referred to as “moonlighting” (Gancedo et al., 2016). In Saccharomyces cerevisiae, examples of such proteins include Gcn4p, which is the general transcription factor that controls amino acid biosynthesis (Hope and Struhl, 1986) and also acts as a ribonuclease (Nikolaev et al., 2010); as well as Aco1p, which has roles in mitochondrial DNA stability in addition to its more widely known function as tricarboxylic acid cycle enzyme (Chen et al., 2005). Isoforms of the same protein have further been observed with different localizations in the same cell type, suggesting that this differential localization may offer another level of regulation with regard to protein function. An example of this is the case of a DNA methyltransferase (Dnmt1) in murine stem cells, in which one isoform localized to chromatin and the other isoform is found in an alternative nuclear location (Christoforou et al., 2016).
It is clear that there are many levels of complexity regarding protein subcellular localization. In order to fully understand the in vivo functions of proteins, it is vital to ascertain where, within the cell, they are located. Several methods exist that can be applied to approach this challenge, including fluorescence microscopy imaging, organelle proteomics, proximity biotinylation methods, and protein correlation profiling methods; all of which have been applied in Saccharomyces cerevisiae in different contexts to determine the subcellular localization of yeast proteins. Whole-cell, high-throughput studies based on fluorescence microscopy have been performed using GFP- or other fluorescence protein-tagged protein libraries (Huh et al., 2003; Tkach et al., 2012; Breker et al., 2013; Denervaud et al., 2013; Chong et al., 2015; Weill et al., 2018; Yofe et al., 2016). Although powerful, these methods have documented problems in that the fluorescence signal of a particular protein of interest may not exceed the background level of cellular autofluorescence, particularly in yeast, and therefore it may not be possible to determine the location of such proteins. Additionally, some proteins may require their unmodified C- or N-terminus for correct localization (Weill et al., 2018; Yofe et al., 2016). As such, performing protein localization studies where proteins are tagged with a fluorescent protein either N- or C-terminally to the ORF in question may result in a given protein being reported with different localizations within the same biological system, depending on which strategy was used (Stadler et al., 2013).
Organelle enrichment strategies have also been employed to define organelle proteomes, thereby contributing to our knowledge on protein localization. These strategies often exploit the characteristic buoyant densities of organelles in their enrichment. The relative ease with which mitochondria can be highly enriched, for example, has been exploited in many studies that have attempted to define the mitochondrial proteome, with varying levels of specificity, in S. cerevisiae. This includes some studies that used more crude approaches to attempt to define the mitochondrial proteome (Sickmann et al., 2003; Reinders et al., 2006) or specific sub-mitochondrial proteomes (Zahedi et al., 2006; Vogtle et al., 2012) in some cases without control for other organelle proteins that were co-enriched along with the mitochondrial proteins. Improvements have been made in recent studies that mapped the entirety of the mitochondrial sub-organellar proteome using more complex fractionation and proteome quantitation methods (Morgenstern et al., 2017; Vogtle et al., 2017). For organelles of more heterogeneous density, however, the difficulty of such studies can be compounded by the presence of contaminating membranes from other organelles that co-enrich with the organelle of interest (Wiederhold et al., 2010). In focusing on a specific organelle, such methods fail to report on proteins that may be present at multiple locations in vivo. Further, there is no control for the proportion of an organelle that is lost upon enrichment.
Recently, new proximity labeling methods based on promiscuous biotinylation have shown promise in determining protein subcellular localization in organisms other than yeast. This includes the more detailed study of sub-organellar proteomes (Rhee et al., 2013; Hung et al., 2014), including cytoplasmic faces of organelles (Hung et al., 2017). The BirA-based BioID method (Roux et al., 2012) has been applied in S. cerevisiae to define the subcellular proteins that interact with a ribosomal scaffold protein (Opitz et al., 2017) and the APEX2 method (Lam et al., 2015) has been demonstrated to traverse the cell wall in proof-of-principle experiments in both S. cerevisiae and the fission yeast Schizosaccharomyces pombe (Hwang and Espenshade, 2016). Methods such as these focus only on the proximal interactors of a protein of interest, that are currently in the range of tens of nanometres (Rhee et al., 2013; Kim et al., 2014) and do not provide a whole-cell picture of the spatial organization of the proteome.
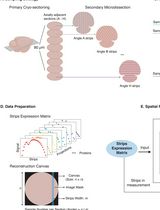
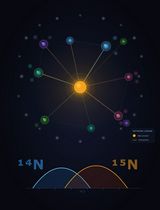
To overcome some of the inherent limitations of the methods described above, it is imperative to look at protein subcellular localization in the context of the whole cell. This has been commonly studied using whole-cell protein correlation profiling methods. Such methods are predicated on the observation that, when cell lysates are fractionated by some means, such as differential or density gradient centrifugation, proteins that localize to the same organelle will exhibit similar distributions when the protein distributions across the entire fractionation scheme are monitored (de Duve, 1971). This was originally monitored using enzyme assays that are representative of the organelles in question, but now employs quantitative mass spectrometry methods. Several such methods have been published, which offer differing levels of proteome coverage and subcellular resolution, employing different fractionation and mass spectrometry quantitation methods (Christoforou et al., 2016; Itzhak et al., 2016; Jean Beltran et al., 2016; Mulvey et al., 2017; Jadot et al., 2017; Geladaki et al., 2019). The hyperplexed Localization of Organelle Proteins by Isotope Tagging (hyperLOPIT) method uses density gradient centrifugation for subcellular fractionation, followed by multiplexed proteome quantitation using 10-plex TMT isobaric tags (Thompson et al., 2003) and SPS-MS3 quantitation on an Orbitrap Fusion Lumos mass spectrometer. The exquisite subcellular resolution offered by the density gradient coupled with multiplexed quantitation, followed by sophisticated machine learning analysis methods means that hyperLOPIT allows unbiased protein localization determination of thousands of proteins in parallel in a single experiment. Indeed the method has afforded the highest resolution spatial map of any whole-cell correlation profile-based spatial proteome study to date (Thul et al., 2017; Gatto et al., 2019).
We recently published a yeast spatial proteome mapping study in which we mapped the proteome in high throughput using hyperLOPIT, under nitrogen-sufficient conditions (Nightingale et al., 2019). In our study, we produced a dataset that provided localization data for 2,846 proteins. Only 936 of these proteins were found to map to a unique subcellular location, a number which corresponded to 32% of our observable spatial proteome. This suggests, in common with previous studies (Christoforou et al., 2016; Thul et al., 2017), that a large proportion of the proteome is dynamic or resides at multiple locations.
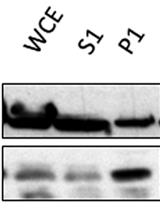
We provide here a protocol that describes how to perform nitrogen cavitation lysis (Hunter and Commerford, 1961; Simpson, 2010; Wang et al., 2014) subcellular fractionation, and a version of the hyperLOPIT protocol that has been modified for use with the yeast S. cerevisiae (see Figure 1 for an overview of the protocol). We further draw the reader’s attention to the fact that the subcellular fractionation and Western blotting portion of this protocol may be performed as a standalone experiment without TMT labeling. Further to this, in cases where a mass spectrometer capable of resolution of TMT 10- or 11-plex tags (such as the Thermo Fusion series) is not available, isobaric tags with lower multiplexing capability may instead be used. This may be achieved using iTRAQ (Ross et al., 2004) 4- or 8-plex, or TMT 6-plex, but, importantly, will result in reduced overall subcellular resolution relative to TMT 10- or 11-plex, as less of the subcellular fractionation gradient will be sampled in the experiment. HyperLOPIT and its predecessor, LOPIT, have been employed to great effect to map the subcellular proteomes of multiple different species and under numerous conditions (Sadowski et al., 2006; Nikolovski et al., 2012; Groen et al., 2014; Christoforou et al., 2016; Thul et al., 2017). We envisage that this protocol will therefore be applicable and modifiable to study the spatial proteomes of other yeasts, including the industrial yeast Komagataella phaffii (syn. Pichia pastoris) and pathogenic yeasts such as Candida albicans.
We recently published a protocol in Methods in Molecular Biology (Nightingale et al., 2018) that describes how to perform hyperLOPIT in S. cerevisiae. The lysis and subcellular fractionation portions of this protocol are substantially updated from a previous protocol by Wang and colleagues (2014). Here we provide a protocol with updated mass spectrometry data processing parameters using Proteome Discoverer 2.1 (Thermo Fisher Scientific, www.thermofisher.com), and with more focus on post-mass spectrometry informatics analysis. For a more in-depth and detailed informatics protocol than is presented here, we direct the reader to the publication of Breckels and colleagues (Breckels et al., 2016b). The subcellular fractionation portion of the hyperLOPIT protocol is technically challenging, requiring an unbroken stretch of experimental work lasting from cell harvest to gradient fraction collection. We strongly recommend that experimental work not be paused until the gradient fractions have been collected.
Figure 1. Overview of the hyperLOPIT method for Saccharomyces cerevisiae. Also included in parentheses are approximate timescales for each step, and potential stopping points.
Materials and Reagents
- 96-well plates (Thermo Fisher Scientific, catalog number: 167008)
- Falcon tubes, 15 and 50 ml capacity (Corning, catalog numbers: 430791 and 430291)
- Luer-lock syringes, 2 ml, 5 ml and 10 ml capacity (BD Plastipak, catalog numbers: 300185, 302187 and 300912, respectively)
- Microcentrifuge tubes, 1.5 ml capacity (Eppendorf, catalog number: 0030120086)
- Pipette tips (Rainin LTS 1,000 μl, LTS 250 μl and LTS 20 μl; catalog numbers: 17001864, 17001863 and 17001865; or equivalent tips compatible with pipettes used for this protocol)
- Polycarbonate thickwall ultracentrifuge tubes, 32 ml capacity (Beckman Coulter, catalog number: 355631)
- Polypropylene OptiSealTM ultracentrifuge tubes, 11.2 ml capacity (Beckman Coulter, catalog number: 362181) and associated tube adaptors (Beckman Coulter, catalog number: 362202)
- Semi-micro cuvettes (Sarstedt, catalog number: 67.742)
- Silicone tubing (1 mm inner diameter, 1 mm wall diameter) (Fisher Scientific, catalog number: 10430313)
- Stainless steel blunt-ended needle, 14 gauge (Sigma-Aldrich, catalog number: Z261408)
- Total recovery glass vials and caps with pre-slit septa (Waters, catalog number: 186000385C)
- Waste container
- X-ray film (Fujifilm, catalog number: 4741019289)
- Trans-Blot® TurboTM polyvinylidene fluoride (PVDF) membranes (Bio-Rad, catalog number: 1704157)
- Saccharomyces cerevisiae strain appropriate to experimental aims (e.g., BY4741 (Baker Brachmann et al., 1998), which we used for our recent hyperLOPIT study; Nightingale et al., 2019)
- Acetic acid (Sigma-Aldrich, catalog number: 320099)
- Acetone, analytical grade (Sigma-Aldrich, catalog number: 32201)
- Acetonitrile, HPLC gradient-grade (Fisher Scientific, catalog number: A/0627/17)
- Adenine hemisulfate (Sigma-Aldrich, catalog number: A3159)
- AmershamTM ECLTM Prime Enhanced Chemiluminescent Western Blotting Detection Reagent (GE Healthcare, catalog number RPN2232)
- Ammonium formate (Sigma-Aldrich, catalog number: 70221)
- Ammonium hydroxide (Sigma-Aldrich, catalog number: 30501)
- Arginine (Sigma-Aldrich, catalog number: A8094)
- DifcoTM BactoTM agar (Fisher Scientific, catalog number: 10455513)
- Difco Bacto peptone (Fisher Scientific, catalog number: DF0118-17-0)
- Difco Bacto yeast extract (Fisher Scientific, catalog number: DF0127-17-9)
- cOmpleteTM Mini protease inhibitor tablets (Roche, catalog number: 11836170001)
- cOmpleteTM protease inhibitor tablets (Roche, catalog number: 11873580001)
- D-(+)-Glucose (Sigma-Aldrich, catalog number: G7021)
- Dibasic potassium phosphate (Sigma-Aldrich, catalog number: P3786)
- DL-Dithiothreitol (DTT) (Melford Laboratories, catalog number: D11000)
- Ethylenediaminetetraacetic acid (EDTA) (Sigma-Aldrich, catalog number: E5134)
- Ficoll® PM-400 (Sigma-Aldrich, catalog number: F4375)
- Formic acid (VWR, catalog number: 20318.297)
- HEPES free acid (Melford Laboratories, H75030)
- Histidine (Sigma-Aldrich, catalog number: H6034)
- Hydrochloric acid, 37% (v/v) (Fisher Scientific, catalog number: H/1200/PB15)
- Hydroxylamine 50% (w/v) solution (Thermo Fisher Scientific, catalog number: 90115)
- Iodoacetamide (Sigma-Aldrich, catalog number: I6125)
- Isoleucine (Sigma-Aldrich, catalog number: I5281)
- Leucine (Sigma-Aldrich, catalog number: L8912)
- Lysine (Sigma-Aldrich, catalog number: L5501)
- Magnesium acetate (Sigma-Aldrich, catalog number: M5661)
- Magnesium chloride (Sigma-Aldrich, catalog number: M8266)
- Methionine (Sigma-Aldrich, catalog number: M5308)
- Non-fat dry milk powder, such as MarvelTM
- OptiPrepTM (Sigma-Aldrich, catalog number: D1556)
- Phenylalanine (Sigma-Aldrich, catalog number: P5482)
- Potassium acetate (Sigma-Aldrich, catalog number: P1190)
- Potassium chloride (Sigma-Aldrich, catalog number: 31248)
- Protein concentration estimation assay, such as PierceTM BCA protein assay (Thermo Fisher Scientific, catalog number: 23225), DCTM protein assay (Bio-Rad, catalog number: 5000112) or Quick StartTM Bradford assay (Bio-Rad, catalog number: 5000202)
- Sequencing Grade Modified Trypsin (Promega, catalog number: V5111)
- Sodium dodecyl sulfate (SDS) (Sigma-Aldrich, catalog number: 436143)
- Sodium hydroxide (Sigma-Aldrich, catalog number: 06203)
- Sorbitol (Sigma-Aldrich, catalog number: W302902)
- Sucrose (Sigma-Aldrich, catalog number: S0389)
- Threonine (Sigma-Aldrich, catalog number: T8441)
- TMT 10-plex or 11-plex isobaric tagging reagents (Thermo Fisher Scientific, catalog number: 90111 or A37725, respectively)
- Trichloroacetic acid (TCA) (Fisher Scientific, catalog number: 421455000)
- Trifluoroacetic acid (TFA) (Thermo Fisher Scientific, catalog number: 85183)
- Tris base (Melford Laboratories, catalog number: T60040)
- Tris-(2-carboxyethyl) phosphine (TCEP) (Generon, catalog number: GEN-TCEP)
- Tryptophan (Sigma-Aldrich, catalog number: T8941)
- Tween® 20 (Sigma-Aldrich, catalog number: P1379)
- Tyrosine (Sigma-Aldrich, catalog number: T8566)
- Uracil (Sigma-Aldrich, catalog number: U1128)
- Valine (Sigma-Aldrich, catalog number: V4638)
- Water, HPLC gradient-grade (Fisher Scientific, catalog number: W/0106/17)
- Yeast nitrogen base without amino acids (Sigma-Aldrich, catalog number: Y0626)
- Zymolyase 100-T (Nacalai-Tesque, catalog number: 07665-55)
- Anti-Pgk1p antibody, for use as cytosol Western blotting marker (Abcam, catalog number: ab113687)
- Anti-Dpm1p antibody, for use as endoplasmic reticulum Western blotting marker (ThermoFisher Scientific, catalog number: A-6429)
- Anti-Pep1p antibody, for use as Golgi apparatus Western blotting marker (Abcam, catalog number: ab113690)
- Anti-Cox4p antibody, for use as mitochondrial Western blotting marker (ThermoFisher Scientific, catalog number: 459150)
- Anti-Hh3p antibody, for use as nuclear Western blotting marker (Abcam, catalog number: ab1791)
- Anti-Pma1p antibody, for use as plasma membrane Western blotting marker (Abcam, catalog number: ab4645)
- 5x SDS-PAGE sample buffer (Jena Biosciences, catalog number: BU-117)
- 4-20% Mini-PROTEAN® TGXTM Precast Protein Gels (Bio-Rad, catalog number: 4561096)
- TGS buffer 10x (Bio-Rad, catalog number: 1610732)
- 10x yeast nitrogen base (YNB) (see Recipes)
- 10x complete supplement mixture (see Recipes)
- 40% (w/v) glucose (see Recipes)
- Synthetic medium with 2% glucose (see Recipes)
- YPD agar medium (see Recipes)
- TCEP reduction buffer (see Recipes)
- Spheroplasting medium (see Recipes)
- Zymolyase 100-T solution (see Recipes)
- Spheroplast wash medium (see Recipes)
- (Optional) Ficoll lysis buffer (Kizer et al., 2006) (see Recipes)
- (Optional) Buffer NP (Kizer et al., 2006) (see Recipes)
- 1x LB (see Recipes)
- 6x LB (see Recipes)
- Iodixanol working solution (IWS) (see Recipes)
- 18% (w/v) OptiPrep solution (see Recipes)
- 16% (w/v) OptiPrep solution (see Recipes)
- Protein resolubilization buffer (see Recipes)
- Digestion buffer (see Recipes)
- 5% (v/v) hydroxylamine (see Recipes)
- TTBS (see Recipes)
- Blocking solution (see Recipes)
- Dithiothreitol (DTT) solution (see Recipes)
- Iodoacetamide (IAA) solution (see Recipes)
- Equilibration buffer (see Recipes)
- Desalting buffer 1 (see Recipes)
- Desalting buffer 2 (see Recipes)
- Elution buffer (see Recipes)
- RP mobile phase stock solution (see Recipes)
- RP mobile phase A (see Recipes)
- RP mobile phase B (see Recipes)
- RP resolubilization buffer (see Recipes)
Equipment
- 4 °C refrigerator (Polestar cooling, model: MR 100 E)
- -20 °C freezer (Hotpoint, model: FZS175)
- -80 °C freezer (New Brunswick Scientific, model: U725-G)
- Acquity Ultra Performance Liquid Chromatography (UPLC) system with photodiode array (PDA) detector (Waters)
- Acquity UPLC BEH C18 column (Waters, catalog number: 186002353)
- Analytical balance ( Explorer, model: EX124)
- Auto-Densiflow peristaltic pump with automatic meniscus detection (Labconco)
- Avanti® JXN-26 floor-top preparative centrifuge (Beckman Coulter)
- Bioruptor® Plus sonicator (Diagenode, catalog number: B01020001)
- Centrifuge bottle assemblies, 500 ml capacity (Beckman Coulter, catalog number: 355649)
- Cuvette spectrophotometer (Cecil Instruments, model: 2041)
- Dounce homogenizer, 7 ml capacity (Wheaton, catalog number: 357542)
- Erlenmeyer flasks, 250 ml, 500 ml and 2 L capacity (Fisher Scientific, catalog numbers: 15429103, 15439103 and 11383454)
- Handheld analog refractometer (Bellingham + Stanley, E-line, catalog number: 44-803)
- JLA-10.500 rotor (Beckman Coulter, catalog number: 369681)
- Nitrogen cavitation vessel (Parr Instrument Company, model: 4639)
- OptimaTM L80-XP floor-top ultracentrifuge (Beckman Coulter)
- Orbitrap FusionTM LumosTM TribridTM mass spectrometer (Thermo Fisher Scientific)
- Oxygen-free nitrogen cylinder (BOC, Nitrogen [Oxygen-Free] 230bar Cylinder, size: W)
- Pipettes (Rainin LTS L-1000 XLS, L-200 XLS, L-20 XLS and L-10 XLS, catalog numbers: 17014382, 17014391, 1704392 and 17014388; or equivalent pipettes capable of dispensing the same volumes)
- Plate-reader spectrophotometer, capable of measuring wavelengths between 250 nm and 850 nm (Molecular Devices, Spectramax M2e)
- Pre-column for mass spectrometer-coupled nanoLC (Thermo Fisher Scientific, catalog number: 160454)
- Proxeon EASY-Spray column (Thermo Fisher Scientific, catalog number: ES803)
- Refrigerated benchtop centrifuge, capable of centrifuging 15 ml and 50 ml Falcon tubes and running at 4,500 x g (Eppendorf, model: 5804R)
- Refrigerated benchtop microcentrifuge, capable of centrifuging microfuge tubes and running at 16,100 x g (Eppendorf, model: 5415R)
- Sep-Pak® tC18 cartridges, 100 mg sorbent per cartridge (Waters, catalog number: WAT036820)
- Shaking incubator for cell culture (Sartorius, Certomat, model: BS-1)
- SW32Ti rotor (Beckman Coulter, catalog number: 369650)
- Thermo ScientificTM SterilinTM Standard 90mm Petri Dishes (Fisher Scientific, catalog number: 15370366)
- Tube holder for microfuge and Falcon tubes (Starlab, catalog number: E2345-1000)
- Trans-Blot® TurboTM system (Bio-Rad, catalog number: 1704150)
- Type 70 Ti rotor (Beckman Coulter, catalog number: 337922)
- Ultimate RSLCnano chromatography system (Thermo Fisher Scientific)
- Vacuum centrifuge (Labconco, CentriVap concentrator)
- VTi65.1 rotor (Beckman Coulter, catalog number: 362759)
- Electrophoresis system and associated power pack (Bio-Rad, model: Mini-PROTEAN® II)
Software
- Proteome Discoverer version 2.1 (Thermo Fisher Scientific, www.thermofisher.com)
- R programming language (R Core Team, 2018) (www.r-project.org)
- Bioconductor (Gentleman et al., 2004) MSnbase package (Gatto and Lilley, 2012) (http://bioconductor.org/packages/release/bioc/html/MSnbase.html)
- Bioconductor (Gentleman et al., 2004) pRoloc package (Gatto et al., 2014) (http://bioconductor.org/packages/release/bioc/html/pRoloc.html)
- Bioconductor (Gentleman et al., 2004) pRolocGUI package (Breckels et al., 2018) (http://bioconductor.org/packages/release/bioc/html/pRolocGUI.html)
- RStudio R programming language editor (RStudio Team, 2016) (www.rstudio.com)
- Mascot Server (Matrix Science, www.matrixscience.com)
- Microsoft Excel
Procedure
文章信息
版权信息
© 2019 The Authors; exclusive licensee Bio-protocol LLC.
如何引用
Nightingale, D. J. H., Lilley, K. S. and Oliver, S. G. (2019). A Protocol to Map the Spatial Proteome Using HyperLOPIT in Saccharomyces cerevisiae. Bio-protocol 9(14): e3303. DOI: 10.21769/BioProtoc.3303.
分类
微生物学 > 微生物蛋白质组学 > 全生物体
系统生物学 > 蛋白质组学 > 空间蛋白组学
您对这篇实验方法有问题吗?
在此处发布您的问题,我们将邀请本文作者来回答。同时,我们会将您的问题发布到Bio-protocol Exchange,以便寻求社区成员的帮助。