

Dual Fluorescence Reporter Based Analytical Flow Cytometry for miRNA Induced Regulation in Mammalian Cells
哺乳动物细胞中利用基于分析流式细胞术的双荧光报告因子研究miRNA诱导调控

.jpg)
发布: 2018年09月05日第8卷第17期 DOI: 10.21769/BioProtoc.3000 浏览次数: 12742
评审: HongLok LungYi CuiAnonymous reviewer(s)
参见作者原研究论文
The authors used this protocol in:

Mar 2017


Abstract
MicroRNA-induced gene regulation is a growing field in basic and translational research. Examining this regulation directly in cells is necessary to validate high-throughput data originated from RNA sequencing technologies. For this several studies employ luciferase-based reporters that usually measure the whole cell population, which comes with low resolution for the complexity of the miRNA-induced regulation. Here, we provide a protocol using a dual-fluorescence reporter and flow cytometry reaching single cell resolution; the protocol contains a simplified workflow that includes: vector generation, data acquisition, processing, and analysis using the R environment. Our protocol enables high-resolution measurements of miRNA induced post-transcriptional gene regulation and combined with system biology it can be used to estimate miRNAs proficiency.
Keywords: miRNA (miRNA)Background
MicroRNAs (miRNA) are highly conserved small non-protein-coding RNAs (21-22 nt) that regulate post-transcriptionally gene expression and modulate fundamental biological processes like development and cell homeostasis ( Lagos-Quintana et al., 2001; Fabian et al., 2010; Bartel, 2018), including as well several pathologies where miRNA expression correlates with tumor progression and aggressiveness (Lu et al., 2005; Di Leva and Croce, 2013; Krishnan et al., 2015; Bertoli et al., 2015 and 2016). The study of miRNAs has boosted the evolution of numerous biochemical and computational techniques that unravel new mechanisms and networks applicable to clinical scenarios. These high-throughput procedures include profiling methods (microarrays and NGS), in vivo target validation and single-molecule imaging (Steinkraus et al., 2016). In contrast, functional reporters that directly assess miRNA-target repression have been kept simple and with low resolution.
Deep sequencing and mass spectrometry have increased the possibilities to assess miRNAs and targets expression (Ender et al., 2008; Yang et al., 2009; Brameier et al., 2011; Schramedei et al., 2011; Bai et al., 2014a and 2014b; Muller et al., 2015; Yu et al., 2015), since quantifying the number of RNA molecules and running statistical analyses for the differential expression (miRNAs or mRNA) can generate hypotheses that need further experimental evaluation, using, for example, miRNA exogenous expression or inhibition. In brief mRNA analysis on cDNA level (qPCR or next-generation sequencing) estimates RNAs degradation, mass spectrometry defines the affected coding targets (Yang et al., 2009), and ribosome profiling determines which miRNAs targets are translationally repressed (Bazzini et al., 2012).
Moreover, to narrow down the analysis to the Argonaute bound miRNA captured-based profiling has been used, these profiles rely on RNA isolation from ribonucleoproteins, cDNA synthesis and its quantification (qPCR, microarrays or NGS). Crosslink-immunoprecipitation (CLIP) together with high-throughput sequencing increase enormously our understanding of miRNA regulation (Hafner et al., 2010), to the extent that including an RNA-RNA ligation step (in the capture) allows detecting miRNA-mRNA hybrids called chimeras (Helwak et al., 2013; Grosswendt et al., 2014; Moore et al., 2015).
FRET-based assays in vitro have calculated kinetic parameters for AGO-miRNA binding and RISC formation, increasing the structural basis of miRNA target recognition and suggesting that AGO-miRNA behaves more like RNA binding domain rather than RNA-RNA solely interaction (Wee et al., 2012; Salomon et al., 2015). Using this vast amount of information computational scientist developed algorithms to understand miRNA as an intricate network (Vera et al., 2013; Lai et al., 2016), expanding further with these integrative models the concepts of miRNA as fine-tuners and switches of gene expression (Bartel and Chen, 2004).
The increased resolution of sequencing methods did not boost the development of better in vivo reporters. Usually, studies involved in exhaustive biochemical characterizations (Bait profiling) tested functionally miRNA-mRNA interaction using luciferase reporter assays (Helwak et al., 2013; Hasler et al., 2016; Steinkraus et al., 2016). These experiments require two proteins (a reference protein and another with a miRNA response element) to create quantitative results (ratios) for miRNA regulation, dismissing the intricate functional network behind miRNAs; creating a misbalance between the high-resolution biochemical outputs (NGS, CLIP-Seq, FRET, etc.) and low-resolution reporters.
For that reason, we implemented a system for analytical flow cytometry (Denzler et al., 2016), using a single plasmid reporter system and validated it for miRNAs (Lemus-Diaz et al., 2017). To increase resolution, we used fluorescent proteins instead of luciferases, analyzed single cells by flow cytometry, and processed the data using the R environment. Furthermore, we adopted a titration model for miRNAs regulation, tested and validated its prediction, creating three categorical variables that integrate miRNA binding and expression (Mukherji et al., 2011; Lemus-Diaz et al., 2017), which can be used to estimate miRNA proficiency (Garcia et al., 2011).
Here, we provide a detailed protocol that includes plasmid generation, transfection, data acquisition, data handling and plotting using a simplified code. The reporter described here expresses two fluorescent proteins (CFP and YFP) under control of two constitutive promoters (Figure 1A), while one protein is the reference (YFP); the other has a miRNA response element (CFP). In the empty plasmid (CFP w/o miRNA target site) the two fluorescent proteins are expressed proportionally (Figure 1B), while in a plasmid with a miRNA response element this proportionality is shifted (Figure 1C).
To tidy up the raw events and analyze them using a threshold model for miRNA regulation, we process the data into a transfer function (called here Analytical function) by binning the reference protein intensities and calculating the mean for sensor protein (Bosson et al., 2014; Denzler et al., 2016). For our construct, we transfer the raw data in FCS 2.0 format into the R environment using FlowCore Bioconductor package (Gentleman et al., 2004; Hahne et al., 2009; Huber et al., 2015), then we logarithmically transform the YFP relative intensities, bin them at 0.05 intervals, and calculate the average of the log CFP intensities of each range.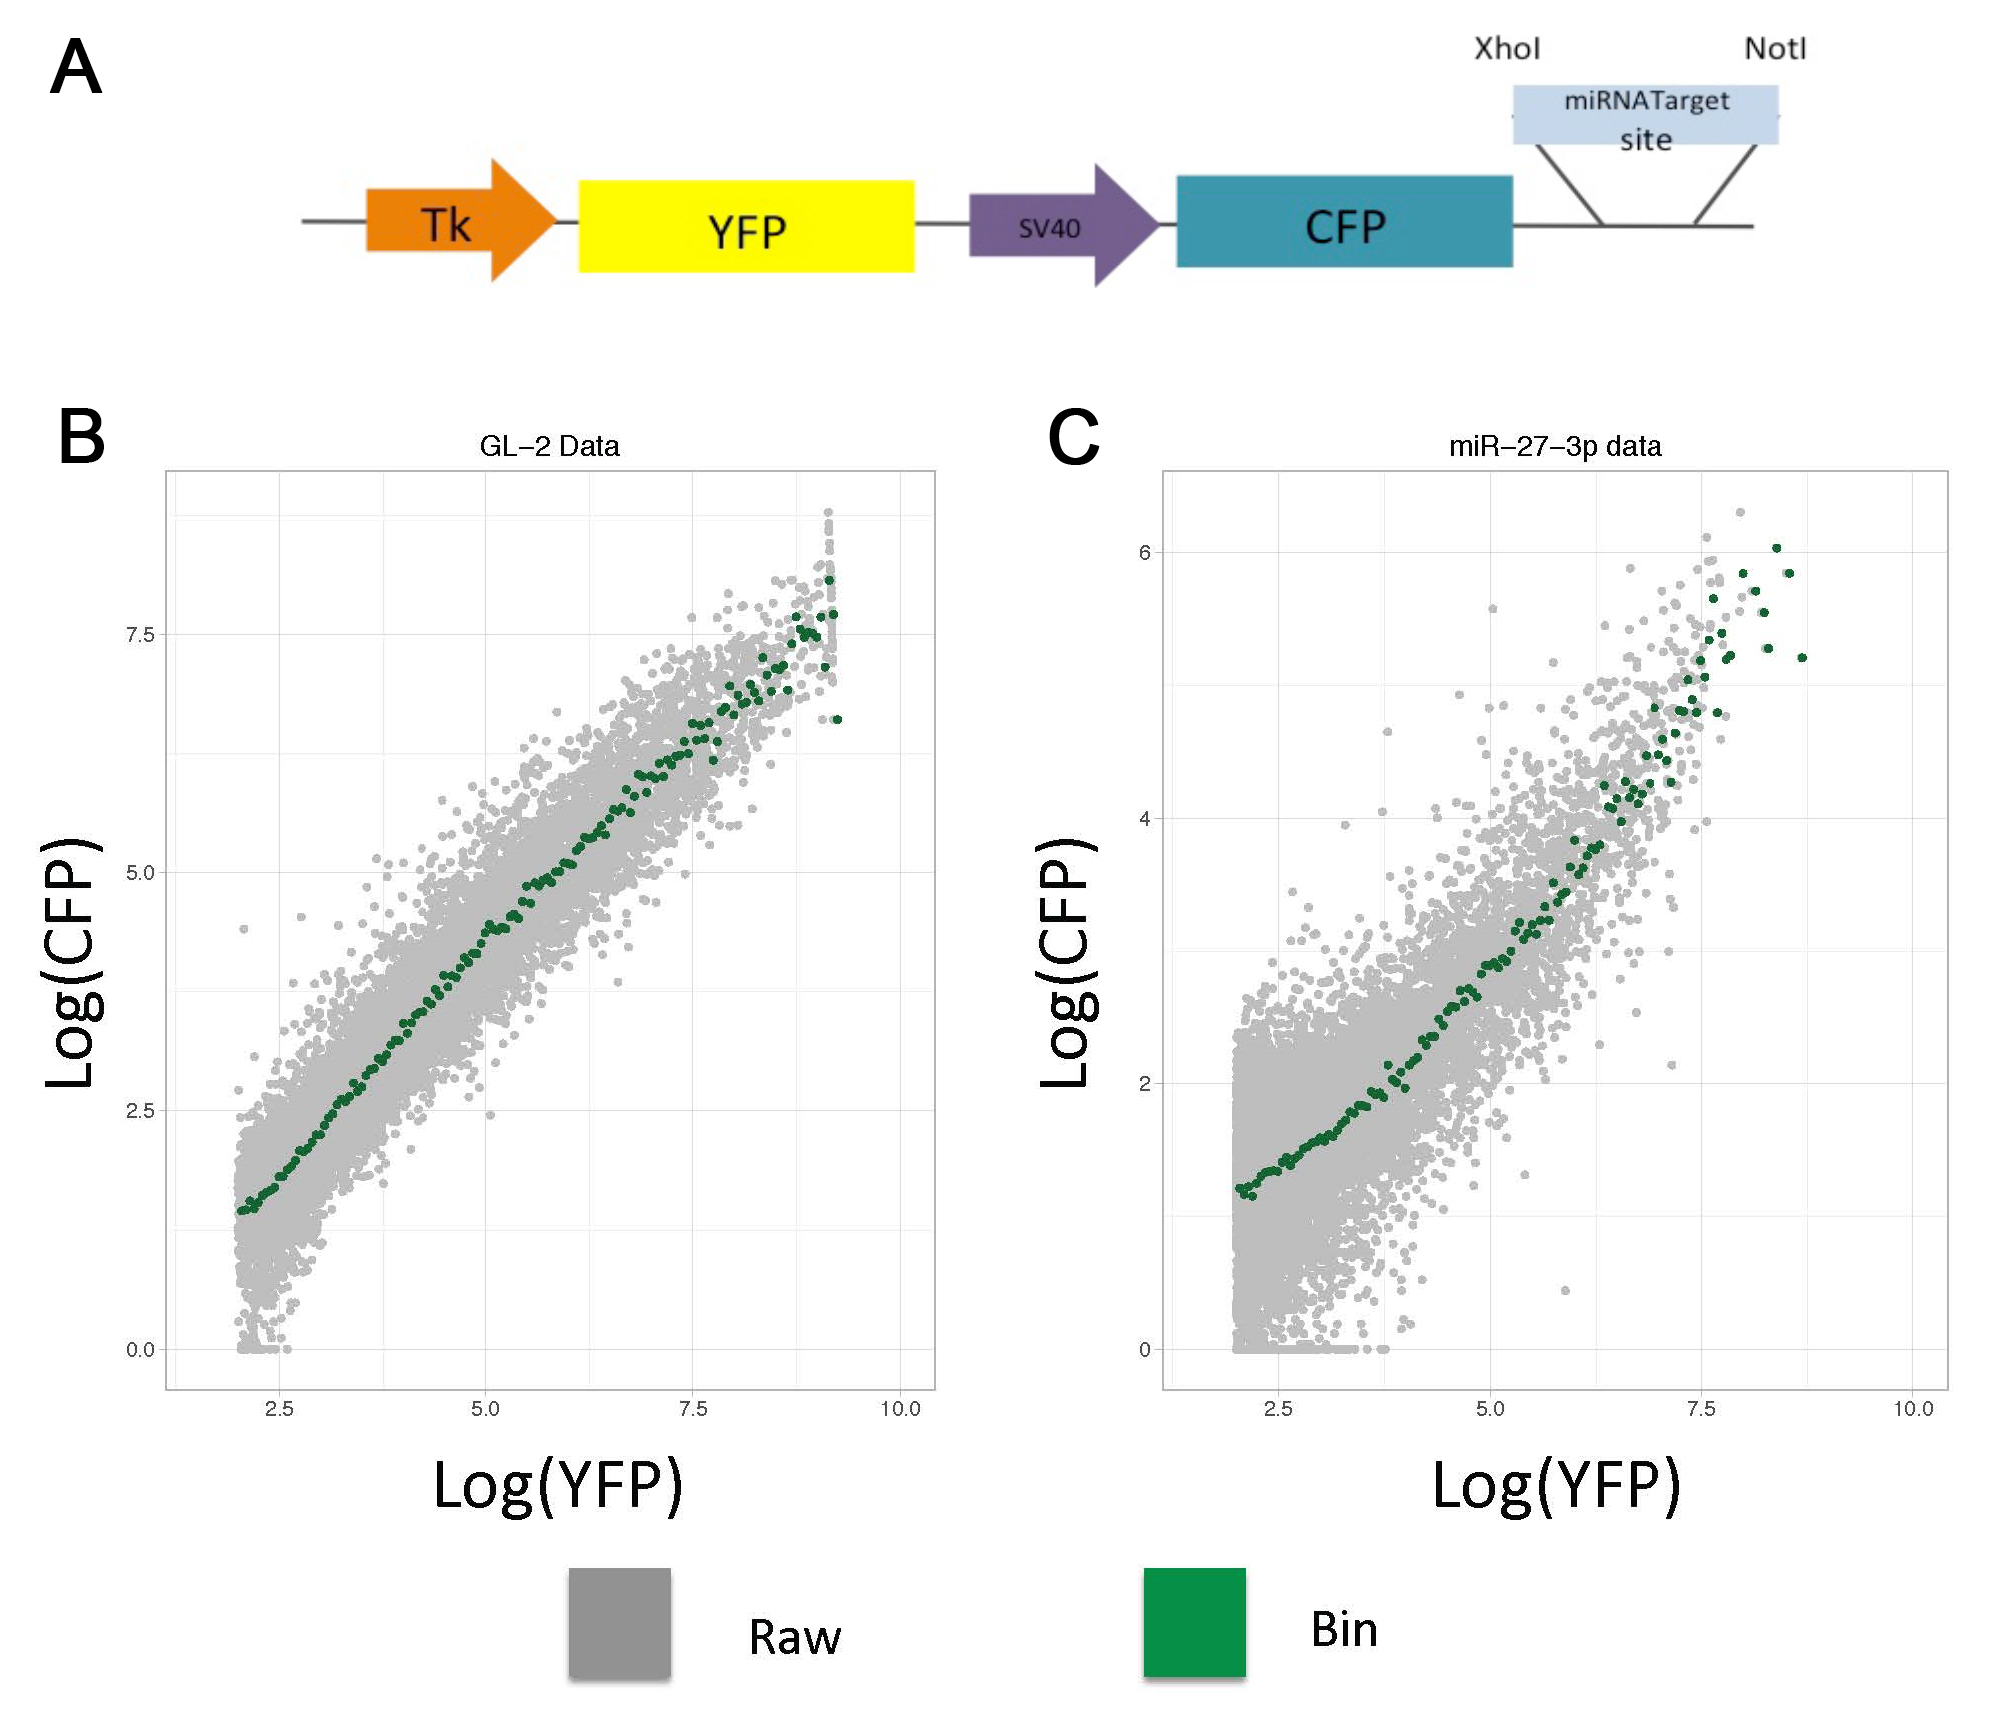
Figure 1. Dual fluorescence-reporter analytical flow cytometry. A. The plasmid contains two fluorescent proteins (YFP and CFP) with two constitutive promoters and a miRNA response element. B and C. To generate analytical functions using raw cytometry data (Grey dots), the YFP relative intensities are binned at 0.05 intervals, and the average CFP intensity per bin is calculated (Green dots). Transfection of HEK 293 with two constructs: (B) Non-cognate and (C) miR-27-3p targeted insert.
Materials and Reagents
- Plasmids, primers and cells
- Other materials
- Pipette tips
- 1,000 μl Filter Tips (SARSTEDT, catalog number: 70.762.211 )
- 100 μl Filter Tips (SARSTEDT, catalog number: 70.760.212 )
- 10 μl Filter Tips (SARSTEDT, catalog number: 70.1116.210 )
- 1.5 ml microfuge tubes (Eppendorf, catalog number: G_0030108116 )
- 2.0 ml microfuge tubes (SARSTEDT, catalog number: 72.695.200 )
- 24-well plates (Greiner Bio One International, catalog number: 662160 )
- 5 ml Ploystyrene Round-Bottom Tube (Corning, Falcon®, catalog number: 352052 )
- PCR tubes 0.2 ml (SARSTEDT, catalog number: 72.737.002 )
- Parafilm (Sigma-Aldrich, Bemis, catalog number: P7793-1EA )
- HEK293 Human embryonic kidney cell line (ATCC, catalog number: CRL-1573TM )
- One Shot® TOP10 Chemically Competent Escherichia coli (Thermo Fisher Scientific, catalog number: C404010 )
- Sense and antisense strands of oligonucleotides (more information below)
- Gel extraction kit (QIAquick gel extraction kit, QIAGEN, catalog number: 28704 )
- GibcoTM Opti-MEMTM (+ L-Glutamine, + phenol red) (Thermo Fisher Scientific, catalog number: 31985047 )
- Lipofectamine® 2000 (Thermo Fisher Scientific, catalog number: 11668027 )
- NotI restriction enzyme (New England Biolabs, catalog number: R0189S )
- XhoI restriction enzyme (New England Biolabs, catalog number: R0146S )
- EcoRI (New England Biolabs, catalog number: R0101S )
- HindIII (New England Biolabs, catalog number: R0104S )
- Plasmid DNA Midiprep kit (QIAquick Plasmid Midi Kit, QIAGEN, catalog number: 10023 )
- QIAprep Spin Miniprep Plasmid mini kit (QIAGEN, catalog number: 27104 )
- Paraformaldehyde 4% solution (Santa Cruz Biotechnology, catalog number: sc-281692 )
- T4 DNA ligase kit (New England Biolabs, catalog number: M0202S )
- T4 Polynucleotide kinase (PNK) (New England Biolabs, catalog number: M0201S )
- Agarose (Carl Roth, catalog number: 3810.3 )
- PBS (PAN-Biotech, catalog number: P04-36500 )
- Trypsin-EDTA (PAN-Biotech, catalog number: P10-023100 )
- DMEM (Thermo Fisher Scientific, Life Technologies, catalog number: 41965062 )
- Fetal Bovine Serum (Thermo Fisher Scientific, Life Technologies, catalog number: 10500-064 )
- Pipette tips
Equipment
- Pipettes
- Fridge
- Agarose gel electrophoresis chamber
- BD LSR II Flow Cytometer (BD, model: LSR II )
- YFP: Laser 488 nm and 550LP-BP575/26 filters
- CFP: Laser 408 nm and BP450/50 (Pacific Blue)
- Benchtop refrigerated microcentrifuge (Thermo Fisher Scientific, model: HeraeusTM FrescoTM 21 , catalog number: 75002555)
- Universal Centrifuge (Thermo Fisher Scientific, model: HeraeusTM MegafugeTM 16 , catalog number: 75004230; Rotor: Thermo Fisher Scientific, model: TX-150, catalog number: 75005701 )
- Gel documentation system (INTAS Gel iX Imager) (INTAS Science Imaging Instruments, model: FACE )
- NanoDropTM 2000 (Thermo Fisher Scientific, model: NanoDropTM 2000 , catalog number: ND-2000)
- Thermoblock (Eppendorf, model: ThermoStat Plus , catalog number: 5352 000.010)
- Thermocycler (Labcycler Sensoquest)
- Vortexer (Scientific Industries, model: Vortex-Genie 2 , catalog number: SI-0236)
Software
- BD-FACSDIVA (BD Biosciences)
- R (https://www.r-project.org)
- R studio (https://www.rstudio.com)
- Bioconductor (https://www.bioconductor.org)
- Serial Cloner (http://serialbasics.free.fr/Serial_Cloner.html)
Procedure
文章信息
版权信息
© 2018 The Authors; exclusive licensee Bio-protocol LLC.
如何引用
Lemus-Diaz, N., Tamon, L. and Gruber, J. (2018). Dual Fluorescence Reporter Based Analytical Flow Cytometry for miRNA Induced Regulation in Mammalian Cells. Bio-protocol 8(17): e3000. DOI: 10.21769/BioProtoc.3000.
分类
分子生物学 > RNA > RNA 干扰
细胞生物学 > 基于细胞的分析方法 > 流式细胞术
您对这篇实验方法有问题吗?
在此处发布您的问题,我们将邀请本文作者来回答。同时,我们会将您的问题发布到Bio-protocol Exchange,以便寻求社区成员的帮助。