

Electron Tomography to Study the Three-dimensional Structure of Plasmodesmata in Plant Tissues–from High Pressure Freezing Preparation to Ultrathin Section Collection
采用电子断层摄影术研究植物组织中的胞间连丝的三维结构 — 从高压冷冻制备到超薄切片采集

发布: 2018年01月05日第8卷第1期 DOI: 10.21769/BioProtoc.2681 浏览次数: 10256
评审: Anonymous reviewer(s)
参见作者原研究论文
The authors used this protocol in:
May 2017
Advertisement


Abstract
Plasmodesmata (PD) are nanometric (~20 nm wide) membrane lined pores encased in the cell walls of the adjacent plant cells. They allow the cells to exchange all types of molecules ranging from nutrients like sugar, hormones, to RNAs and various proteins. Unfortunately, they are also hijacked by phyto-viruses, enabling them to spread from cell-to-cell and then systematically throughout the whole plant. Their central position in plant biology makes it crucial to understand their physiology and especially link their function to their structure. Over the past 50 years, electron microscopists have observed them and attempted to ultrastructurally characterize them. They laid the foundation of what is known about these pores (Tilney et al., 1991; Ding et al., 1992; Oparka and Roberts, 2001; Nicolas et al., 2017a).
Despite the explosion of three-dimensional electron microscopy (3D-EM), PD ultrastructure remained recalcitrant to such technique. The first technical difficulty is to process them in such a way where they are as close to their native state as possible. Secondly, plant samples reveal themselves as being difficult to process due to the poor staining/fixating reagents penetration rates, their increased size, their high water content and the presence of an acidic vacuole. On top of this, their very unique position in the cell wall and their nanometric size make them difficult to conveniently stain in order to see the inner-workings of these pores.
Here we describe in detail the protocol used in Nicolas et al. (2017b) to image PD in fine detail and produce high-resolution tomograms.
Background
High Pressure Freezing (HPF) relies on the vitrification of the water present in the sample. By cooling down the sample at a high enough freezing rate (104-105 °C/sec), its contained water molecules cannot reorganize in a crystal-fashion and remain vitrified in an amorphous state (see Dubochet [2007] for further reading on the physics behind water crystallization). The sample is then said to be ‘cryoimmobilized’ or ‘vitrified’. This is generally achieved by the use of liquid nitrogen (-195 °C) or liquid ethane (-188 °C). At ambient pressure, this phenomenon can only be achieved on a few microns (< 5 microns), however by raising the pressure to approximately 2,000 bars (~2,000 atmospheres), this depth can reach at least 200 microns (up to 500 microns in certain conditions). This allows the vitrification of thick biological tissues without any osmotic artefacts.
Classically, HPF is followed by Freeze Substitution (FS). This step comprises staining, dehydration and resin embedding of the sample. The good success of the FS is critical for the final sub-cellular preservation state of the sample and will be dependent upon the staining agents used, their concentration and also the temperature kinetic followed during the different stages of FS. These parameters are key for adequate fixation and cross-linking of cellular components, the proper staining (not too little nor too much) and embedding, and heavily impact the final resolution reached. Although this protocol is a good starting point, depending on the samples (tissues, developmental stage, plant species) and organelles of interest, it will need to be adapted to the reader’s specific task.
Despite published FS protocols custom tailored for plant samples have yielded spectacular results over the past decades (Donohoe et al., 2006; Kang et al., 2011), in our hands, it was not suitable for the study of PD ultrastructure for two reasons: i) The epoxy resin used in such protocols is highly electron-scattering and generates a bad signal to noise ratio when imaged with a 120 kV electron microscope, subsequently preventing us from clearly imaging the internal details of the nanometric pores (Figure 1A). ii) The elements inside the pores are so tightly packed in such a small space (< 10 nm) that heavy staining activity during FS prevents clear imaging of these elements (Figure 1A).
In this context, we opted for HPF followed by a modified FS course to prepare our samples (Figure 1C and Table 1). This led to the production of high resolution tomograms, enabling the appreciation of PD ultrastructure in all dimensions of space. We hope our readers find this protocol useful and will eventually improve it for better visualization of nanometric membrane details in thick plant samples.
Table 1. Comparative cryofixation procedures between Donohoe et al. (2006) and Nicolas et al. (2017b). Left table recapitulates dehydration + fixation steps and right table the resin-embedding step. Cells marked in blue represent temperatures below 0 °C and cells marked in orange represent temperatures above 0 °C.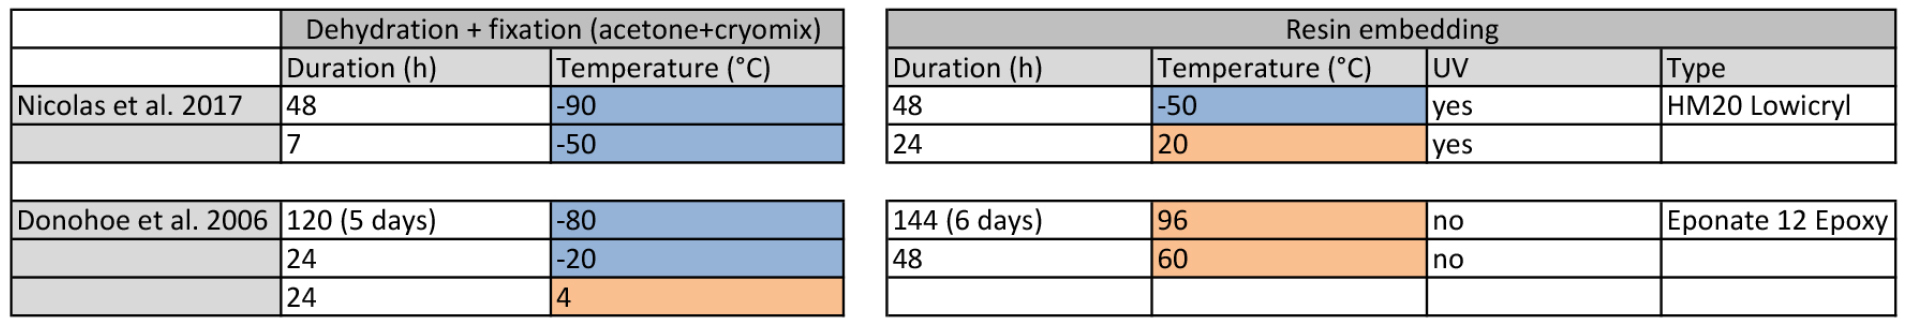
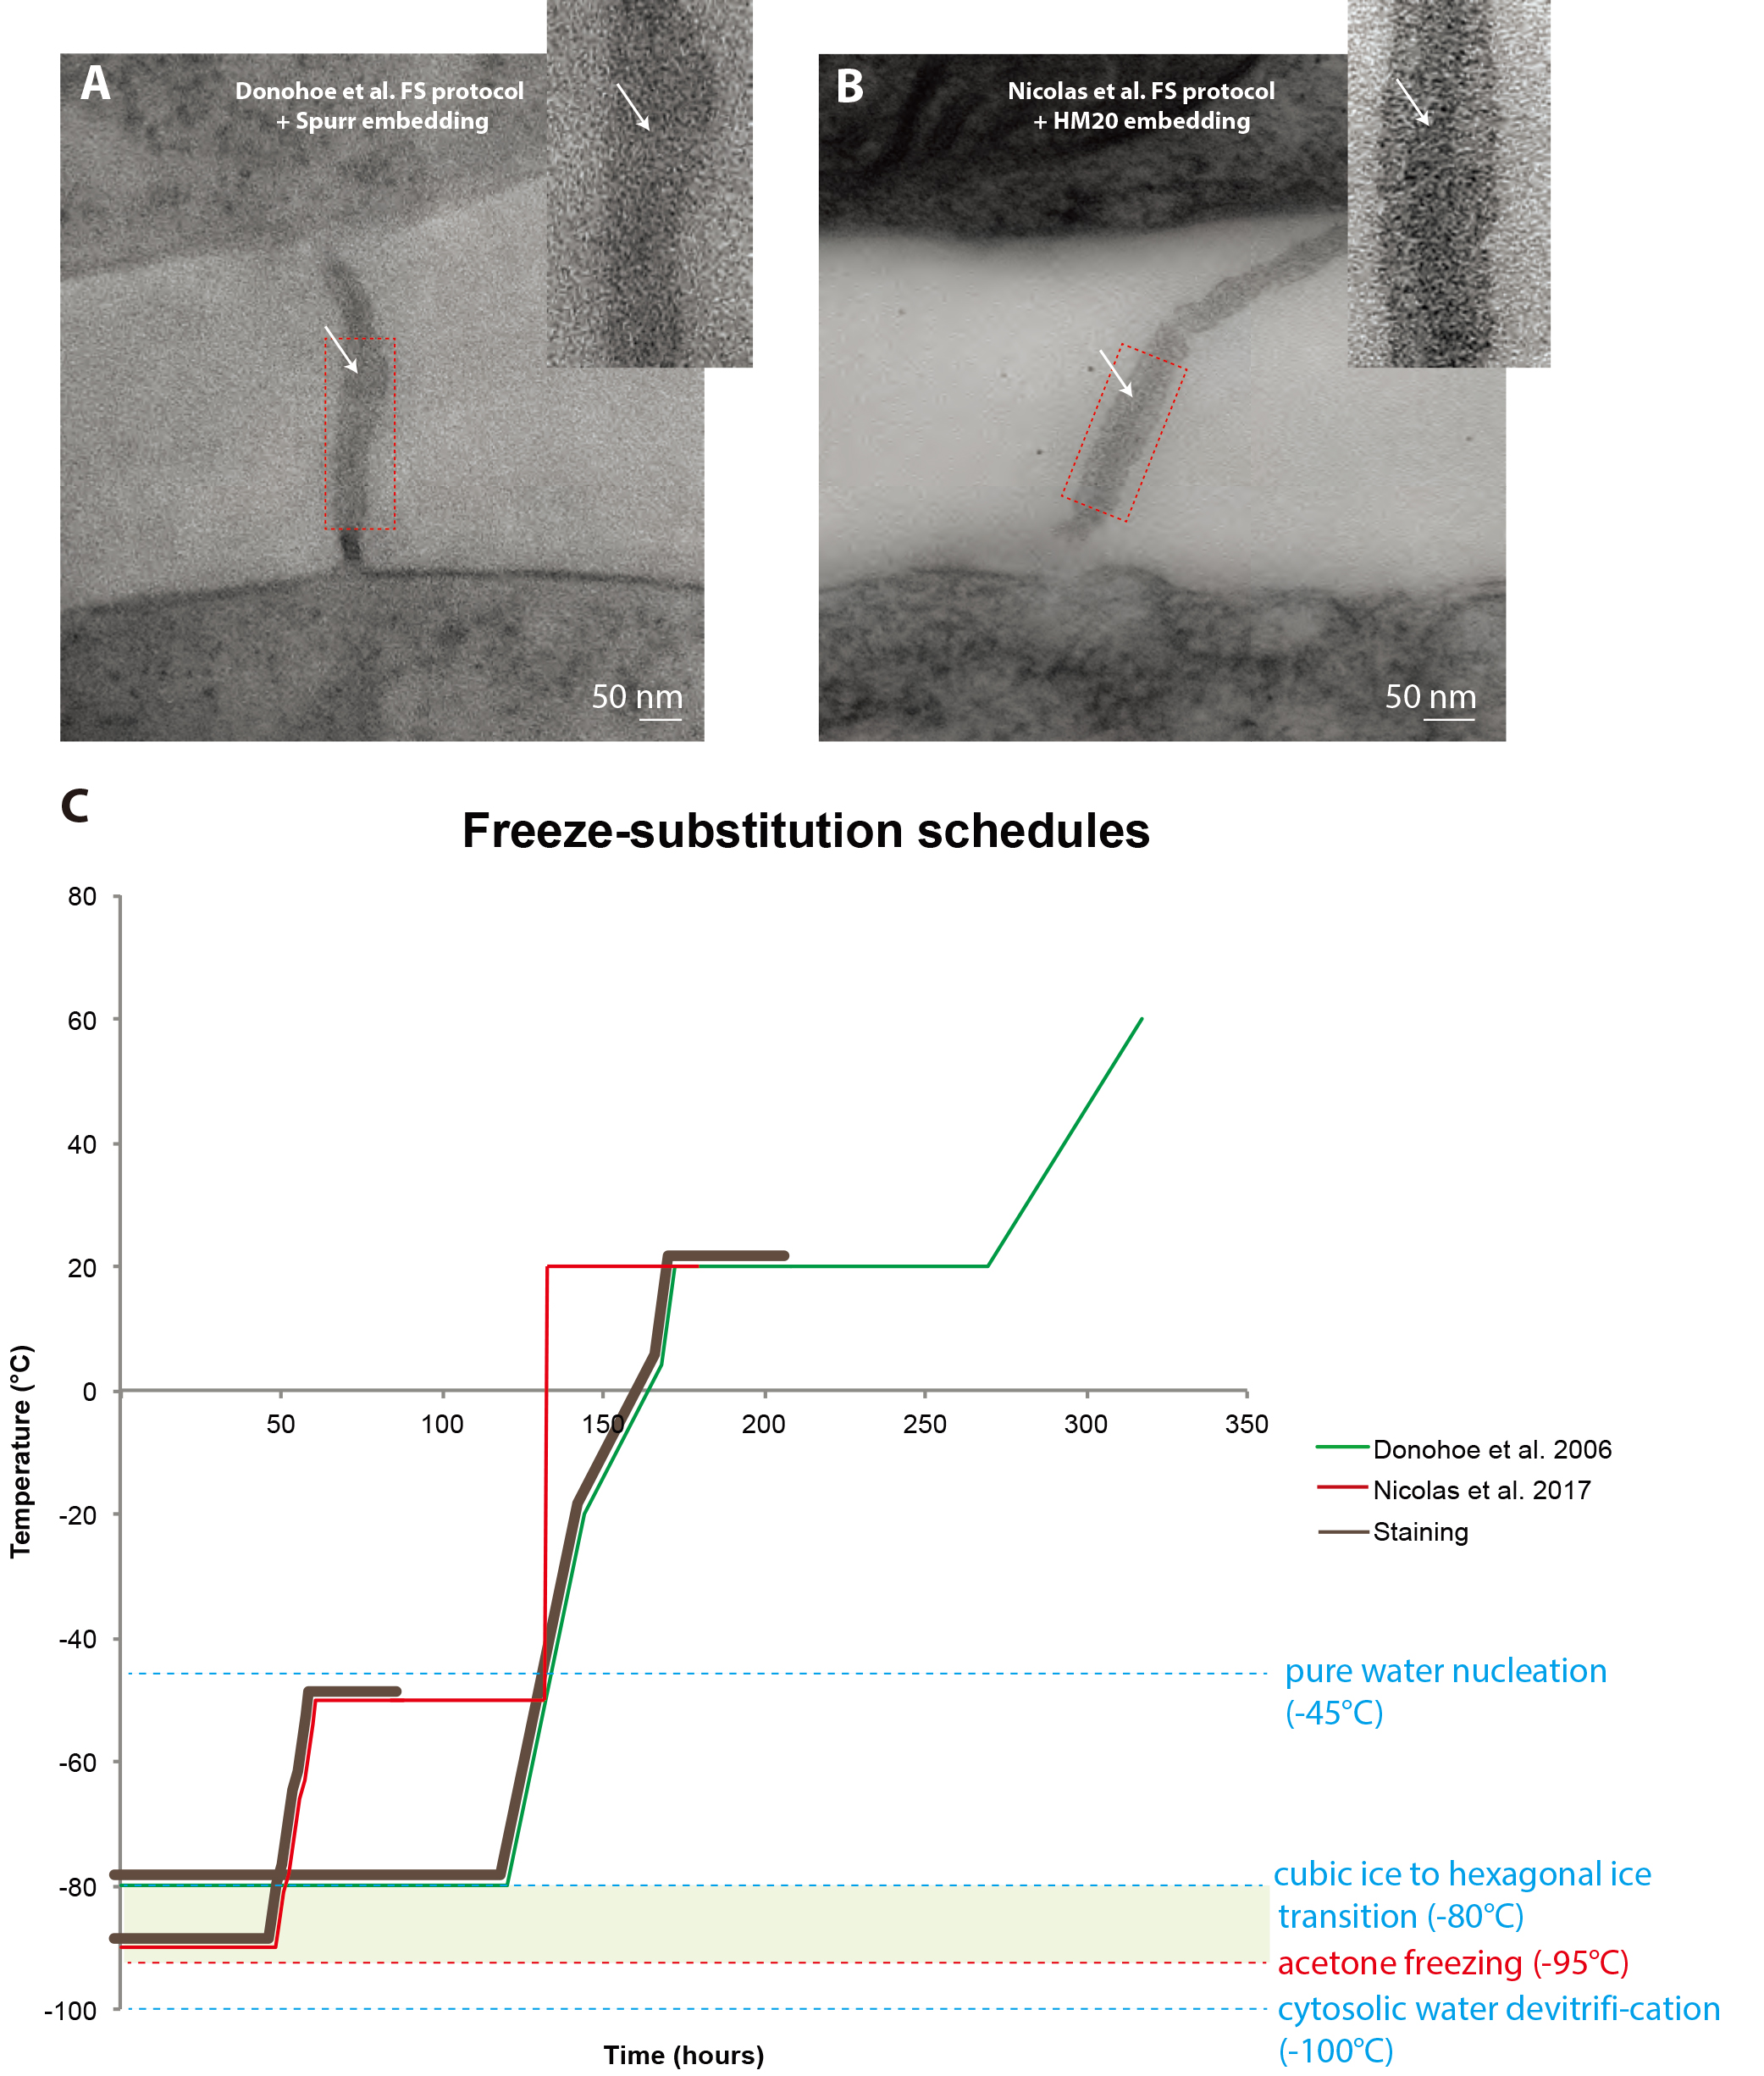
Figure 1. Comparison between freeze-substitution protocols. A. Root tip plasmodesma micrograph acquired from a 90 nm thick section prepared with the regular cryosubstitution protocol (Donohoe et al., 2006). The central element (white arrows) is barely visible, the membrane bilayers are not as lightly stained as in (B) and the overall signal-to-noise ratio is low. B. 2D micrograph of a plasmodesma situated in the root tip acquired at a 0° tilt from a 180 nm thick section prepared with our improved cryosubstitution protocol. Despite the thickness of the section, details in the vicinity of the pore are discernible, notably the central element (white arrows). Dense material can be seen in the cytoplasmic sleeve space. Insets show a close-up view of the red-boxed region ns. C. This temperature versus time curve depicts the commonly used freeze substitution schedule and the one we developed. Brown sections of the curve correspond to when the sample is submerged in the cryosubstitution cocktail containing the highly reactive staining agents. Green zone corresponds to the ideal area for the frozen hydrated samples, below which hexagonal ice cannot form and acetone won’t freeze at atmospheric pressure (between -95 °C and -80 °C). In Donohoe et al., 2006 (green curve) the samples remain in the cocktail for a prolonged amount of time, until the temperature reaches 20 °C. In our protocol (red curve, Nicolas et al., 2017b) the cocktail is removed from the sample very early on in the process when the temperature is at -50 °C.
Materials and Reagents
- Plant material
- Square plastic culture plates for Arabidopsis seedlings vertical culture (VWR, catalog number: 391-0444 )
- MS medium + vitamins (Duchefa Biochemie, catalog number: M0222.0050 ) for seedlings and cell cultures
- Sucrose (Sigma-Aldrich, catalog number: 84100 )
- 2-(N-morpholino)ethanesulfonic acid (MES) (Euromedex, catalog number: EU0033-A )
- Naphthaleneacetic acid (NAA) stock solution (10 mg/ml aliquoted at -20 °C) (Sigma-Aldrich, catalog number: N064025G )
- Kinetin hormone stock solution (1 mg/ml aliquoted at -20 °C) (Sigma-Aldrich, catalog number: K3253 )
- 1 N KOH (for pH)
- MES (Euromedex)
- Plant agar (Duchefa Biochemie, catalog number: P1001.1000 )
- Culture mediums for cells and seedlings (see Recipe 1)
- Murashige and Skoog medium for liquid cultured cells
- Murashige and Skoog medium for seedlings
- Murashige and Skoog medium for liquid cultured cells
- Square plastic culture plates for Arabidopsis seedlings vertical culture (VWR, catalog number: 391-0444 )
- High pressure freezing (Figure 2A)
- Aclar sheet, 51 µm thick (Electron Microscopy Sciences, catalog number: 50426 )
- Cryotubes (VWR, catalog number: 479-1207 )
- Eppendorf 1.5 ml tubes (SARSTEDT, catalog number: 72.708 )
- 15 ml Falcon tube (SARSTEDT, catalog number: 62.553.542 )
- Tooth picks
- BSA fraction V (Sigma-Aldrich, old catalog number: 85040C, now catalog number: 05482 )
- Liquid MS medium
- MethylCycloHexane (MCH) (Merck Schuchardt OHG 85662 Hohenbrunn, Germany)
- BSA solution for cryoprotection during HPF (see Recipe 2)
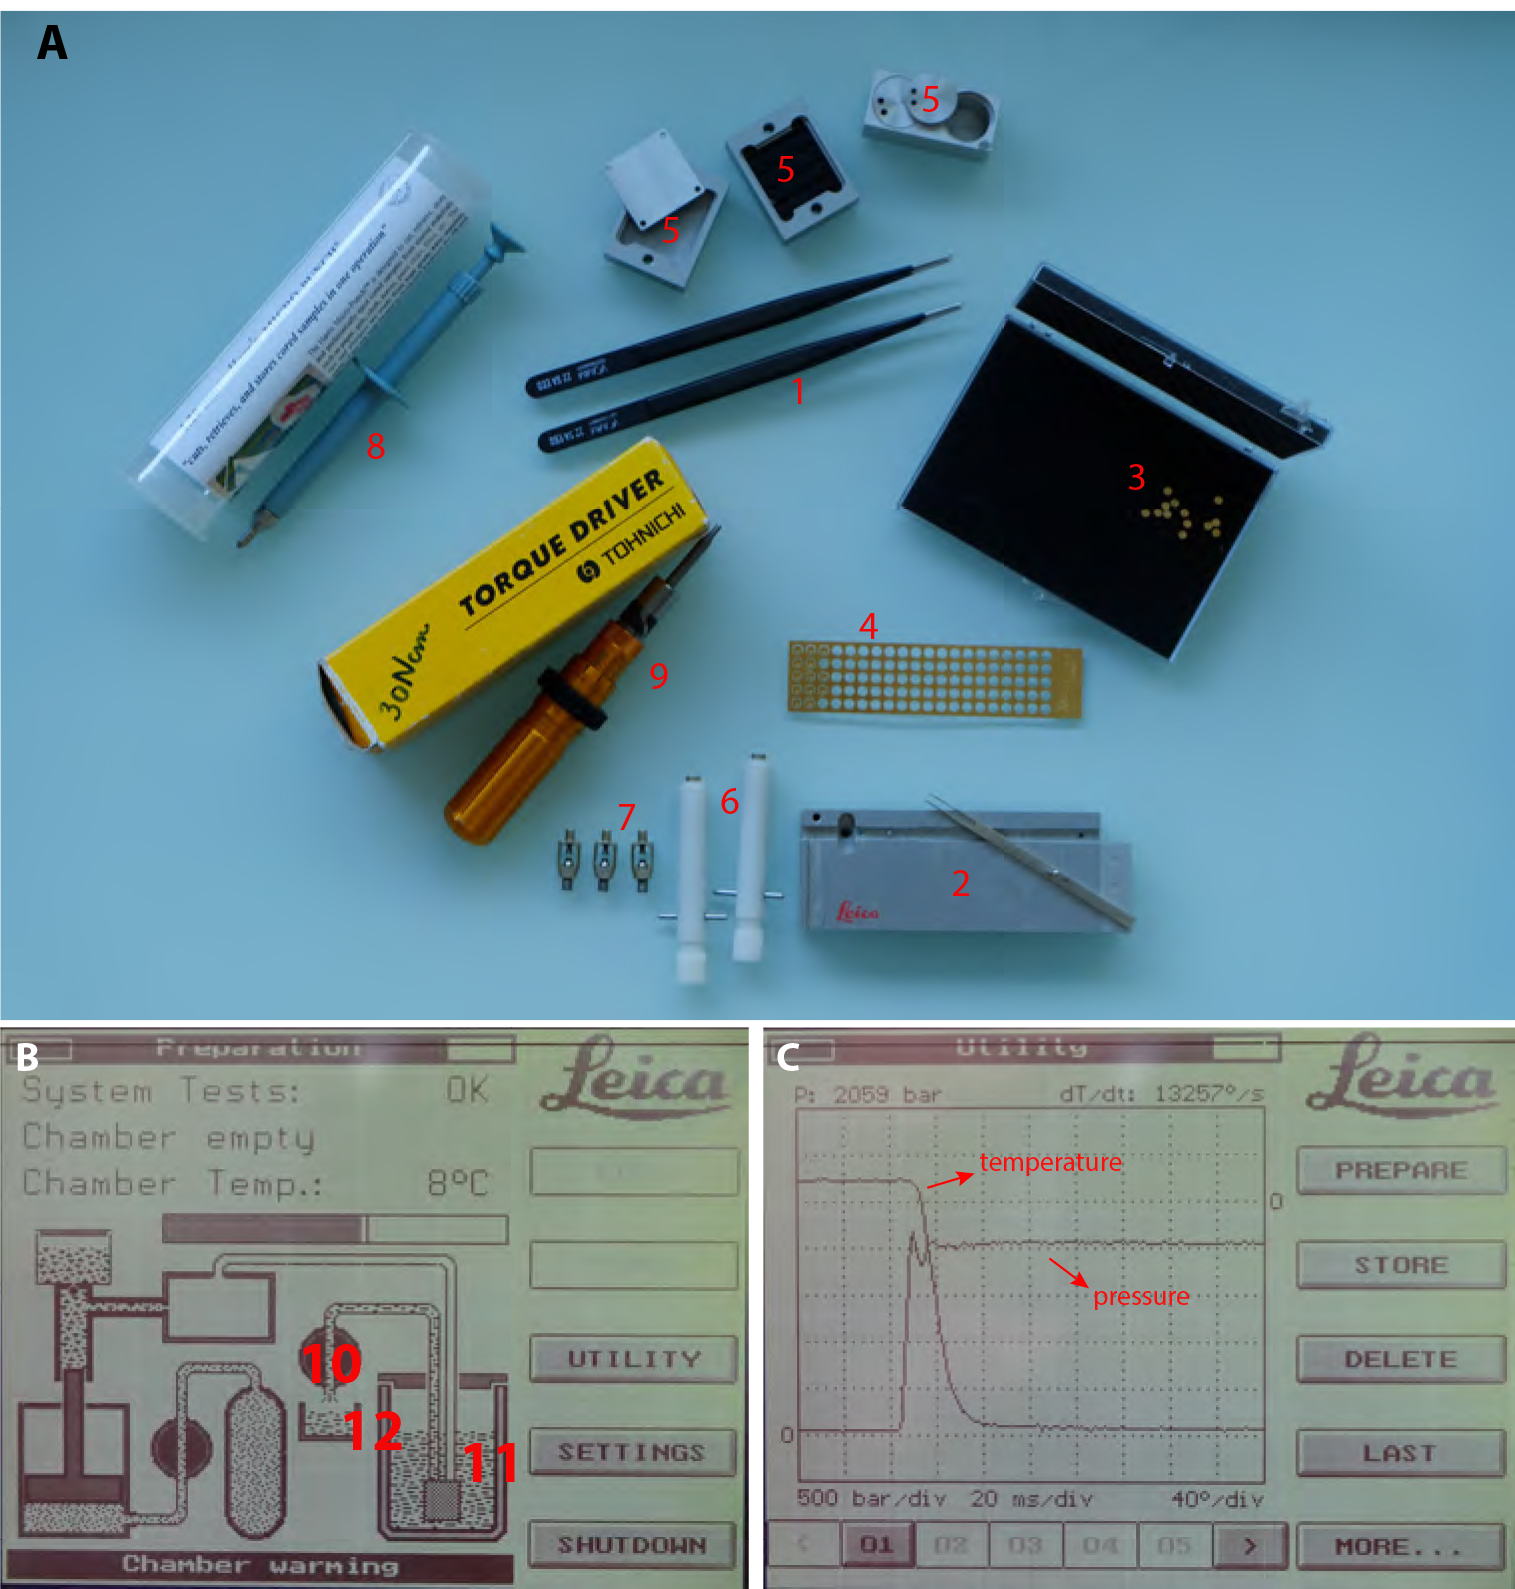
Figure 2. High Pressure Freezing procedure. A. 1. Insulated tweezers for manipulation in liquid nitrogen bath. 2. Leica loading system (see Video 1 for loading procedure) with its associated platelet holder rod. 3. 200 µm deep, 1.5 mm diameter, copper platelets. 4. 100 µm deep, 1.5 mm membrane carriers, copper membrane carriers. 5. Sample transfer metal containers. 6. Pod holder. 7. Pods. 8. Harris puncher for production of the 1.5 mm diameter aclar disks to be optionally laid at the bottom of the 200 µm deep platelets to facilitate the later separation of the sample. 9. Torque screwdriver for tightening the membrane carrier in the pods (#3, 4 and 5 respectively). B. View of the EMPACT1 touchscreen displaying the status of the machine. (10) is the valve controlling liquid nitrogen flux from the main tank (11) to the liquid nitrogen bath (12). C. View of the display after processing a sample. Curve dropping down is temperature and curve rising up is pressure.
- Aclar sheet, 51 µm thick (Electron Microscopy Sciences, catalog number: 50426 )
- Freeze substitution (Figure 3)
- Screw top 2 ml tubes (SARDTEDT, catalog number: 72.693 )
- Disposable regular pipets 1.5, 2 and 3 ml and FS specific 1 ml with thin tips (Ratiolab, catalog number: 2600155 )
- Wheaton glass sample vials with snap-cap for cryomix preparation (DWK Life Sciences, WHEATON, catalog number: 225536 .)
- Personal cartridge half mask 6100 (Honeywell International, catalog number: 1029471 )
- Plastic coffins or pills Leica molds (AFS2 consumable, Leica, catalog numbers: 16707155 and 16707157 respectively)
- Plastic solvent containers with screw tops (Leica, catalog number: 16707158 )
- Tinfoil
- Uranyl acetate powder (Merck, catalog number: 8473 )
- Pure methanol
- Glutaraldehyde 10% EM-grade anhydrous solutions in acetone (Electron Microscopy Sciences, catalog number: 16530 )
- Ultra pure 100% ethanol and acetone (VWR, catalog numbers: 83813.440 and 20066.558 , respectively)
- Osmium tetroxide vials 0.1 g (Electron Microscopy Sciences, catalog number: 19134 )
- Nail polish (color does not matter)
- Cryosubstitution Uranyl-acetate stock solution (20%) (see Recipe 3)
- Cryosubstitution mix (see Recipe 4)
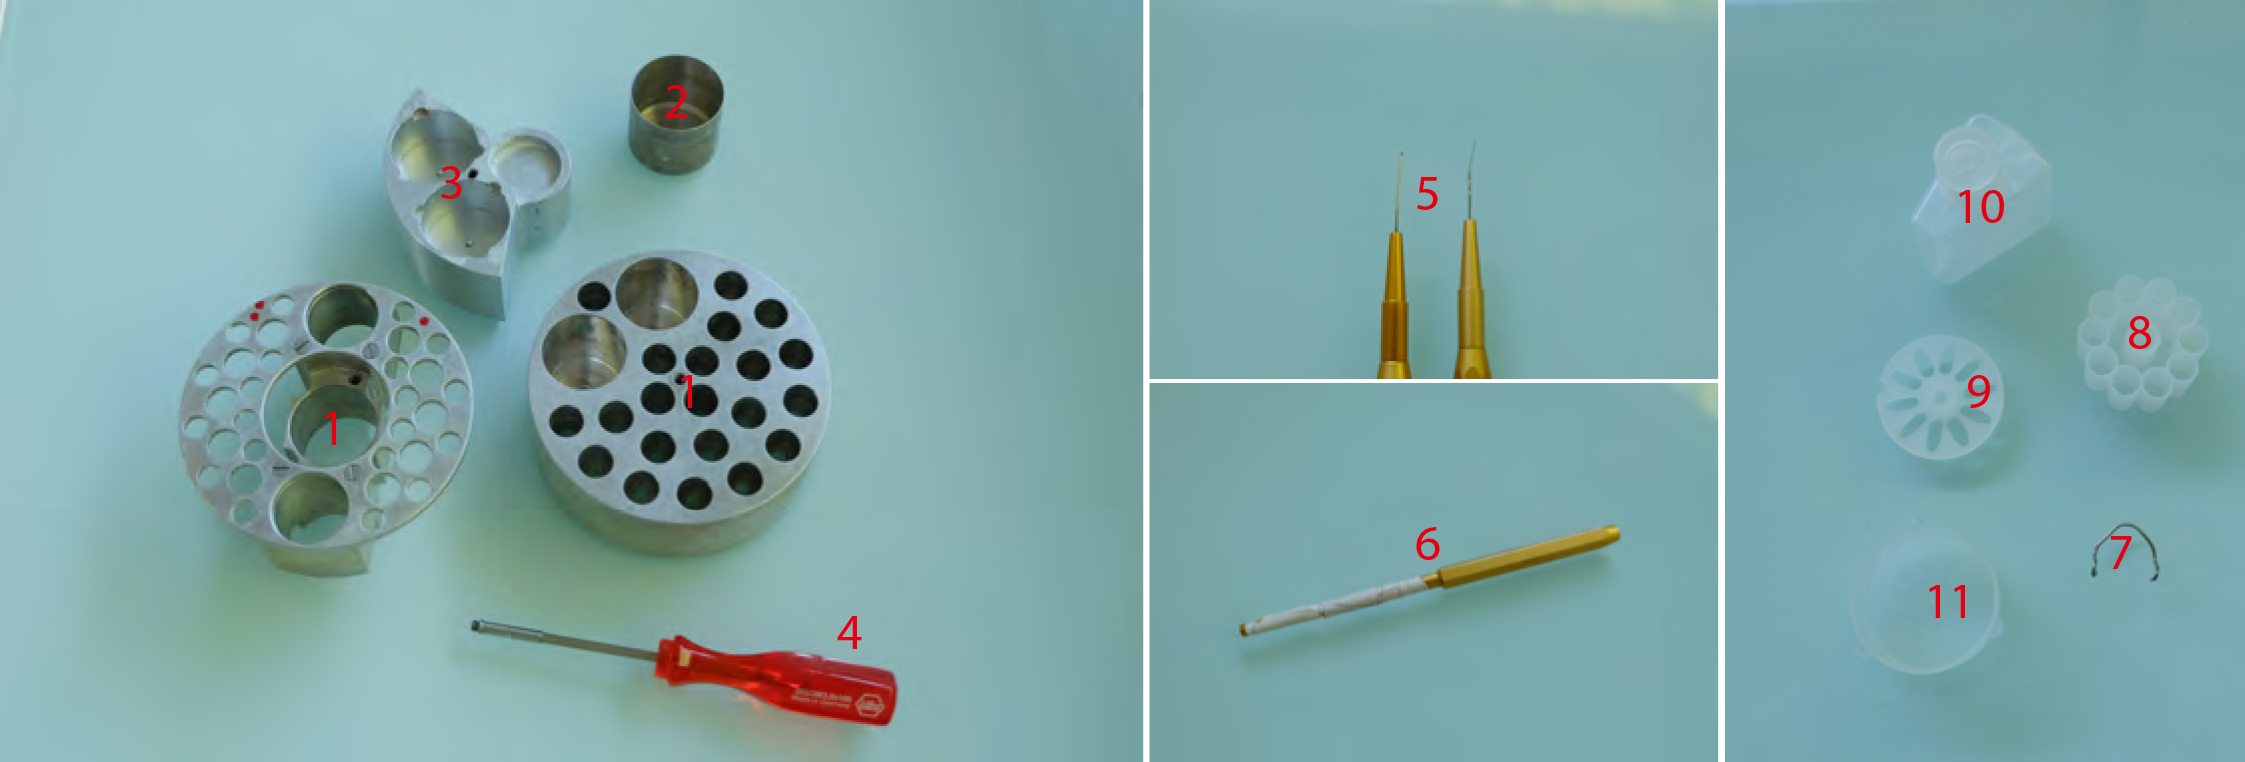
Figure 3. Freeze substitution procedure. 1. AFS tube holders. The one on the right being made according to Heinz Schwarzes blueprints (heinz.schwarz@tuebingen.mpg.de). 2. Metal cups for holding cryomix tubes. 3. Metal socket for mould containers for resin polymerization. 4. Screwdriver used to transfer tube holders 1 and 2 and sample transfer containers shown in Figure 1 (#5). 5. EMS micro-needle and Ted Pella Inc. ultra-micro-needle tools. 6. Ted Pella Inc. micro-tool adapter. 7. Hand-made tool holder. 8. Leica plastic ‘pill’ mould. 9. Leica plastic ‘coffin’ mould. 10. Plastic solvent container with screw top. 11. Leica plastic mould container.
- Screw top 2 ml tubes (SARDTEDT, catalog number: 72.693 )
- Resin embedding
- HM20 resin (Electron Microscopy Sciences, catalog number: 14345 )
- HM20% solutions (see Recipe 5)
- HM20 resin (Electron Microscopy Sciences, catalog number: 14345 )
- Ultramicrotomy
- Crystalizing dish (Fisher Scientific, catalog number: 11766582 )
Manufacturer: DWK Life Sciences, DURAN, catalog number: 213133408 . - Fast absorbent paper filters (Whatman, Filter papers 41) (GE Healthcare, catalog number: 1441-070 )
- Glass wand (Fisher Scientific, catalog number: 12441627 )
Manufacturer: MBL, catalog number: SRF380 . - Grids with different meshes (200 L/inch and 300 L/inch Delta Microscopy) and slot grids (EMS Formvar Carbon Film 2 x 0.5 mm copper grids lot, Electron Microscopy Sciences, catalog number: EMS200-Cu )
- Paraffin films (Bemis, Parafilm ‘M’)
- Pasteur pipet (VWR, catalog number: 612-1720 )
- 0.2 µm filter
- Syringe
- 0.5 ml Eppendorf tubes
- 5 nm colloidal gold solution (BBI solution, catalog number: EM-GC5 , www.bbisolutions.com)
- Solid parlodion (Electron Microscopy Sciences, catalog number: 19220 )
- Isoamyl-acetate (Sigma-Aldrich, catalog number: W205532 )
- Toluidine blue powder (Sigma-Aldrich, catalog number: T3260 )
- Sodium borate (Sigma-Aldrich, catalog number: B3545 )
- Ultrapure (MilliQ) water
- 2% Parlodion solution for grid filming (see Recipe 6)
- Toluidine blue solution (see Recipe 7) for screening block sections on table top microscope during resin block milling
- Fiducial marker solution (see Recipe 8)
- Crystalizing dish (Fisher Scientific, catalog number: 11766582 )
Equipment
- Plant material
- 200 ml glass flasks for liquid cell culture (Dutscher, catalog number: 232522 )
- Flask shaker to keep liquid cultured cells moving (Digital Shaker, Southwest Science)
- Green room for in vitro cultivation of seedlings and liquid cultured cells (see Recipe 1 for growth conditions)
- 200 ml glass flasks for liquid cell culture (Dutscher, catalog number: 232522 )
- High pressure freezing (Figure 2A)
- Liquid nitrogen, liquid nitrogen container and adapted personal protection gear
- Air compressor (JUN-AIR)
- Leica EMPACT1 machine (Leica Microsystems)
- Leica loading system
- Pod holders
- Pods
- Puncher for aclar disks (Harri’s Micro Punch 1.20 mm)
- Regular biomolecular pipets from 2 µl to 1,000 µl range
- 200 ml flask
- Binocular for root dissection (Nikon, model: SMZ-10A )
- Heating surface for quick drying of Pods and pod holders during the session
- Insulated tweezers for manipulation in N2 (VOMM Germany, 22 SA ESD)
- Little metal scooper for sampling liquid cultured cells
- Membrane carriers (100 µm or 200 µm deep) (Leica Microsystems, catalog numbers: 16707898 and 16706898 respectively)
- Metal containers for frozen sample transfer and associated screw driver for lifting procedures (provided with EMPACT1)
- Torque screwdriver (TOHNICHI, Torque driver RTD60CN) set to 30Ncm
- Liquid nitrogen, liquid nitrogen container and adapted personal protection gear
- Freeze Substitution and resin embedding (Figure 3)
- Leica EM Freeze Substitution Processor (FSP) equipped with UV light (Leica Microsystems)
- Leica Automatic Freeze Substitution 2 (EM AFS2) machine (Leica Microsystems, model: Leica EM AFS2 )
- Hand made tool holders (out of paper clips) for better disposal of the various tools in AFS2 well
- AFS tube holders Metal cups
- Metal socket for mould containers
- Microtools for separating the membrane carriers from frozen samples and disposing samples in the moulds correctly (micro-needle #1 0.025 mm, Electron Microscopy Sciences, catalog number: 62091-01 and tungsten 5 µm ultra-micro needle, Ted Pella, catalog number: 13625 )
- Ventilated hood
- Leica EM Freeze Substitution Processor (FSP) equipped with UV light (Leica Microsystems)
- Ultramicrotomy (Figure 4)
- Petri dishes of various sizes (Dutscher, catalog numbers: 068515 , 068516 , 068517 )
- Various EM grade precision tweezers (EMS style 2, 5, 5X, style 7 https://www.emsdiasum.com/ https://www.dumonttweezers.com)
- Block holders
- Carbon coater (optional) (SPI-MODULE Carbon Coater)
- Diamond knives (DIATOME Trim20 dry, Ultra wet and HISTO wet)
- ELMO Glow discharger (optional) (CORDOUAN Technologies)
- Glass knife maker (LKB BROMMA, model: 7800 Knifemaker )
- Glass knives for first milling steps to reach the sample
- Grid carriers for grid storage
- Leica Ultracut UC7 (Leica Microsystems, model: Leica Ultracut UC7 )
- Razor blades for coarse block preparation
- Table top microscope (Olympus, model: CX-41 )
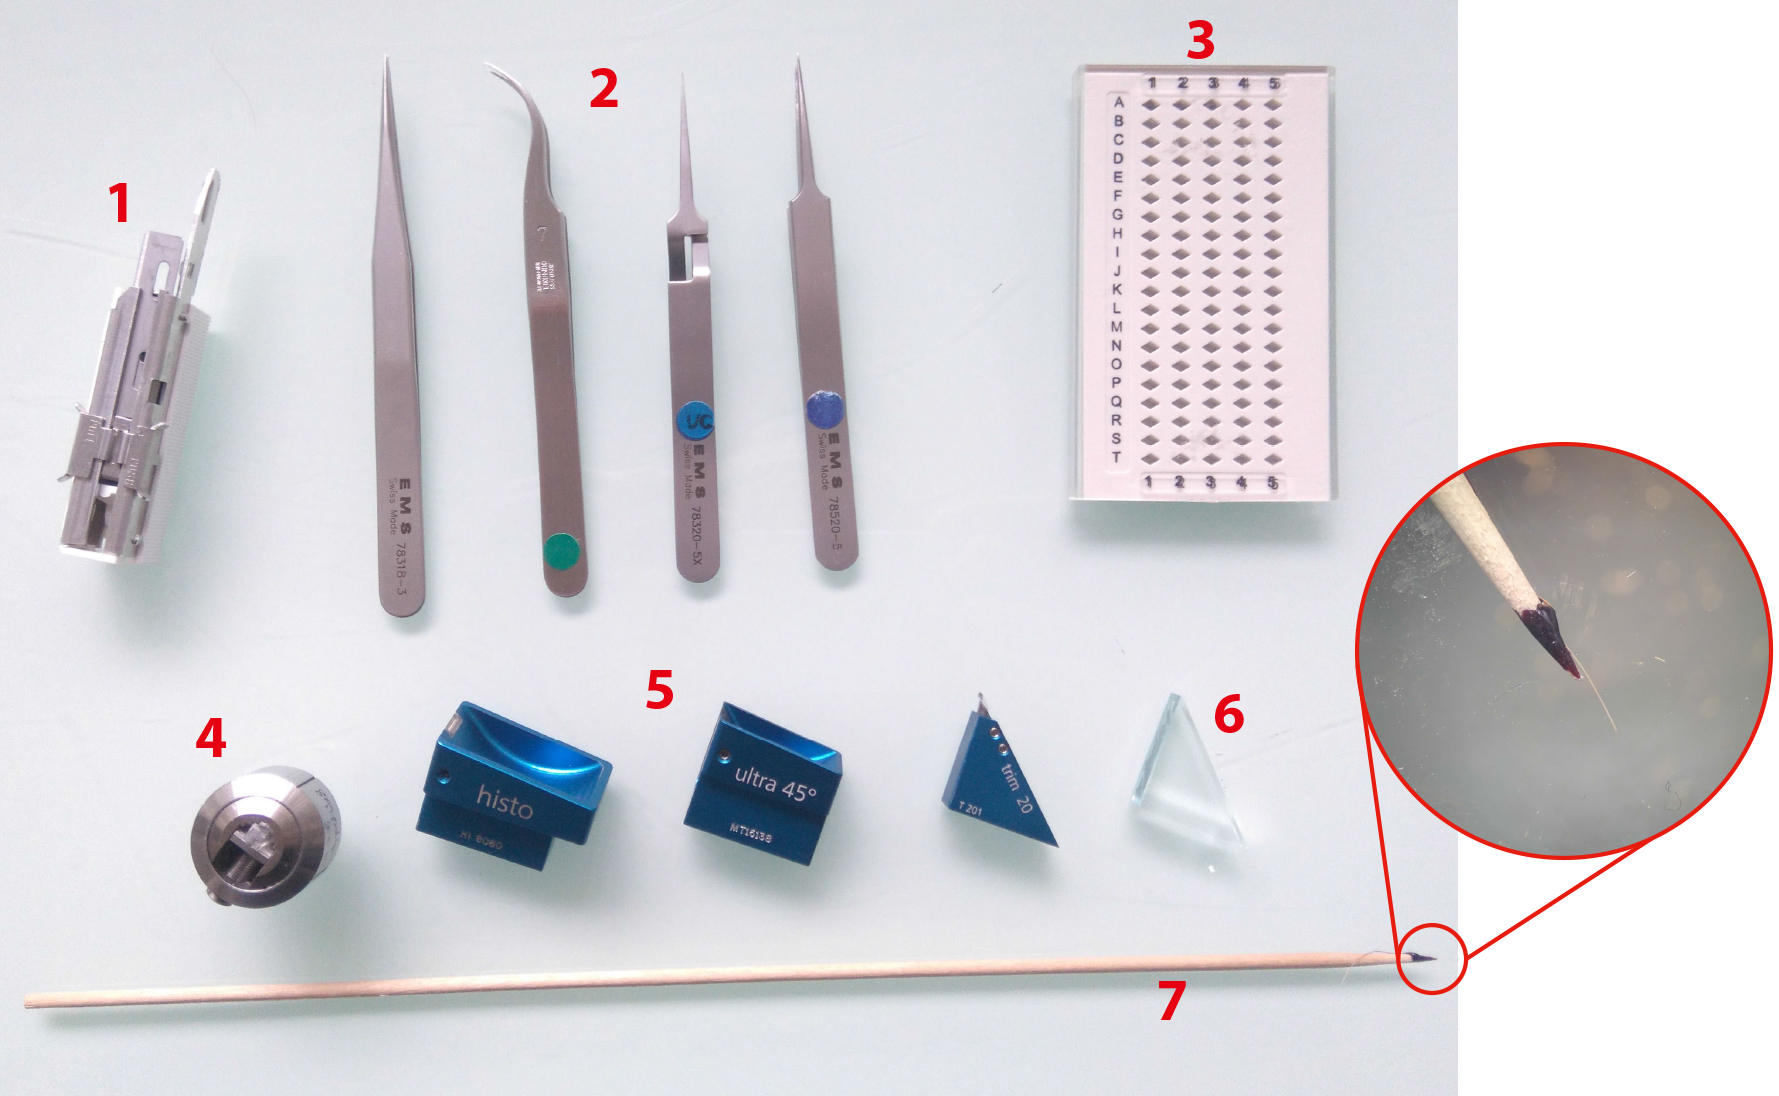
Figure 4. Ultramicrotomy procedure. 1. Sharp razor blades. 2. Tweezers (shapes n°3, 7, 5 and 5X, EMS). 3. Grid holders. 4. Block holders (sold with ultramicrotome, Leica Microsystems). 5. Diamond knives Histo, ultra 45° for section collection and trim 20 dry for precise trimming (from left to right). 6. Glass knife for coarse trimming. 7. Cat whisker mounted on a wooden stick for section gathering during on-grid collection step. Circular inset shows an enlarged view of the cat whisker mounted on the stick using nail polish.
- Petri dishes of various sizes (Dutscher, catalog numbers: 068515 , 068516 , 068517 )
Software
- Tecnai imaging and analysis (TIA) software (https://www.fei.com/software/)
TEM User Interface was used in conjunction with Tecnai Imaging and Analysis (TIA) software to control and acquire micrographies with the EM (https://www.fei.com/software/) - Xplore3D (FEI) was used for automated tilt series acquisitions (https://www.fei.com/software/)
- ImageJ (https://imagej.nih.gov/ij/download.html) with the Input/Output plugin (http://www.cmib.fr/en/download/softwares/input-output.html) were used to readout the .mrc tilt series files and tomograms
- IMOD suite (http://bio3d.colorado.edu/imod/)
Note: All processing was done using the IMOD suite (Kremer et al., 1996) (http://bio3d.colorado.edu/imod/), from the alignment of the raw tilt series to tomogram reconstruction, segmentation and data analysis.
Procedure
文章信息
版权信息
© 2018 The Authors; exclusive licensee Bio-protocol LLC.
如何引用
Nicolas, W. J., Bayer, E. and Brocard, L. (2018). Electron Tomography to Study the Three-dimensional Structure of Plasmodesmata in Plant Tissues–from High Pressure Freezing Preparation to Ultrathin Section Collection. Bio-protocol 8(1): e2681. DOI: 10.21769/BioProtoc.2681.
分类
植物科学 > 植物细胞生物学 > 细胞成像
细胞生物学 > 细胞成像 > 电子显微镜
您对这篇实验方法有问题吗?
在此处发布您的问题,我们将邀请本文作者来回答。同时,我们会将您的问题发布到Bio-protocol Exchange,以便寻求社区成员的帮助。