

DQ-Red BSA Trafficking Assay in Cultured Cells to Assess Cargo Delivery to Lysosomes
在培养细胞中评估物质运输至溶酶体的DQ-Red BSA转运分析法


发布: 2017年10月05日第7卷第19期 DOI: 10.21769/BioProtoc.2571 浏览次数: 26387
评审: Pengpeng LiAnonymous reviewer(s)
参见作者原研究论文
The authors used this protocol in:
Apr 2017


Abstract
Lysosomes are the terminal end of the endocytic pathway having acidic environment required for active hydrolases that degrade the cargo delivered to these compartments. This process of cargo delivery and degradation by endo-lysosomes is a tightly regulated process and important for maintaining cellular homeostasis. Cargos like EGF (Epidermal Growth Factor), Dil-LDL (3,3’-Dioctadecylindocarbocyanine-Low Density Lipoprotein), Dextran, DQ-BSA (Dye Quenched-Bovine Serum Albumin) etc., are routinely used by researchers to analyze the role of various proteins in endocytic pathway. Trafficking of DQ-BSA in cells depleted of or over-expressing the gene of interest is a useful assay for identifying the role of various proteins in endocytic trafficking pathway. The protocol describes the DQ-Red BSA trafficking assay that can be used to study endocytic trafficking in various cell types.
Keywords: DQ-BSA (DQ-BSA)Background
Cells are constantly exchanging materials with their extracellular environment and in this process they internalize cargo in vesicles at the plasma membrane. This internalized cargo is delivered to the early endosomes from where it either goes back to the plasma membrane via recycling endosomes or enters the canonical endocytic pathway. Once destined to be degraded, the cargo moves to late endosomes and finally fuses with lysosomes where the active hydrolases digest the cargo (Jovic et al., 2010). These endocytic compartments have characteristic pH of their lumen. The early endosomes have a pH in the range of 5.9-6.8, late-endosomes have pH range of 4.9-6.0, and lysosomes are most acidic with pH ranging from 4.5-5.0 (Maxfield and Yamashiro, 1987). The acidic environment of lysosomes is necessary for the activity of hydrolases present in its lumen and degradation of cargo (Garg et al., 2011; Khatter et al., 2015a and 2015b).
Here we discuss the trafficking assay using DQ-Red BSA as cargo, which is a BSA (bovine serum albumin) derived cargo heavily labeled with BODIPY TR-X dye, resulting in self quenching of the dye. Degradation of DQ-Red BSA in acidic, hydrolase active endo-lysosomes results in smaller protein fragments that have isolated fluorophores, hence de-quenching the dye that can be visualized as a bright fluorescence in cells. The excitation and emission maxima for this dye are ~590 nm and ~620 nm respectively. Trafficking of DQ-Red BSA can be used to study the delivery of cargo to lysosomes (Pols et al., 2013; Marwaha et al., 2017; see Figure 1). Under normal conditions, DQ-Red BSA traffics to lysosomes and is cleaved by lysosomal hydrolases, resulting in bright red fluorescent signal (Figure 2). Disruption of cargo delivery to lysosomes such as by depletion of a certain gene product or treatment with chemical inhibitors (such as Bafilomycin A) impairs proteolysis of DQ-Red BSA and thus weak or no fluorescence is observed (see Figure 3).
Figure 1. Schematic representation of DQ-Red BSA cargo uptake and processing in cells. DQ-Red BSA is endocytosed in cells and traffics through early endosomes to late endosomes which then fuse with acidic hydrolase containing lysosomes. This leads to the formation of endo-lysosomes that degrade DQ-Red BSA, de-quenching the fluorescence of the dye attached to this cargo. DQ-Red BSA is heavily labeled with fluorescent dyes that lead to quenching of their fluorescence (shown by pink fluorophores attached to the cargo). Once DQ-Red BSA has reached the degradative endo-lysosomes, the cargo is broken down into smaller fragments which lead to the de-quenching of the fluorophores (shown as bright red spots in endo-lysosomes).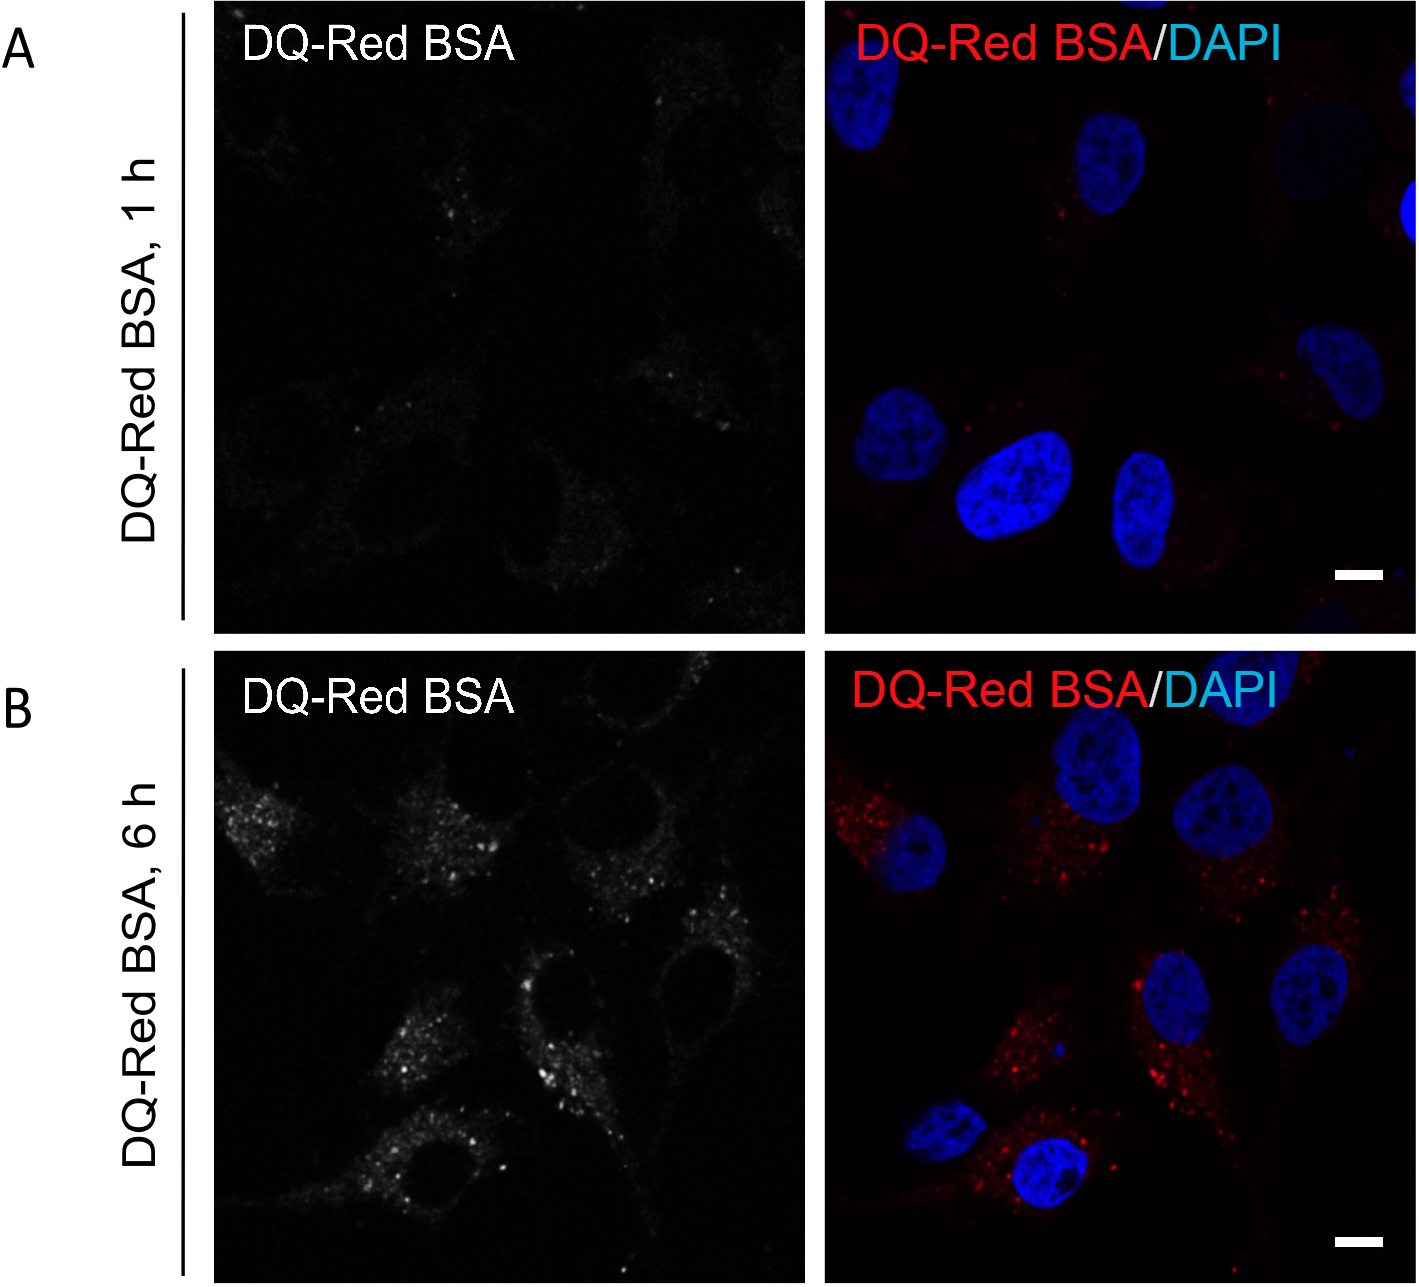
Figure 2. De-quenching of DQ-Red BSA fluorescence at different time points post endocytosis. Representative single-plane confocal micrographs of HeLa cells showing fluorescence (red signal) of DQ-Red BSA after an uptake of 1 h (A) and 6 h (B) time points. At the end of the uptake time point, cells were fixed and stained with DAPI (blue) to mark the cell nucleus. A bright fluorescence punctae of DQ-Red BSA is visible post 6 h uptake as compared to 1 h, indicating its delivery to acidic compartments of the cell. Scale bars = 10 µm.
Figure 3. DQ-BSA uptake and delivery to lysosomes. Representative single-plane confocal micrographs of HeLa cells incubated with DQ-Red BSA in 1% serum containing media for indicated time point in the absence (A) or presence (B) of 100 nM Bafilomycin A1, a V-ATPase inhibitor that disrupts lysosome fusion. The cell nucleus is stained using DAPI (blue). Scale bars = 10 µm.
Materials and Reagents
- Coverglass slips (VWR, catalog number: 89015-725 )
- BD Falcon15 ml centrifuge tubes (Corning, Falcon®, catalog number: 352096 )
- BD Falcon 35 mm cell culture dish (Corning, Falcon®, catalog number: 353001 )
- 24-well plate (Corning, Falcon®, catalog number: 353226 )
- Glass slide (HiMedia Laboratories, catalog number: CG029 )
- HeLa cells (ATCC, catalog number: CCL-2 )
- siRNA (Dharmacon)
- Xtremegene HD transfection reagent (Roche)
- DMEM (Lonza, catalog number: 12-604F )
- NEAA (Thermo Fisher Scientific, GibcoTM, catalog number: 11140050 )
- GlutaMax (Thermo Fisher Scientific, GibcoTM, catalog number: 35050061 )
- HEPES (Thermo Fisher Scientific, GibcoTM, catalog number: 15630080 )
- DQ-Red BSA (Thermo Fisher Scientific, InvitrogenTM, catalog number: D12051 )
- DAPI (Thermo Fisher Scientific, InvitrogenTM, catalog number: D1306 )
- HI FBS (Thermo Fisher Scientific, GibcoTM, catalog number: 10082147 )
- 1x DPBS (Lonza, catalog number: 17-512F )
- 16% paraformaldehyde (PFA) (Electron Microscopy Sciences, catalog number: 15700 )
- Fluoromount G (Southern Biotech, catalog number: 0100-01 )
- Stock solution of DQ-Red BSA (see Recipes)
- DAPI stock solution (see Recipes)
Equipment
- CO2 incubator (Eppendorf, New BrunswickTM, model: Galaxy® 170 R )
- Confocal microscope (ZEISS, model: LSM 710 )
Software
- ImageJ software (NIH)
Procedure
文章信息
版权信息
© 2017 The Authors; exclusive licensee Bio-protocol LLC.
如何引用
Readers should cite both the Bio-protocol article and the original research article where this protocol was used:
- Marwaha, R. and Sharma, M. (2017). DQ-Red BSA Trafficking Assay in Cultured Cells to Assess Cargo Delivery to Lysosomes. Bio-protocol 7(19): e2571. DOI: 10.21769/BioProtoc.2571.
- Marwaha, R., Arya, S. B., Jagga, D., Kaur, H., Tuli, A. and Sharma, M. (2017). The Rab7 effector PLEKHM1 binds Arl8b to promote cargo traffic to lysosomes. J Cell Biol 216(4): 1051-1070.
分类
细胞生物学 > 细胞成像 > 共聚焦显微镜
细胞生物学 > 基于细胞的分析方法 > 细胞吞排作用
您对这篇实验方法有问题吗?
在此处发布您的问题,我们将邀请本文作者来回答。同时,我们会将您的问题发布到Bio-protocol Exchange,以便寻求社区成员的帮助。