- Protocols

- Articles and Issues
- For Authors
- About
- Become a Reviewer

Preparation of Human Chondrocytes for Profiling Using Cytometry by Time-of-flight (cyTOF)
Published: Vol 11, Iss 14, Jul 20, 2021 DOI: 10.21769/BioProtoc.4086 Views: 3948
Reviewed by: Ralph Thomas BoettcherToshitsugu FujitaAnonymous reviewer(s)
Original research article
The authors used this protocol in:

Mar 2020

Protocol Collections
Comprehensive collections of detailed, peer-reviewed protocols focusing on specific topics


Related protocols
Abstract
Single-cell technologies have allowed high-resolution profiling of tissues and thus a deeper understanding of tissue homeostasis and disease heterogeneity. Understanding this heterogeneity can be especially important for tailoring treatments in a patient-specific manner. Here, we detail methods for preparing human cartilage tissue for profiling via cytometry by time-of-flight (cyTOF). We have previously utilized this method to characterize several rare cell populations in cartilage, including cartilage-progenitor cells, inflammation-amplifying cells (Inf-A), and inflammation-dampening cells (Inf-D). Previous bio-protocols have focused on cyTOF staining of PBMCs. Therefore, here we detail the steps unique to the processing of human cartilage and chondrocytes. Briefly, cartilage tissue is digested to release individual chondrocytes, which can be expanded and manipulated in culture. These cells are then collected and fixed in preparation for cyTOF, followed by standard staining and analysis protocols.
Keywords: ChondrocytesBackground
Fluorescence flow cytometry has historically been used in the skeletal field to isolate particularly rare cell types. In the case of human cartilage biology, such experiments allowed for the isolation of cartilage-progenitor cells (CPCs) and other types of chondrocytes using a limited set of markers. However, the overlap between different fluorophores fundamentally limits the number of target proteins that can be interrogated in a single experiment. Cytometry by time-of-flight (cyTOF) expands this tool kit by conjugating antibodies to heavy metal ions that can then be detected by mass spectrometry, thereby greatly expanding the number of protein targets that can be measured in a single experiment (Bendall et al., 2011). The use of cyTOF complements other available single-cell techniques, such as RNA profiling or chromatin-accessibility profiling, by providing a targeted snapshot of the translated proteome of a cell. This can be particularly advantageous in disease scenarios, such as when studying chondrocytes derived from osteoarthritic (OA) cartilage. CyTOF allows researchers to profile rare populations and simultaneously capture information from 40+ markers, including cell surface receptors and cell signaling markers.
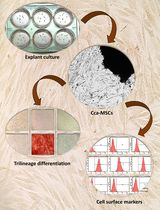
Several protocols have detailed the application of cyTOF to small cells, such as peripheral blood mononuclear cells (PBMCs) (Leipold and Maecker 2015; Lin et al., 2015). Here, we detail the specific application of cyTOF to human chondrocyte cells for use in musculoskeletal research, as we have described previously (Grandi et al., 2020). We first describe how to process patient-derived cartilage tissue to release individual chondrocytes, which can be expanded and manipulated in culture. We then describe how these cells should be collected and prepared for cyTOF, including fixation and cell staining steps. Data acquisition on the cyTOF instrument follows the manufacturer’s recommendations. An overall schematic of the workflow, including pause points, is detailed in Figure 1. This protocol can be applied to study any set of antibody-based protein markers of interest beyond those described in Grandi et al. (2020).
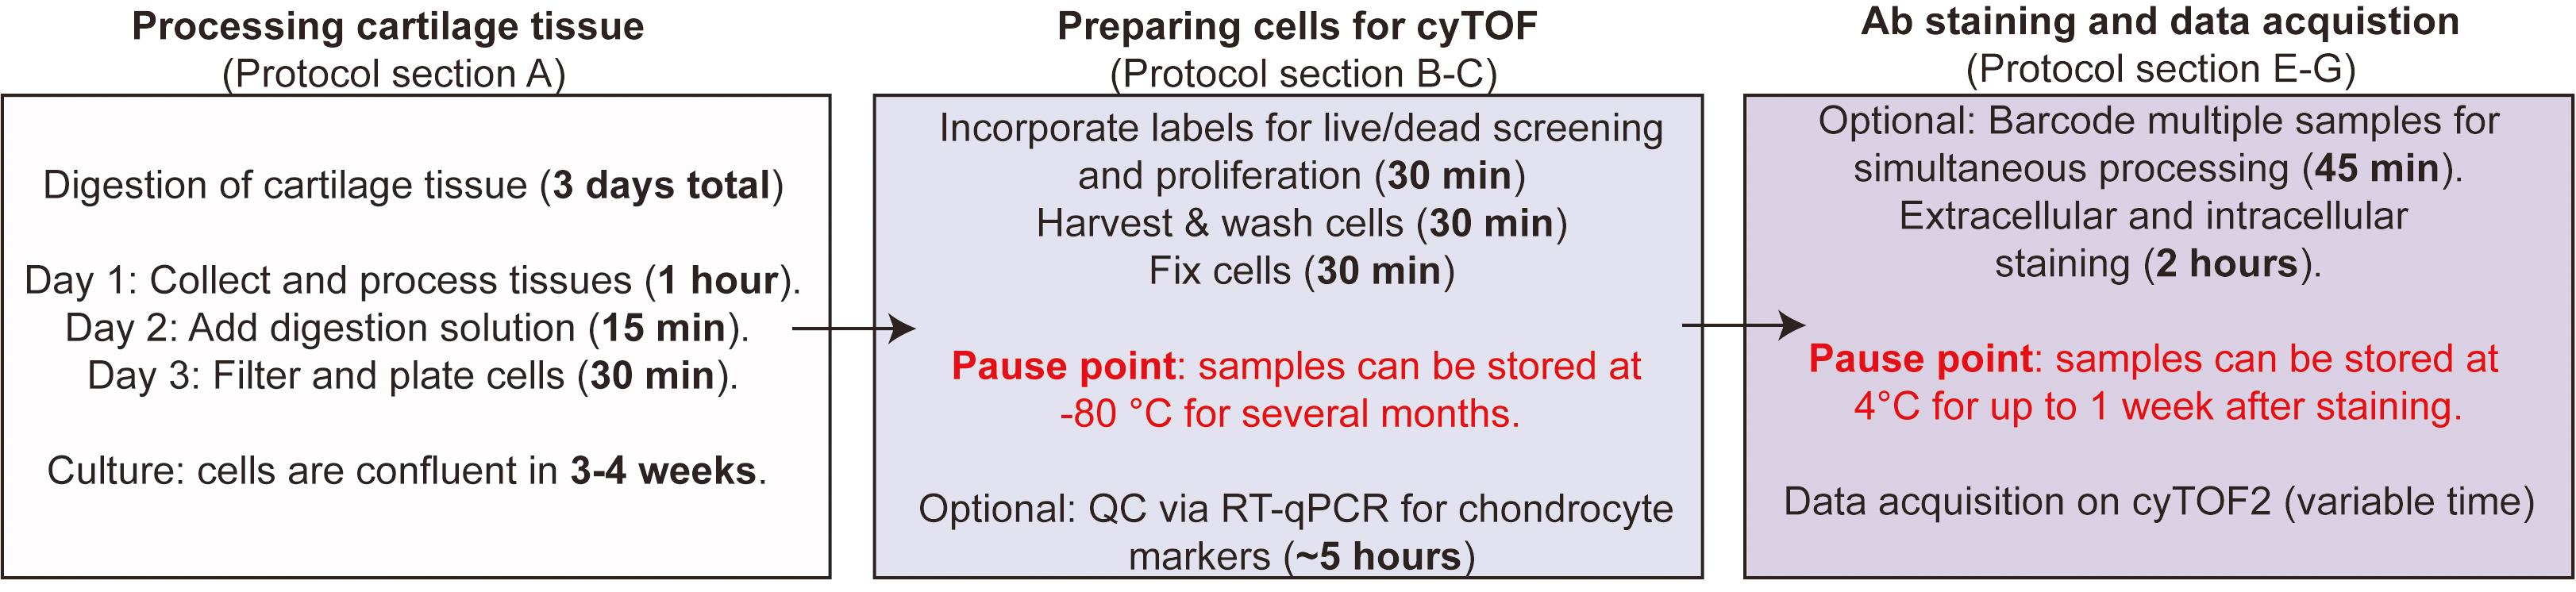
Figure 1. Protocol Overview Schematic. Section A of this protocol details how to process cartilage tissue to extract chondrocytes, which can then be cultured and manipulated. Digestion of cartilage takes 3 days, with minimal hands-on time. Time to confluency may vary, depending on the density at which cells are plated. Sections B-C detail how to prepare the cultured chondrocytes for cyTOF, including the Idu staining for cell cycle analysis and cisplatin staining for live/dead analysis. Chondrocytes are then harvested from the plate and fixed, after which the samples can be stored at -80°C for several months. Finally, sections E-G of this protocol briefly detail how to do the staining with cyTOF conjugated antibodies. After staining, samples can be stored at 4°C for up to one week.
Materials and Reagents
Standard tissue culture supplies (tissue culture treated plates, Phosphate Buffer Saline (PBS), serological pipets, etc.)
Bottle-top vacuum filter bottle, with pore size of 0.22 μm that can hold >50 ml or equivalent filter system (Corning, catalog number: CLS430624)
70 μm cell strainer (Falcon, catalog number: 352350 or equivalent)
5 ml FACS tubes with 35 μm strainer cap (Corning, catalog number: 352235) or equivalent
Collagenase II (Worthington Biochem, catalog number: CLS-2)
Collagenase IV (Worthington Biochem, catalog number: CLS-4)
Hyclone Dulbecco’s modified Eagle’s medium/F12 (GE Healthcare, catalog number: SH3002302)
L-glutamine (Gibco, catalog number: 25-030-149)
Fetal Bovine Serum (FBS) (Corning, catalog number: 35-016-CV)
Antibiotic-antimycotic solution (Gibco, catalog number: 15-240-062)
Ascorbic Acid (Sigma, catalog number: A92902) or equivalent
Trypan Blue Solution 0.4% (Gibco, catalog number: 15250061)
Phosphate Buffer Saline (PBS) (Hyclone, catalog number: SH30256)
Bovine serum albumin lyophilized powder (Sigma, catalog number: A2153)
Sodium azide (Sigma, catalog number: S2002)
(Optional) If doing sample quality-control via qPCR:
RNA extraction kit (Quick-RNA Microprep kit; Zymo, catalog number: R1050)
cDNA synthesis kit (Applied Biosystems, catalog number: 4368814)
qPCR supplies
TaqMan Gene Expression Assay (FAM) (ThermoFisher Scientific, catalog number: 4331192) or equivalent.
TaqMan probes for quality control genes (or Sybr equivalent). We use: Mmp3 (Hs00233962_m1), Mmp9 (Hs00957562_m1), and Mmp13 (Hs00233992_m1), and calculate the Col2a1/Col1a1 Ct ratio using Hs01060358_m1 and Hs00164004_m1 and normalize to actin as a housekeeping gene (Hs01060665_g1) purchased from Thermo Fisher.
Cell-IDTM Cisplatin-194Pt (Fluidigm, catalog number: 201194) or equivalent
Cell-IDTM IdU (Fluidigm, catalog number: 201127) or equivalent
Sodium Chloride (NaCl) (Sigma, catalog number: S988)
Potassium Chloride (KCl) (Sigma, catalog number: P9541)
Sodium Phosphate dibasic (Na2HPO4) (Sigma, catalog number: S7907)
Potassium Phosphate monobasic (KH2PO4) (Sigma, catalog number: P5655)
Sodium Hydroxide (NaOH) (Sigma, catalog number: S8045)
Sterile, double distilled water (Hyclone, catalog number: SH3053801)
0.25% Trypsin, 0.02% EDTA (Sigma, catalog number: 59428C) or equivalent
16% Paraformadehyde Aqueous Solution EM Grade (Electron Microscopy Sciences, catalog number: 15710)
(Optional) Cell-ID 20-plex Pd Barcoding Kit (Fluidigm, catalog number: 201060)
Methanol (Sigma, catalog number: 34860)
Cell-ID Intercalator-Ir (Fluidigm, catalog number: 201192A)
EQ Four Element Calibration Beads (Fluidigm, catalog number: 201078)
Maxpar Cell Staining Buffer (Fluidigm, catalog number: 201068) or homemade according to recipe, taking care not to use containers washed with soaps that have a high barium content, as this will give a lot of background.
Metal conjugated antibody panel
These will be specific to your experiment of interest. Some can be bought pre-conjugated by Fluidigm or can be labeled using the Maxpar X8 Multimetal Labeling Kit (Fluidigm, catalog number: 201300). Please see Grandi et al. (2020) for our full list of antibodies.
(Optional) For quality control of chondrocytes, include SOX9 and CD44 in your panel
SOX9 (Abcam, Clone 3C10)
CD44 (Biolegend, Clone IM7)
Complete Chondrocyte Media (see Recipes)
Collagenase Solution (see Recipes)
Cell Staining Media (CSM) (see Recipes)
Low-barium PBS (1× phosphate buffered saline) (see Recipes)
0.5 μM Cisplatin in low-barium PBS (see Recipes)
Cell Fixation Solution (see Recipes)
CSM with Cell-ID intercalator (see Recipes)
CSM with Cell-ID intercalator and 4% PFA (see Recipes)
Equipment
Cell Incubator (5% CO2, 37°C)
Biological Safety cabinet
Light microscope for cell monitoring
Cell counter or hematocytomer
Vortex Genie 2 (or equivalent)
CyTOFTM version 2 mass cytometer (Fluidigm) or equivalent
(Optional) Super Sampler (Victorian Airship and Scientific Apparatus)
Centrifuge with temperature control
Calibrated pipets
(Optional) Real-Time PCR Machine
Software
Cytobank (https://www.cytobank.org/) for data visualization and quality control
We also used this for the tSNE embedding and FlowSOM analysis, although this can be done with Python or R packages.
Custom scripts for visualizing the data were used as described before (Grandi et al., 2020).
Additionally, other R packages are available for cyTOF data analysis, including FlowSOM (Van Gassen et al., 2015) for cluster generation and Citrus (Bruggner et al., 2014) for determining differences between groups.
Procedure
Processing and culturing human cartilage tissues
Collect whole cartilage samples from surgical discards of unilateral or total knee replacements, in accordance with our approved IRB protocol.
Shave cartilage off the bone using a scalpel. If desired, visual scoring can be done at this time to distinguish between grade 1-4 cartilage (for grading examples, please see Rutgers et al., 2010).
Place 1-2 mm cartilage pieces in standard tissue culture treated plates in complete media overnight in a tissue culture incubator at 37°C, with 5% CO2. We generally use 15 cm2 dishes when we receive total knee replacement samples and place samples in 15-20 ml of media (or enough to cover the pieces completely). If the samples are very small, this can be scaled to 10 cm2 dishes.
The following day, monitor the sample for any bacterial growth. This will show up as “sandy” looking particulates in the sample, which are observable under a light microscope. Add 10 ml of collagenase solution (1:2 ratio of collagenase solution to media) to the samples and digest overnight in a tissue culture incubator at 37°C, with 5% CO2.
Strain cells through a 70 µm filter into a 50 ml tube and spin at 300 × g for 5 min at room temperature (RT) to pellet the cells.
Plate cells at 30,000-35,000 cells per cm2 on standard tissue culture treated plates using chondrocyte complete medium. Maintain cells at 37°C, with 5% CO2.
Monitor cell growth. Passage 0 (P0) cells are usually confluent in 3-4 weeks after plating. In our experience, cells retain the best morphology when kept at high density and allowed to grow until 100% confluent. Cells retain their properties for 1-2 passages. Maintain cells in chondrocyte complete growth medium, changing the media every 3-4 days as necessary. If you want to expand the number of cells, we recommend passaging at high densities. Cells can be passaged by treating them with collagenase solution (1 ml for every 4 ml media) overnight, spinning them down and washing out the collagenase with 1× PBS, and replating cells at 30,000-35,000 cells per cm2 on standard tissue culture treated plates.
Incorporating labels for live/dead screening and proliferation
Before starting:
Chill one bottle of PBS to 4°C and keep on ice and place another at RT.
Thaw a new 0.25% Trypsin aliquot to RT.
Chill the centrifuge to 4°C.
Chill low-barium PBS (see Recipes and Notes sections) and cell staining media (CSM) to 4°C and keep on ice.
Add Idu directly into existing cell media to a final concentration of 25 µM. Place cells in the 37°C incubator for 15 min.
Wash out Idu with cold, sterile PBS, performing a minimum of two washes. Extra cell washes will help remove dead cells.
Make a 0.5 µM cisplatin mix in RT PBS (final concentration); for a 10 cm2 plate, add ~5 ml or enough to cover the bottom of the plate.
Add the 0.5 µM cisplatin mix directly to washed, aspirated cells on the dish and incubate for 5 min at RT.
Wash cells twice with complete media.
Harvesting cultured chondrocytes
Wash the cells with RT PBS.
Add 10 ml (or enough to cover your plate surface) of 0.25% trypsin and incubate for 10-15 min in the 37°C cell incubator (monitor plates to see when the cells lift).
Neutralize the enzyme using complete media at a 1:1 ratio with the trypsin.
Collect the cells from the plate by transferring to a 50 ml conical tube, washing off any remaining cells with RT PBS, and spin at 500 × g for 5 min at 4°C.
Wash cells twice with 2 ml of cold PBS to remove excess trypsin. Between each wash, strain the cells through a 35 µm filter (for example, the ones on the FACS tubes) to make a single-cell suspension. Expect large cell losses here. We normally perform these experiments in 10 cm2 dishes. Before filtration, we expect to collect between 3-4 million chondrocytes. After filtration, this can range between 1-2 million chondrocyte singlets.
Count cells using a hemocytometer or equivalent equipment. We count using the 4-square average approach, where total cells/ml = average number of cells counter in 4 squares × dilution factor × 104. Keep cells on ice for the fixation protocol.
(Optional) Take 10,000-50,000 cells for RNA extraction to do quality controls on the samples. RNA can be isolated using standard column kits. After cDNA generation (following the manufacturer’s specifications), each sample should be checked for its Col2a1/Col1a1 ratio, and in the case of OA cartilage, for Mmp 3, 9, and 13 expression using quantitative real-time PCR (qPCR). Relative expression can be calculated using the standard delta delta CT method (Livak and Schmittgen, 2001). To ensure samples are not dedifferentiated, the ratio of Col2a1/Col1a Ct values should be >1, although the exact ratio for each sample will vary. In our hands, Mmp expression is anywhere between 10-10,000 fold higher in OA cartilage than in healthy cartilage (Figure 2A).
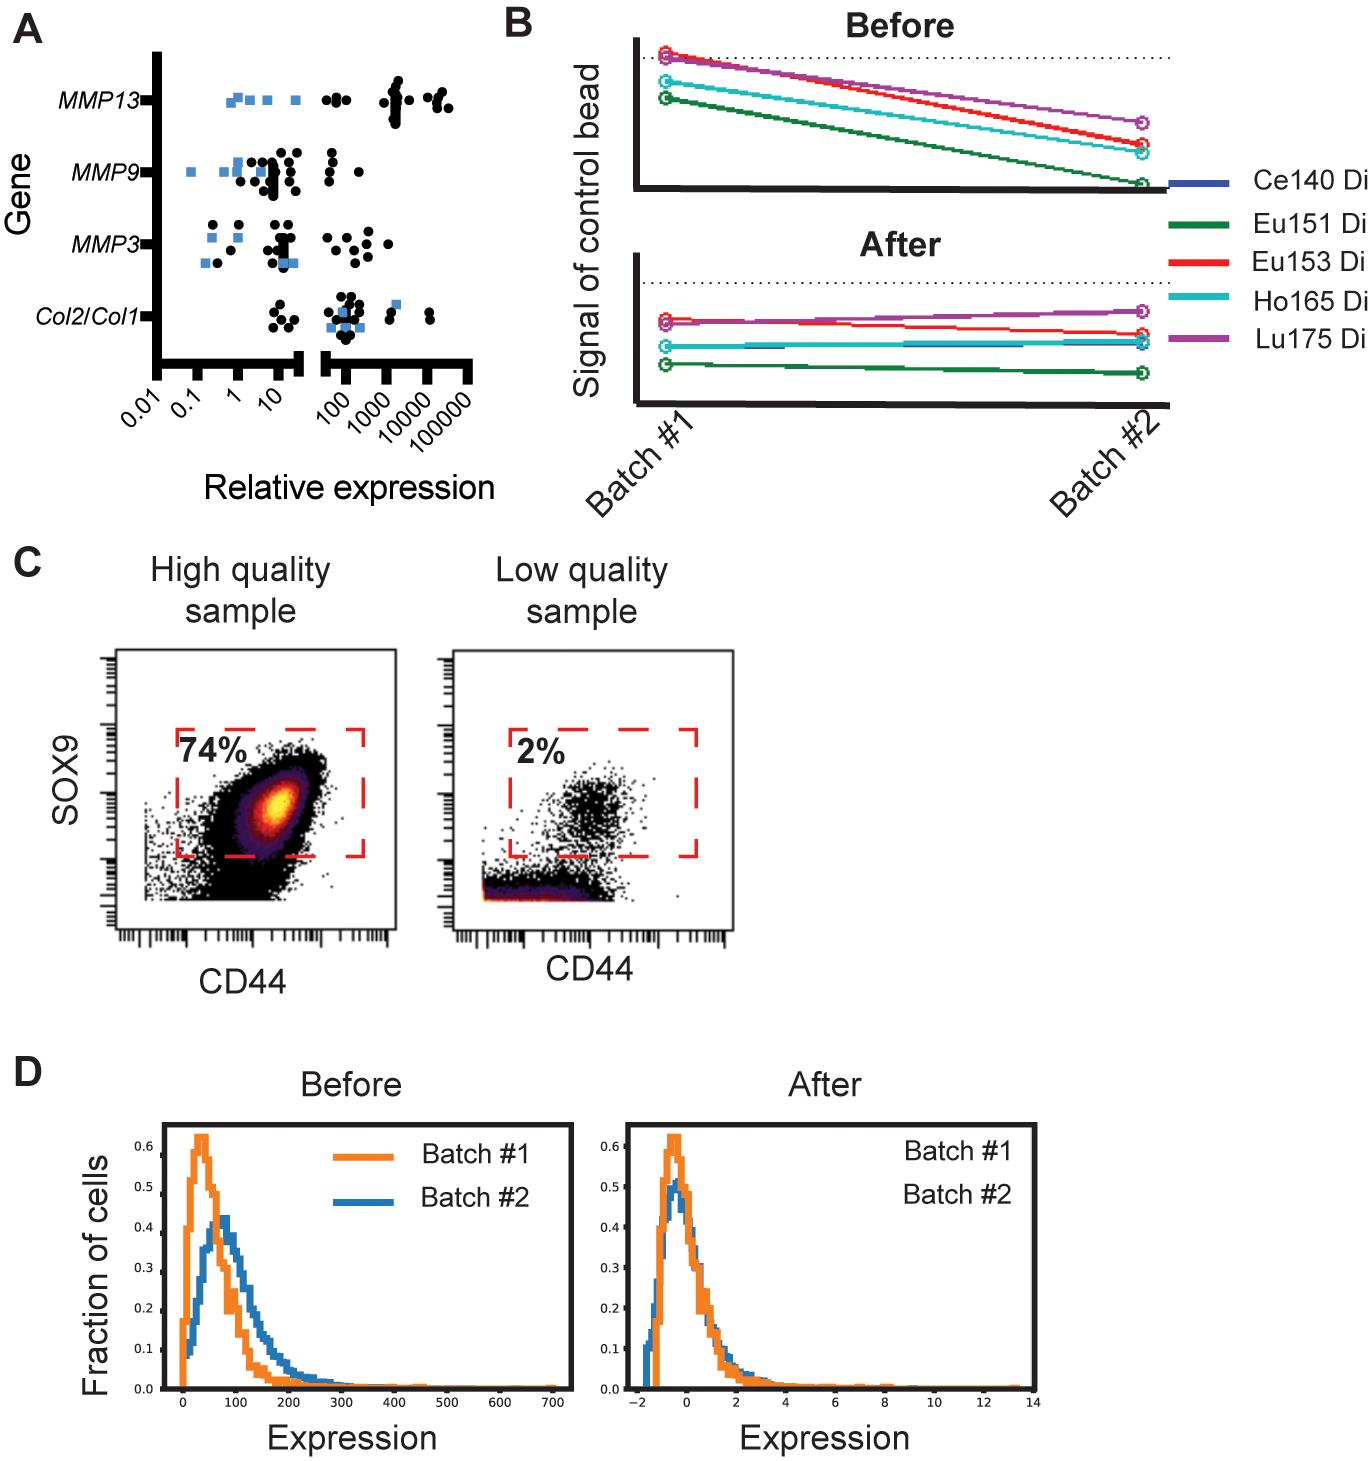
Figure 2. Quality control for cartilage samples and cyTOF data. A. Representative values of MMP3, MMP9, and MMP13 expression from 5 healthy (blue) and 20 OA cartilage samples (black). The values plotted are normalized with actin as a housekeeping gene and relative to one normal cartilage sample. Col2a1 and Col1a1 expression is shown as a ratio. All samples retaining a chondrogenic phenotype should have a Col2a1/Col1a1 ratio >1. Data is re-analyzed from the same patients as in Grandi et al. (2020). B. EU control bead signal before and after run time normalization. This can help to normalize samples internally (over the run time) and between runs, as shown here. C. Dot plot of two healthy cartilage samples, showing expression of SOX9 and CD44, as measured by cyTOF. Expression on each axis is arcsine transformed, and a representative gate is shown, although this will vary with the signal-to-noise ratio of each run. On the left is an example of a high-quality sample where >74% of the live-cell (i.e., cisplatin negative) events have staining for both SOX9 and CD44. On the right is an example of a low-quality sample that was not included in downstream analyses, where <2% of the live cell events were inside the SOX9/CD44 gate. D. A histogram of SOX9 cell expression is plotted for the same cartilage sample profiled on two different temporarily separated batches (orange and blue). The left graph depicts the samples before normalization; note that, while the sample is exactly from the same patient, the intensities look different. The graph on the right depicts the same set of samples but after normalization, when staining intensities are comparable.
Preparing single-cell suspensions and fixing chondrocyte samples
Resuspend 0.5-1 million cells in 1 ml of Cell Fixation Solution (900 µl of PBS and 100 µl of 16% PFA, for a final 1.6% concentration) in a FACS tube. Always open a new ampule for precious samples, as the PFA degrades quickly with time. Ensuring a homogenous single-cell suspension is key; otherwise, cell clumps will be fixed together. Fixation can be scaled up or down if you have more or fewer cells.
Incubate cells for 10 min at RT.
Wash twice with 4 ml of CSM. Centrifuge at 500 × g for 5 min at 4°C and store pellet in <100 μl of CSM at -80°C. Samples can be stored this way for years, with minimum quality loss. Our lab has profiled samples up to three years after collection. To avoid freeze/thaw cycles, we suggest that you aliquot samples in small amounts. Generally, 0.5-1 million cells per sample are necessary for the average barcoded cyTOF run.
(Optional) Barcoding multiple samples with the Fluidigm’s Cell-ID 20-plex Pd Barcoding Kit
This barcoding step is only necessary if you want to run multiple samples as a single batch run and combine all your samples. We recommend this if looking at multiple conditions, as it minimizes batch staining effects.
Thaw frozen cells on ice.
Wash cells twice with 4 ml of RT barcoding permeabilization buffer (included in the Cell-ID 20-plex barcoding kit).
Resuspend each sample in 800 µl of RT barcoding permeabilization buffer. Make sure that you have equal numbers of cells in the samples you are comparing. For chondrocytes, we aim for 0.5-1 million cells per patient or condition.
Resuspend each barcoded sample in 100 µl of RT barcode permeabilization buffer and transfer to the appropriate sample. Mix immediately by pipetting up and down five times. Record which barcode goes with which sample.
Incubate samples for 30 min at RT.
Centrifuge samples for 5 min at 500 × g at 4°C. Wash twice with 2 ml of CSM.
Combine all cells into a single tube.
Extracellular and intracellular staining
If you have barcoded cells (from section E), skip to step 3.
If you do not have barcoded cells:
Thaw frozen cells on ice.
Wash cells twice with 2 ml of CSM.
Filter cells through the 35 μm strainer cap of a FACS tube and count the total number of cells. This value will be used to calculate the amount of antibody to use.
Pellet the cells for 5 min at 500 × g at 4°C right before resuspending them in the antibody cocktail (see below).
Prepare a surface antibody cocktail in cell staining media according to the total number of cells in the tube and the titration concentrations of your antibodies (see Notes for titration considerations). Try to keep the volume below 500 μl. Consistency between runs is more important; therefore, stain all iterations in the same volume. For more details about the staining protocol, please see Leipold and Maecker (2015) and Lin et al. (2015).
Stain cells on ice for 30 min (or longer if necessary, depending on your conditions).
Wash cells three times with 1 ml of CSM, spinning them down for 5 min at 500 × g at 4°C.
Permeabilize cells by resuspending them in 100% methanol. For chondrocytes, we recommend you vortex the cells gently (on the lowest setting on our Vortex Genie 2; this is setting #1) as you add in the methanol drop wise; otherwise, cells tend to precipitate in a clump. Allow cells to permeabilize for 10 min at RT, vortexing gently as necessary to keep them in solution.
Quench the permeabilization reaction with 2 ml of CSM and spin down cells for 5 min at 500 × g at 4°C.
Prepare the intracellular antibody cocktail in cell staining media according to the total number of cells in the tube and the titration concentrations of your antibodies. For more details about the staining protocol, please see Leipold and Maecker (2015) and Lin et al. (2015).
Stain cells on ice for 30 min.
Wash three times with 2 ml of CSM, spinning them down for 5 min at 500 × g at 4°C each time.
Resuspend cells in 1 ml of CSM with Cell-ID Intercalator. Stained cells are stable for up to one week after staining if stored at 4°C. We typically stain the night before running the cyTOF and leave the cells in 1× intercalator and 4% PFA overnight at 4°C.
Data acquisition
Acquire data on a cyTOF machine according to the manufacturer’s specifications for the instrument. We find that using the supersampler works better for chondrocytes than direct injection, as the cells are large and oblong and tend to settle in the tubing if not continuously agitated.
Determine the cell number to acquire based on the estimated abundance of your population(s) of interest.
Right before the run, resuspend cells in dH2O with EQ beads diluted 1:10.
Data analysis
Quality control and data cleaning (representative data in Figure 2):
Normalization over run time is performed using the EU beads using Normalizer v0.3 (https://github.com/nolanlab/bead-normalization/releases) with the default parameters (Figure 2B).
Samples are debarcoded using the single-cell debarcoder (https://github.com/nolanlab/single-cell-debarcoder) with default parameters.
If comparing data between runs, channel values should be arcsine transformed and normalized using samples that are present in both runs. We use quantile normalization (Figure 2C).
Select for live cells by gating for cisplatin-negative, DNA (Ir195)-positive cells. If working with chondrocytes, we suggest adding SOX9 and CD99 antibodies to your panel, so you can select for SOX9/CD44 high cells in the final analysis (Figure 2D). Gating can be performed using Cytobank (premium.cytobank.org).
Data analysis is out of the scope of this protocol. For more in-depth analysis guides, please see the following reviews: Kimball et al. (2018) or Nowicka et al. (2017). Some recommended software packages are listed in the software section.
Notes
Designing the cyTOF panel is crucial for planning this experiment. In some cases, single-cell RNA-sequencing datasets can be useful in determining markers for identifying your cells of interest. However, we have found that the correlation is often not 1:1, especially in the context of disease. As a general rule, we recommend the inclusion of SOX9 and CD44 for quality control when profiling differentiated chondrocytes, although some rare stem/progenitor populations may be negative for these markers.
This protocol does not go into the specifics of conjugating your own antibodies. We followed the manufacturer’s recommendations, using 100 μg or more of antibody as our starting amount. In antibodies not sold without a glycerol or BSA carrying agent, we recommend cleaning them, for example, by using the Thermo Melon Gel IgG Purification kit (Thermo Scientific, #45206) as per the manufacturer’s recommendations. When choosing antibodies, we generally find that antibodies that work well on FACS also work well on cyTOF.
Antibody staining concentrations should be titrated, both for commercially conjugated and self-conjugated antibodies, using a cell mixture similar to what is intended for the main experiments. We use three dilutions centered around the manufacturer’s recommended amount, 10-fold up and 10-fold down. Pick staining concentrations that minimize the amount of “snow” that you see as background on the channel; otherwise, it will be hard for the cyTOF program to call individual cells.
If performing multiple runs, we suggest repeating one or two samples (common samples) between each batch of 20 that are barcoded, as minor differences in staining intensity or machine acquisition sensitivity can occur.
Make sure that the PBS does not contain heavy metal contaminants and is not made in bottles that have had contact with soaps or solutions that have high levels of barium, as this leads to a high background signal.
Recipes
Complete Chondrocyte Media
DMEM/F12
10% FBS
2mM L-glutamine
1× antibiotic-antimycotic
12.5 μg/ml ascorbic acid
Filter sterilize by passing it through a 0.22 μm filter
Store at 4°C. Use within a month of preparation.
Collagenase Solution
In complete chondrocyte media:
Dissolve 2.5 mg/ml each of Collagenase II and IV
Filter through 0.22 μm after resuspending
Store at 4°C. Use within a week preparation. For best results, we suggest preparing this fresh the day of use as collagenase in solution loses activity overtime.
Cell Staining Media (CSM)
1× low-barium PBS (without heavy mental contaminants and made using MilliQ water)
2 mM EDTA
0.05% sodium azide
0.1% BSA
Store at 4°C. Stable for several months.
Low-barium PBS (1× phosphate buffered saline)
137 mM NaCl
2.7 mM KCl
10 mM Na2HPO4
1.8 mM KH2PO4
ddH2O
NaOH for pH
Mix all ingredients in 3 L of ddH2O.
Bring solution up to pH 7.4 using NaOH.
Bring the final volume up to 4 L.
We keep our low barium PBS in glass bottles that have never been used for other purposes and which have not been washed with detergents that might have a high level of residual barium.
0.5 μM Cisplatin in low-barium PBS
1× low-barium PBS
1 mM Cell-ID Cisplatin
Dilute Cell-ID Cisplatin to a final concentration of 0.5 μM. Prepare in RT low-barium PBS right before use.
Cell Fixation Solution
16% PFA
1× low-barium PBS
Per 0.5-1 million cell sample, prepare 1 ml (900 µl of low-barium PBS and 100 µl of 16% PFA, for a final 1.6% concentration). Always open a new ampule for precious samples, as the PFA degrades quickly with time. Volume can be scaled up or down depending on sample size.
CSM with Cell-ID intercalator
CSM
Cell-ID Intercalator-Ir (Fluidigm, catalog number: 201192A)
Per sample, make 1 ml of CSM with Cell-ID intercalator-Ir diluted at 1:1,000
(Optional if storing stained cells overnight) CSM with Cell-ID intercalator and 4% PFA
CSM
16% PFA
Cell-ID Intercalator-Ir
Per sample, make 1 ml of CSM with Cell-ID intercalator-Ir diluted at 1:1,000 and PFA diluted to 4%.
Acknowledgments
N.B. is supported by NIH/NIAMS grants R01 AR070865 and R01 AR070864. F.C.G. is supported by the NSF GRFP award. This work was also supported by a gift to the Department of Orthopedic Surgery from K. Thiery and D. O’Leary. This work reports the cyTOF staining protocol for human chondrocytes used in our previous paper (Grandi et al., 2020). Some data from Grandi et al. (2020) have been adapted in this report to demonstrate data cleaning and quality control.
Competing interests
The authors have no competing interests to disclose.
Ethics
OA samples were procured from the discarded tissues of patients with radiographic OA undergoing total joint replacement, in accordance with the IRB protocol approved by Stanford University.
References
- Bendall, S. C., Simonds, E. F., Qiu, P., Amir el, A. D., Krutzik, P. O., Finck, R., Bruggner, R. V., Melamed, R., Trejo, A., Ornatsky, O. I., Balderas, R. S., Plevritis, S. K., Sachs, K., Pe'er, D., Tanner, S. D. and Nolan, G. P. (2011). Single-cell mass cytometry of differential immune and drug responses across a human hematopoietic continuum. Science 332(6030): 687-696.
- Bruggner, R. V., Bodenmiller, B., Dill, D. L., Tibshirani, R. J. and Nolan, G. P. (2014). Automated identification of stratifying signatures in cellular subpopulations. Proc Natl Acad Sci U S A 111(26) E2770-E2777.
- Grandi, F. C., Baskar, R., Smeriglio, P., Murkherjee, S., Indelli, P. F., Amanatullah, D. F., Goodman, S., Chu, C., Bendall, S. and Bhutani, N. (2020). Single-cell mass cytometry reveals cross-talk between inflammation-dampening and inflammation-amplifying cells in osteoarthritic cartilage. Sci Adv 6(11): eaay5352.
- Kimball, A. K., Oko, L. M., Bullock, B. L., Nemenoff, R. A., van Dyk, L. F. and Clambey, E. T. (2018) A Beginner’s Guide to Analyzing and Visualizing Mass Cytometry Data. J Immunol 200(1): 3-22.
- Leipold, M. D. and Maecker, H. T. (2015). Phenotyping of Live Human PBMC using CyTOFTM Mass Cytometry.Bio-protocol 5(2): e1382.
- Lin, D., Gupta, S. and Maecker, H. T. (2015). Intracellular Cytokine Staining on PBMCs Using CyTOFTM Mass Cytometry. Bio-protocol 5(1): e1370.
- Livak, K. J. and Schmittgen, T. D. (2001). Analysis of relative gene expression data using real-time quantitative PCR and the 2−ΔΔCT Method. Methods 24(4): 402-8.
- Nowicka, M., Krieg, C., Crowell, H. L., Weber, L. M., Hartmann, F. J., Guglietta, S., Becher, B., Levesque, M. P. and Robinsion, M. D. (2017). CyTOF workflow: differential discovery in high-throughput high-dimensional cytometry datasets. F1000Res. 6: 748.
- Rutgers, M., van Pelt, M. J. P., Dhert, W. J. A., Creemers, L. B. and Sairs, D. B. F. (2010). Evaluation of histological scoring systems for tissue-engineered, repaired and osteoarthritic cartilage. Osteoarthritis Cartilage 18(1): 12-23.
- Van Gassen, S., Callebaut, B., Van Helden, M. J., Lambercht, B. N., Demeester, P., Dhaene, T. and Saeys, Y. (2015). FlowSOM: Using self-organizing maps for visualization and interpretation of cytometry data. Cytometry A 87(7): 636-45.
Article Information
Copyright
© 2021 The Authors; exclusive licensee Bio-protocol LLC.
How to cite
Readers should cite both the Bio-protocol article and the original research article where this protocol was used:
- Grandi, F. C. and Bhutani, N. (2021). Preparation of Human Chondrocytes for Profiling Using Cytometry by Time-of-flight (cyTOF). Bio-protocol 11(14): e4086. DOI: 10.21769/BioProtoc.4086.
- Grandi, F. C., Baskar, R., Smeriglio, P., Murkherjee, S., Indelli, P. F., Amanatullah, D. F., Goodman, S., Chu, C., Bendall, S. and Bhutani, N. (2020). Single-cell mass cytometry reveals cross-talk between inflammation-dampening and inflammation-amplifying cells in osteoarthritic cartilage. Sci Adv 6(11): eaay5352.
Category
Cell Biology > Cell isolation and culture > Monolayer culture
Cell Biology > Cell staining > Whole cell
Do you have any questions about this protocol?
Post your question to gather feedback from the community. We will also invite the authors of this article to respond.