- Protocols

- Articles and Issues
- For Authors
- About
- Become a Reviewer

Probabilistic Models for Predicting Mutational Routes to New Adaptive Phenotypes
(*contributed equally to this work) Published: Vol 9, Iss 20, Oct 20, 2019 DOI: 10.21769/BioProtoc.3407 Views: 4436
Reviewed by: Prashanth N SuravajhalaJayaraman ValadiUrmila Kulkarni-KaleAnonymous reviewer(s)
Original research article
The authors used this protocol in:

Jan 2019

Protocol Collections
Comprehensive collections of detailed, peer-reviewed protocols focusing on specific topics


Related protocols


Abstract
Understanding the translation of genetic variation to phenotypic variation is a fundamental problem in genetics and evolutionary biology. The introduction of new genetic variation through mutation can lead to new adaptive phenotypes, but the complexity of the genotype-to-phenotype map makes it challenging to predict the phenotypic effects of mutation. Metabolic models, in conjunction with flux balance analysis, have been used to predict evolutionary optimality. These methods however rely on large scale models of metabolism, describe a limited set of phenotypes, and assume that selection for growth rate is the prime evolutionary driver.
Here we describe a method for computing the relative likelihood that mutational change will translate into a phenotypic change between two molecular pathways. The interactions of molecular components in the pathways are modeled with ordinary differential equations. Unknown parameters are offset by probability distributions that describe the concentrations of molecular components, the reaction rates for different molecular processes, and the effects of mutations. Finally, the likelihood that mutations in a pathway will yield phenotypic change is estimated with stochastic simulations.
One advantage of this method is that only basic knowledge of the interaction network underlying a phenotype is required. However, it can also incorporate available information about concentrations and reaction rates as well as mutational biases and mutational robustness of molecular components. The method estimates the relative probabilities that different pathways produce phenotypic change, which can be combined with fitness models to predict evolutionary outcomes.
Background
The ability to forecast evolution would not only make evolutionary biology more predictive but could have translational impact with applications in biotechnology (e.g., synthetic biology or biofuels) or medicine (e.g., antibiotic resistance or cancer). Most previous success in evolutionary forecasting has been in asexual microbial populations subject to strong selection and relies on extensive historical sequence data to estimate the fitness of different strains (Luksza and Lassig 2014; Neher et al., 2014). Such models are not based on the mechanistic details of how mutations translate into fitness differences. The models also assume that selection is the main determinant of evolutionary outcomes which is a limiting assumption because evolutionary routes can be significantly influenced by factors other than selection. For example, if the rate of phenotypic production differs across evolutionary routes then more likely mutations that confer small gains in fitness may be observed more often than rare mutations that confer large fitness gains; being first may be more important than being best. In such cases, accurate prediction of the mutational routes to adaptive phenotypes requires knowledge of their relative rates of phenotypic production.
The rates of phenotypic production can be shaped by a variety of factors. For instance, a higher rate of phenotypic production can be caused by mutational hotspots, which are sections of DNA that increase the frequency of mutational events in nearby genes. Another possibility is that some genes have a greater capacity to translate mutation into phenotypic change, i.e., have a larger number of sites that can be mutated with functional effects. This can due to the properties of the individual protein (Lind et al., 2017) or ncRNA, in terms of mutational robustness, but also because proteins and ncRNAs have different functions in the molecular interaction networks underpinning adaptive phenotypes (Lind et al., 2015 and 2019). A simple example of the latter case would be when expression of a gene is controlled by both a negative and a positive regulator, activation of that gene occurs more often through mutations in the negative regulator simply due to loss-of-function mutations being more likely than gain-of-function mutations.
To account for the factors affecting the rate of phenotypic production, mechanistic information is needed. An arena in which mechanistic information has been used to successfully predict evolution is in metabolism (Edwards and Palsson 2000; O'Brien et al., 2015). There is a wealth of data on the biochemical reactions involved in central metabolism in different microbial species. This data can be used to form explicit metabolic models that in conjunction with a technique known as flux balance analysis can predict the growth rate of an organism in simple environments. By manipulating which reactions are present in the metabolic model, the phenotypic effects, i.e., growth rates, of mutational knockouts can be predicted. Similar metabolic models have also been used to predict how organisms will interact in different environments via the exchange of biochemical compounds including spatio-temporal interactions (Liu et al., 2015; Bocci et al., 2018). While the metabolic models have been successful in certain evolutionary predictions, they are limited in their applicability: they focus mainly on growth phenotypes in environments in which organisms are assumed to be actively reproducing. Moreover, the growth phenotypes are computed using large-scale models with hundreds or thousands of reactions and typically involve optimization of a “biomass’’ function of some 50+ variables. The models also do not usually incorporate any type of regulation, e.g., transcriptional/translational control or protein modifications, but see Chandrasekaran and Price, 2010 for one such example. Thus, they are not well suited to generalizations outside of metabolism.
Here we describe a method to predict the rates that mutational changes to different molecular networks produce phenotypic change. One advantage of this method is that only knowledge of the general architecture of the molecular networks is needed to make a prediction. However information about reaction rates, concentrations, mutation rates and gene size, mutational robustness of components can be included if known. The method can incorporate different types of reactions, for example conformational changes and enzymatic reactions, and the phenotypes predicted are not limited to optimization for growth rate. Predictions generated by the method could potentially be combined with origin-fixation models (McCandlish and Stoltzfus, 2014) in order to predict the mutation rate to an adaptive phenotype in the absence of unbiased experimental data that is often difficult to obtain. Information about mutational biases (Lind et al., 2019) and the molecular effects of mutations on protein function from different prediction methods (Capriotti et al., 2005; Bromberg and Rost, 2007; Kumar et al., 2009; Dehouck et al., 2011; Capriotti et al., 2013; Celniker et al., 2013; Yates et al., 2014; Choi and Chan, 2015) can be incorporated into the model described here to adjust the rates of disabling and enabling mutation in different genes. The method described here is also useful for providing null models in order to test the causes of repeated evolution (Lind, 2018; Lind et al., 2019). It could also be one component in understanding the molecular bases of complex genetic diseases and for evolutionary forecasting of antibiotic resistance and cancer, especially when experimental data is incomplete.
Equipment
- Computer
Any desktop computer that fulfills the system requirements for the programming language(s) used. Here a desktop computer with the following configuration was used: iMac with a 3.6 GHz Intel Core i7 processor and 16 GB 2400 MHz DDR4 memory
Software
- MATLAB (MathWorks®, http://www.mathworks.com/)
MATLAB was used to solve the differential equations, analyze the resulting data, and generate figures. However, other programming language(s) would have sufficed so long as they can be used to numerically solve differential equations and perform simple mathematical operations, e.g., Python, Julia, Octave, or Mathematica. We note that in the associated paper (Lind et al., 2019) a combination of languages was used but for simplicity here we have put everything into a single language. MATLAB code for the procedures RunModelComparison and PlotModelComparison is available at https://github.com/ericlibby/BioProtocol.
Procedure
This protocol describes a method for computing the relative likelihood that a mutational change will translate into a phenotypic change in two molecular pathways. The pathways do not have to produce the same phenotype but there should be a way of determining what the phenotype is, based on the interactions between pathway components. Thus, the protocol assumes that the mechanistic details of the molecular pathways are understood; however, information may be missing concerning the reaction kinetics, the concentrations of molecular compounds, and/or the effects of mutations. This protocol outlines a procedure that randomly samples many models of the pathways and compares the likelihood that mutations in the pathway–that affect the reaction kinetics–alter the phenotype(s). The steps of the procedure are illustrated in Figure 1 using the same notation as in the text below. Figure 2 and Figure 3 presents the procedure in a pseudocode format and the full MATLAB code is available at https://github.com/ericlibby/BioProtocol.
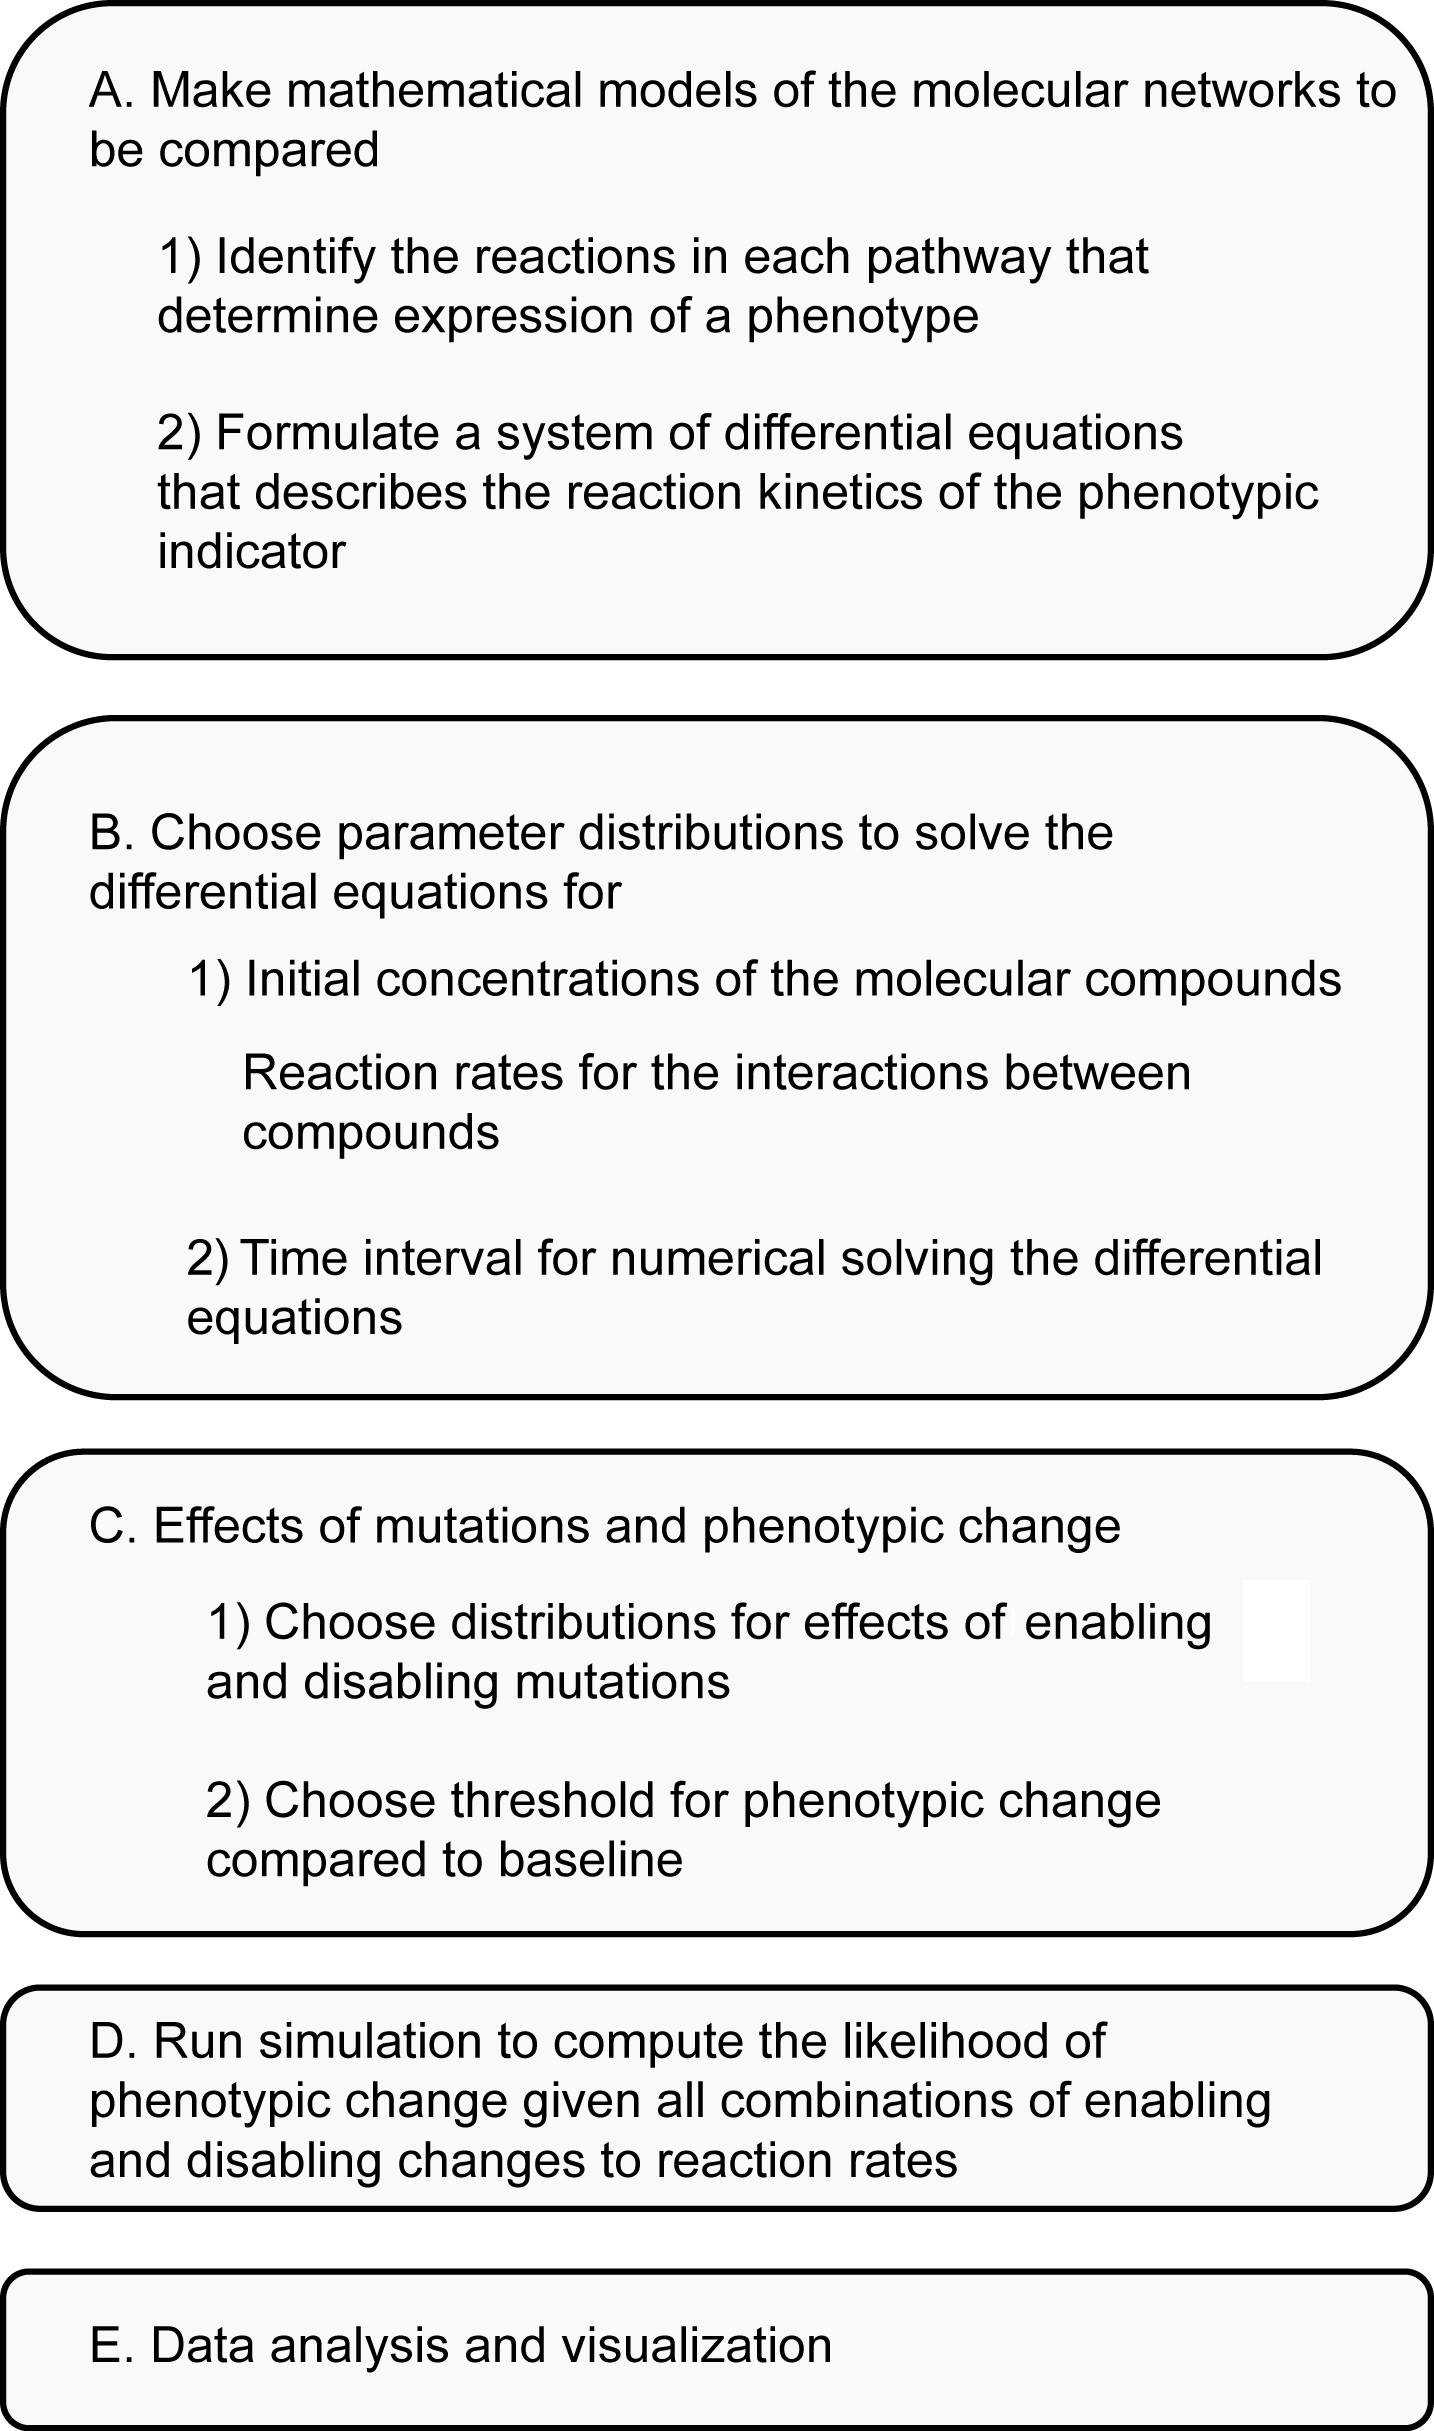
Figure 1. Overview of modeling methodology. Details are explained in the text below using the same notation.
- Build mathematical models of the molecular pathways that enable comparison
- Identify the set of biochemical reactions in each molecular pathway that determine expression of a particular phenotype. The types of reactions can vary depending on the pathway modeled and can include, for example, enzymatic reactions, conformational changes in proteins, oligomerization, and transcription initiation. The reactions should link the expression of the phenotype to some indicator, e.g., a biochemical compound (or function of compounds). For example, if the phenotype is the color of an organism then an appropriate indicator might be the amount of a pigment compound. In the article where this method was first used (Lind et al., 2019) the indicators were three diguanylate cyclase enzymes that could each be activated by mutations in their regulatory networks.
- For each set of biochemical reactions, formulate a system of differential equations that describes the reaction kinetics of the indicator (see Figure 1 for example). Each pathway is likely affected by biochemical compounds whose dynamics are governed by external pathways. It is often better to treat these compounds as constants rather than include more differential equations for their dynamics. For instance, if a pathway affects an indicator through phosphorylation then the intracellular pool of phosphate groups may be held as a constant rather than modeled through an additional set of differential equations. In general, it also helps to keep a similar level of detail/abstraction across the models of the pathways for better comparison. As an example, in (Lind et al., 2019) the models of the different pathways focused on the interactions between proteins and ignored processes involving transcription.
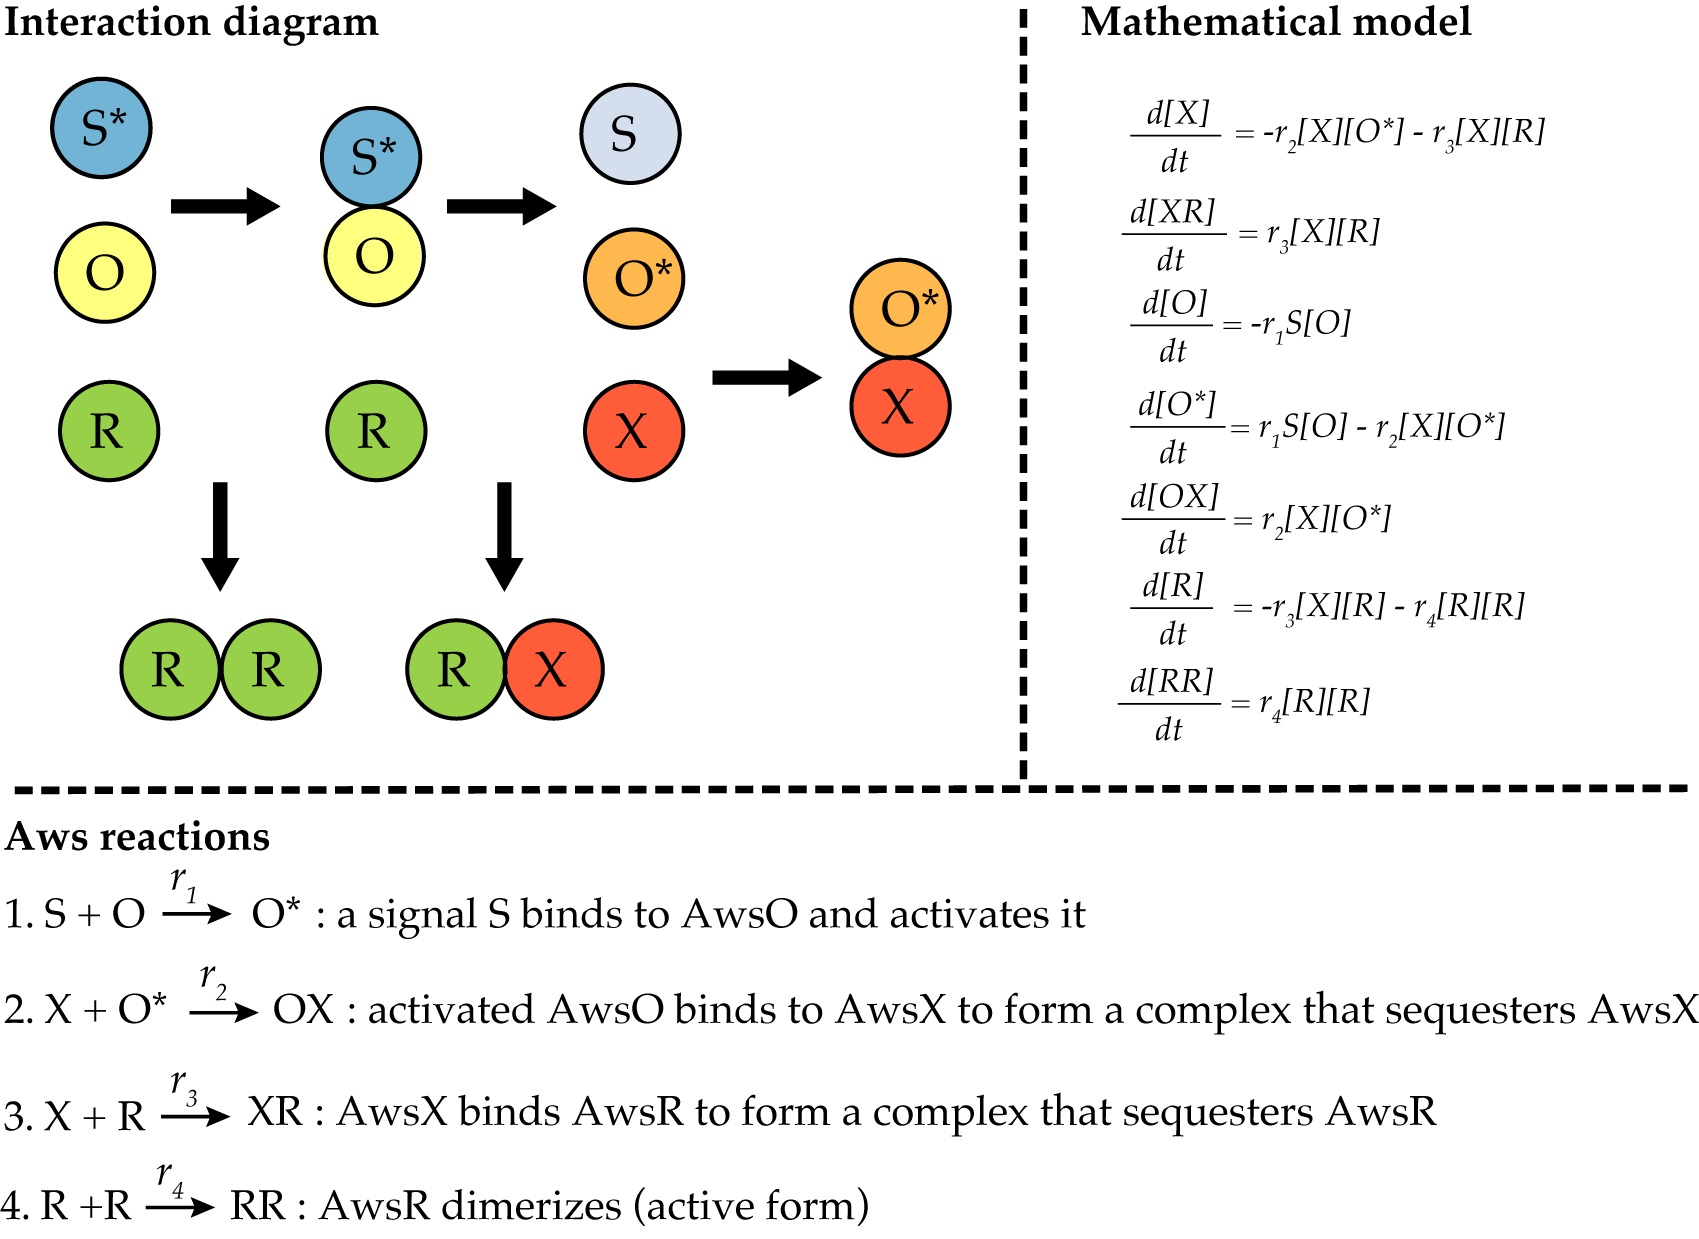
Figure 2. Modeling of the AWS network. The reactions of the AWS regulatory network from (Lind et al., 2019) can be illustrated by an interaction diagram. The mathematical model of AWS is a system of ordinary differential equations describing all reactions and rates. In this case, the active dimer RR is the indicator of phenotypic change.
- Choose parameter distributions to solve the differential equations
We assume that the systems of differential equations used to model the pathways cannot be solved analytically. To solve each system of differential equations numerically, three key pieces of information are needed:- Initial concentrations of the molecular compounds.
- Reaction rates for the interactions between compounds.
- Time interval over which to solve the differential equations.
- If there is any information concerning a) or b) that is known or can be estimated from empirical data then use this to constrain the sampling procedure. For unknown concentrations or reaction rates, choose a distribution for each that seems reasonable based on empirical data or at least encompasses a broad spectrum of likely dynamics. For instance, in Lind et al. (2019) there was no information concerning reaction rates or concentrations, so the authors chose the distribution for the reaction rates to be a uniform distribution on log space (i.e., 10U[−2,2]) and the distribution for initial concentrations to be a uniform distribution U[0,10]. These choices were in line with other pathway reaction kinetic models and allowed for numerically stable solutions. Importantly, whatever distributions are chosen, it is useful to see the effects of different choices on the results of the pathway comparison as part of a post-analysis parameter sensitivity study.
- The time interval for numerical solving the differential equations depends on the particular molecular system and the dynamics of the indicator compound. If the indicator reaches a steady state then that might set the time interval; however, in some systems transient, short-term behavior may be more biologically relevant. A distribution could be chosen for the time to solve the differential equations; however, in practice it is often faster and easier to evaluate the results when a fixed time is chosen and used for all models–especially when all other parameters are sampled randomly.
- Choose distributions for the effects of mutations and the amount of change in the indicator compound that corresponds to phenotypic change
The prior steps allow for the computation of the indicator compound in each pathway, as a baseline for comparison. The choices made in this step will allow numerical solution of a pathway’s differential equation model following a mutation (or set of mutations) and determination of whether the phenotype has changed.- We assume that the relevant mutations to a pathway are those that alter reaction rates, i.e., change the internal dynamics of a pathway, and we classify mutations as enabling or disabling based on whether they increase/decrease reaction rates. Thus, we need a way of determining new reaction rate(s) in the differential equation model of a pathway, following a mutation (or a set of mutations). Ideally, one would have information on all possible mutations and their effects on reaction rates. However, this is unlikely to be available. In the absence of empirical data, a distribution should be picked such that given a reaction rate and whether a mutation increases or decreases reaction rates, a new reaction rate is determined. For example, in (Lind et al., 2019) enabling mutations were assumed to affect reaction rates multiplicatively and thus new reaction rates were computed as the product of the original reaction rate and a multiplicative factor sampled from 10U[0,2] (similarly a factor of 10U[−2,0]) was used for disabling mutations.
- The differential equation models for each pathway link the concentration of an indicator compound to a phenotype. Since the sampling distributions in Step B may result in different baseline concentrations of indicator compound, there needs to be a way of assessing whether a mutation (or set of mutations) produces a phenotypic change. In the absence of empirical data, a simple approach is to establish that if the indicator increases in concentration above some threshold then the phenotype changes. The actual threshold will depend on the biological system and how much of a change in the indicator is biologically relevant. Without this information, the threshold should be high enough to avoid issues of numerical precision and will depend on the differential equation solver and its parameters (e.g., step sizes in Runge-Kutta methods). For simplicity, we used a threshold of 0.000001 which was similar in magnitude to the numerical tolerances used in the differential equation solver.
- Run simulation routine to compute the likelihood of a phenotypic change given all combinations of mutations
Use the code “Run Model Comparison” (https://github.com/ericlibby/BioProtocol/blob/master/RunModelComparison.m) to generate the data. The pseudocode for “Run Model Comparison” is included below as Algorithm 1 (Figure 3). “Run Model Comparison” use the procedure “Phenotype Change” for each pathway to compute the probability that mutation in a pathway causes a phenotypic change. The pseudocode for “Phenotype Change” is shown in Figure 3. “Phenotype Change” uses several procedures to set the parameter distributions (Procedure B, C above). The pseudocode for these are shown in Figure 4. To visualize the results, use the code “Plot Model Comparison” (https://github.com/ericlibby/BioProtocol/blob/master/PlotModelComparison.m) to create a contour plot that shows the log2 ratio of relative probabilities between two pathways with axes denoting the probabilities of enabling and disabling change.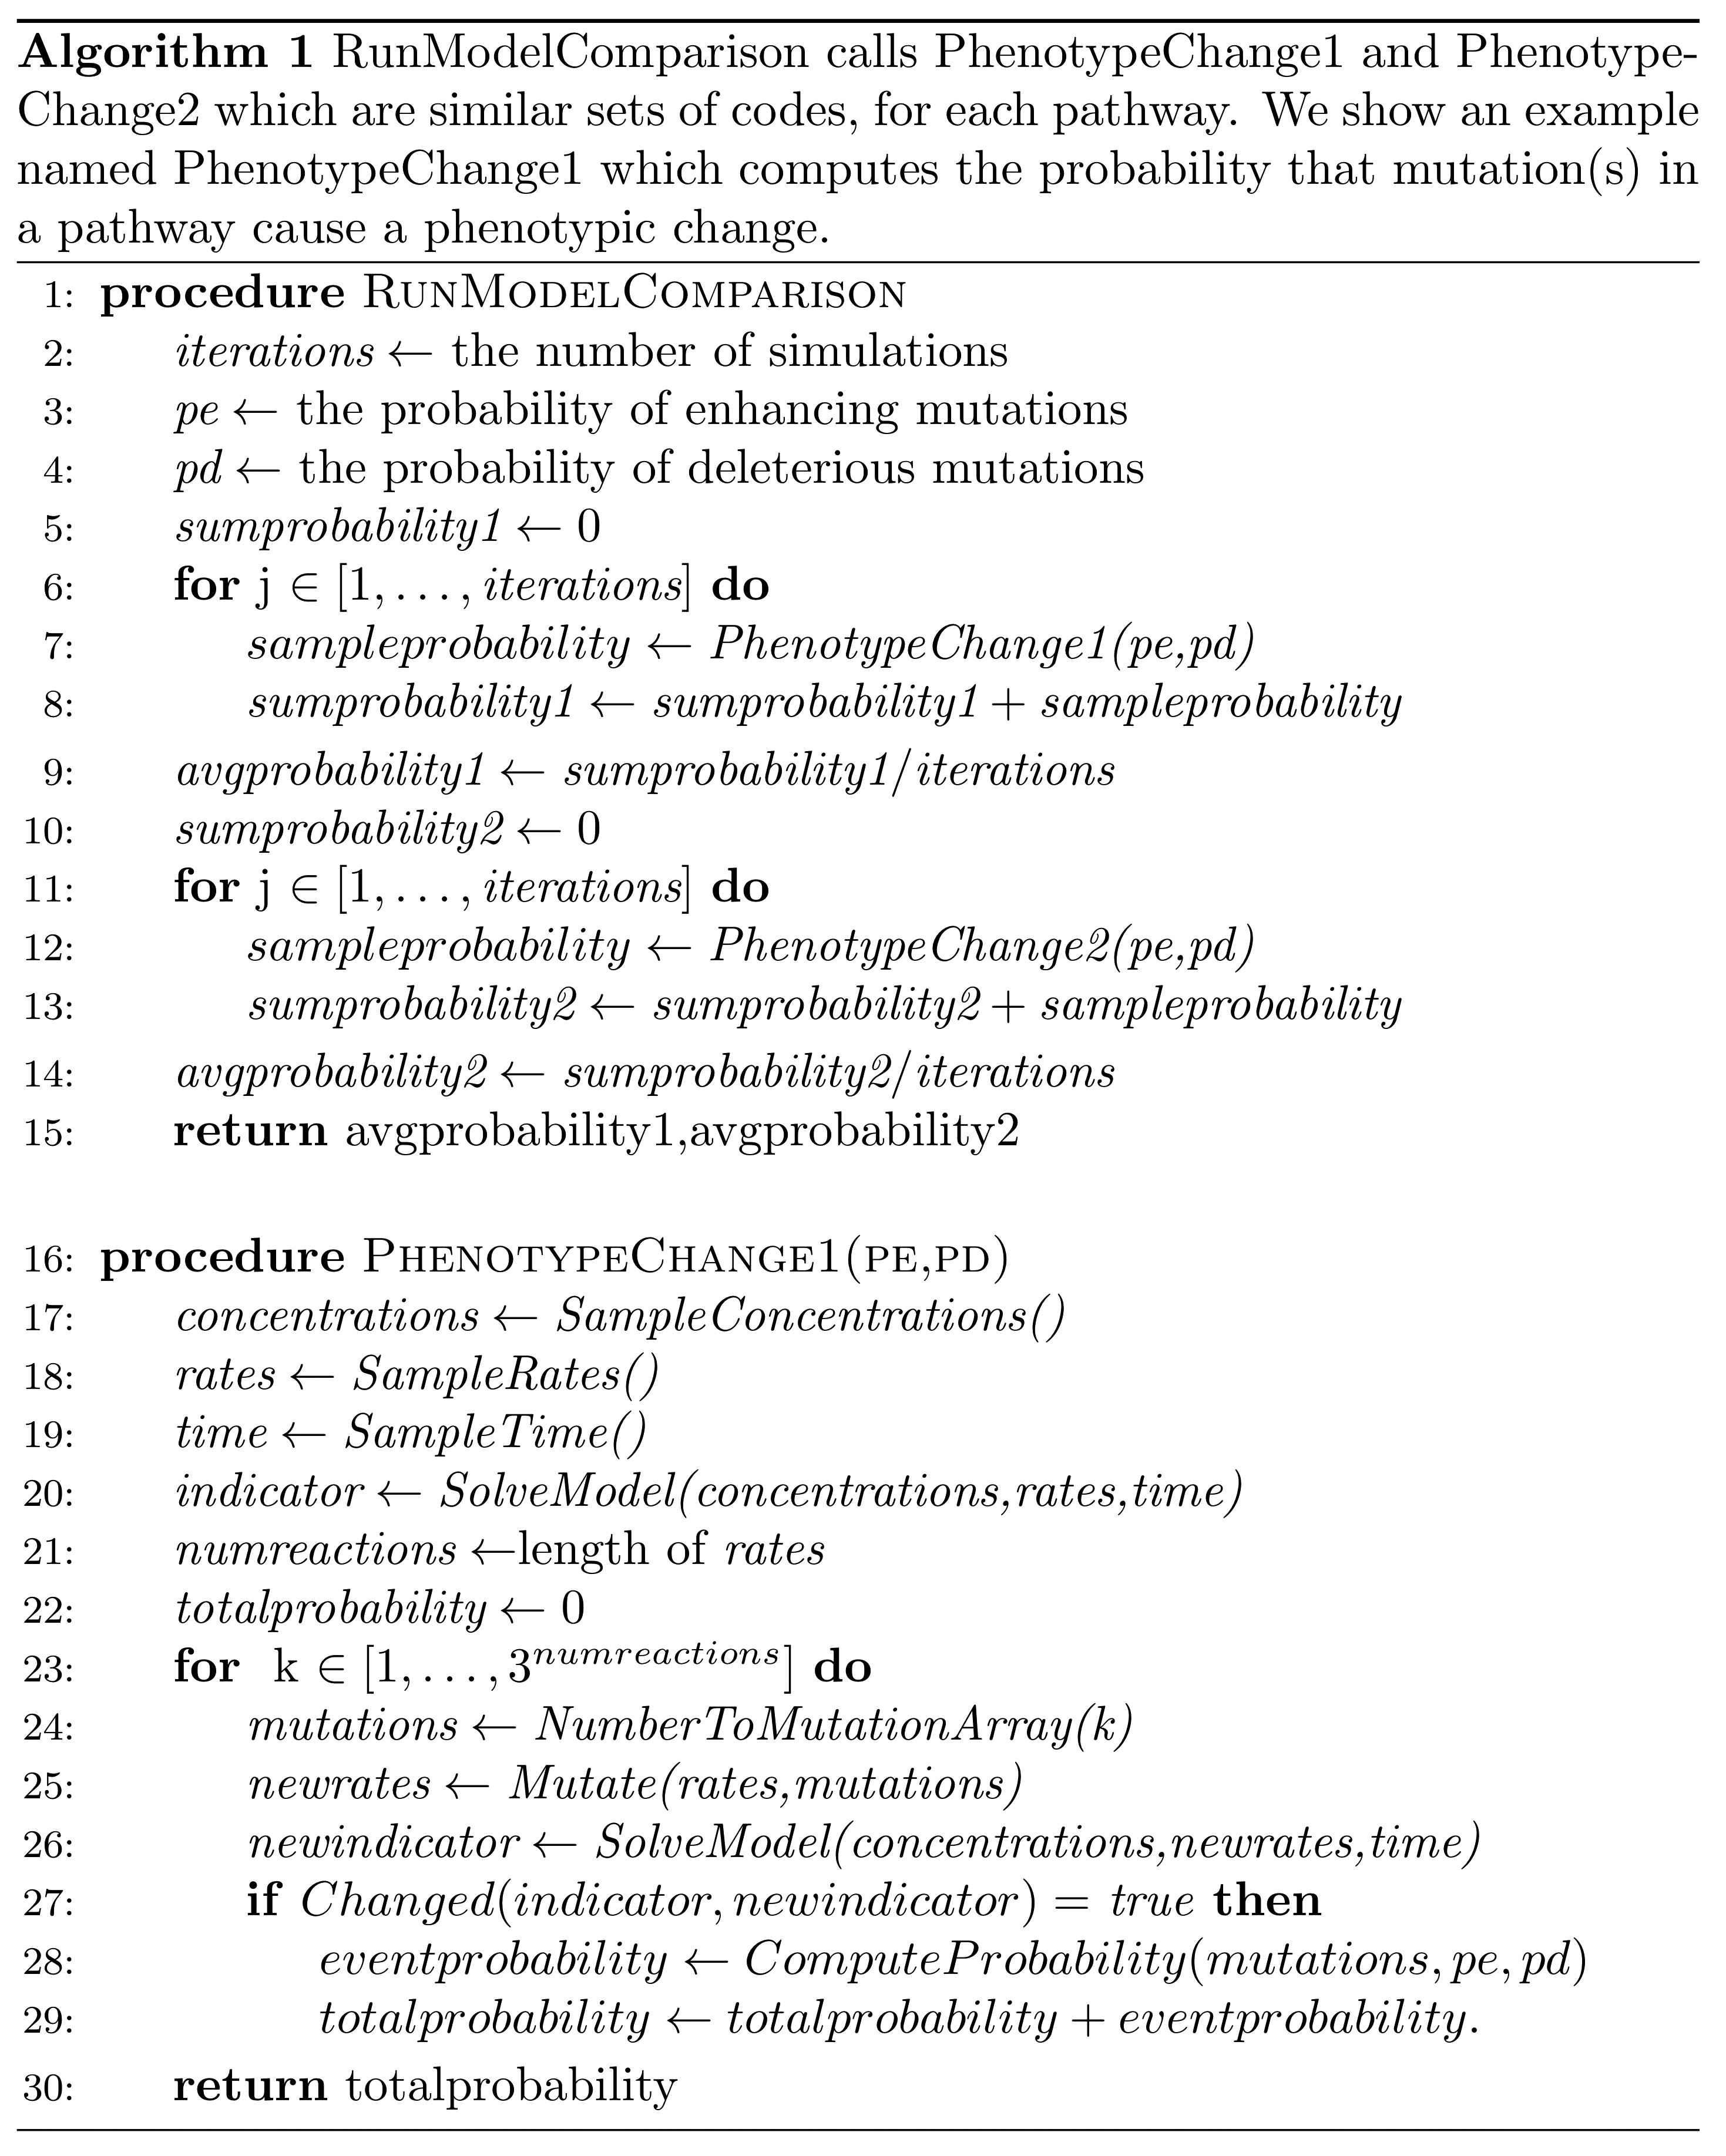
Figure 3. Pseudocode for the “RunModelComparison” and “PhenotypeChange” procedures. “PhenotypeChange” compute the probability that mutation in a pathway causes a phenotypic change. “RunModelComparison” computes the relative likelihood that Pathway 1 is used relative to Pathway 2. MATLAB code for RunModelComparison is available at https://github.com/ericlibby/BioProtocol/blob/master/RunModelComparison.m.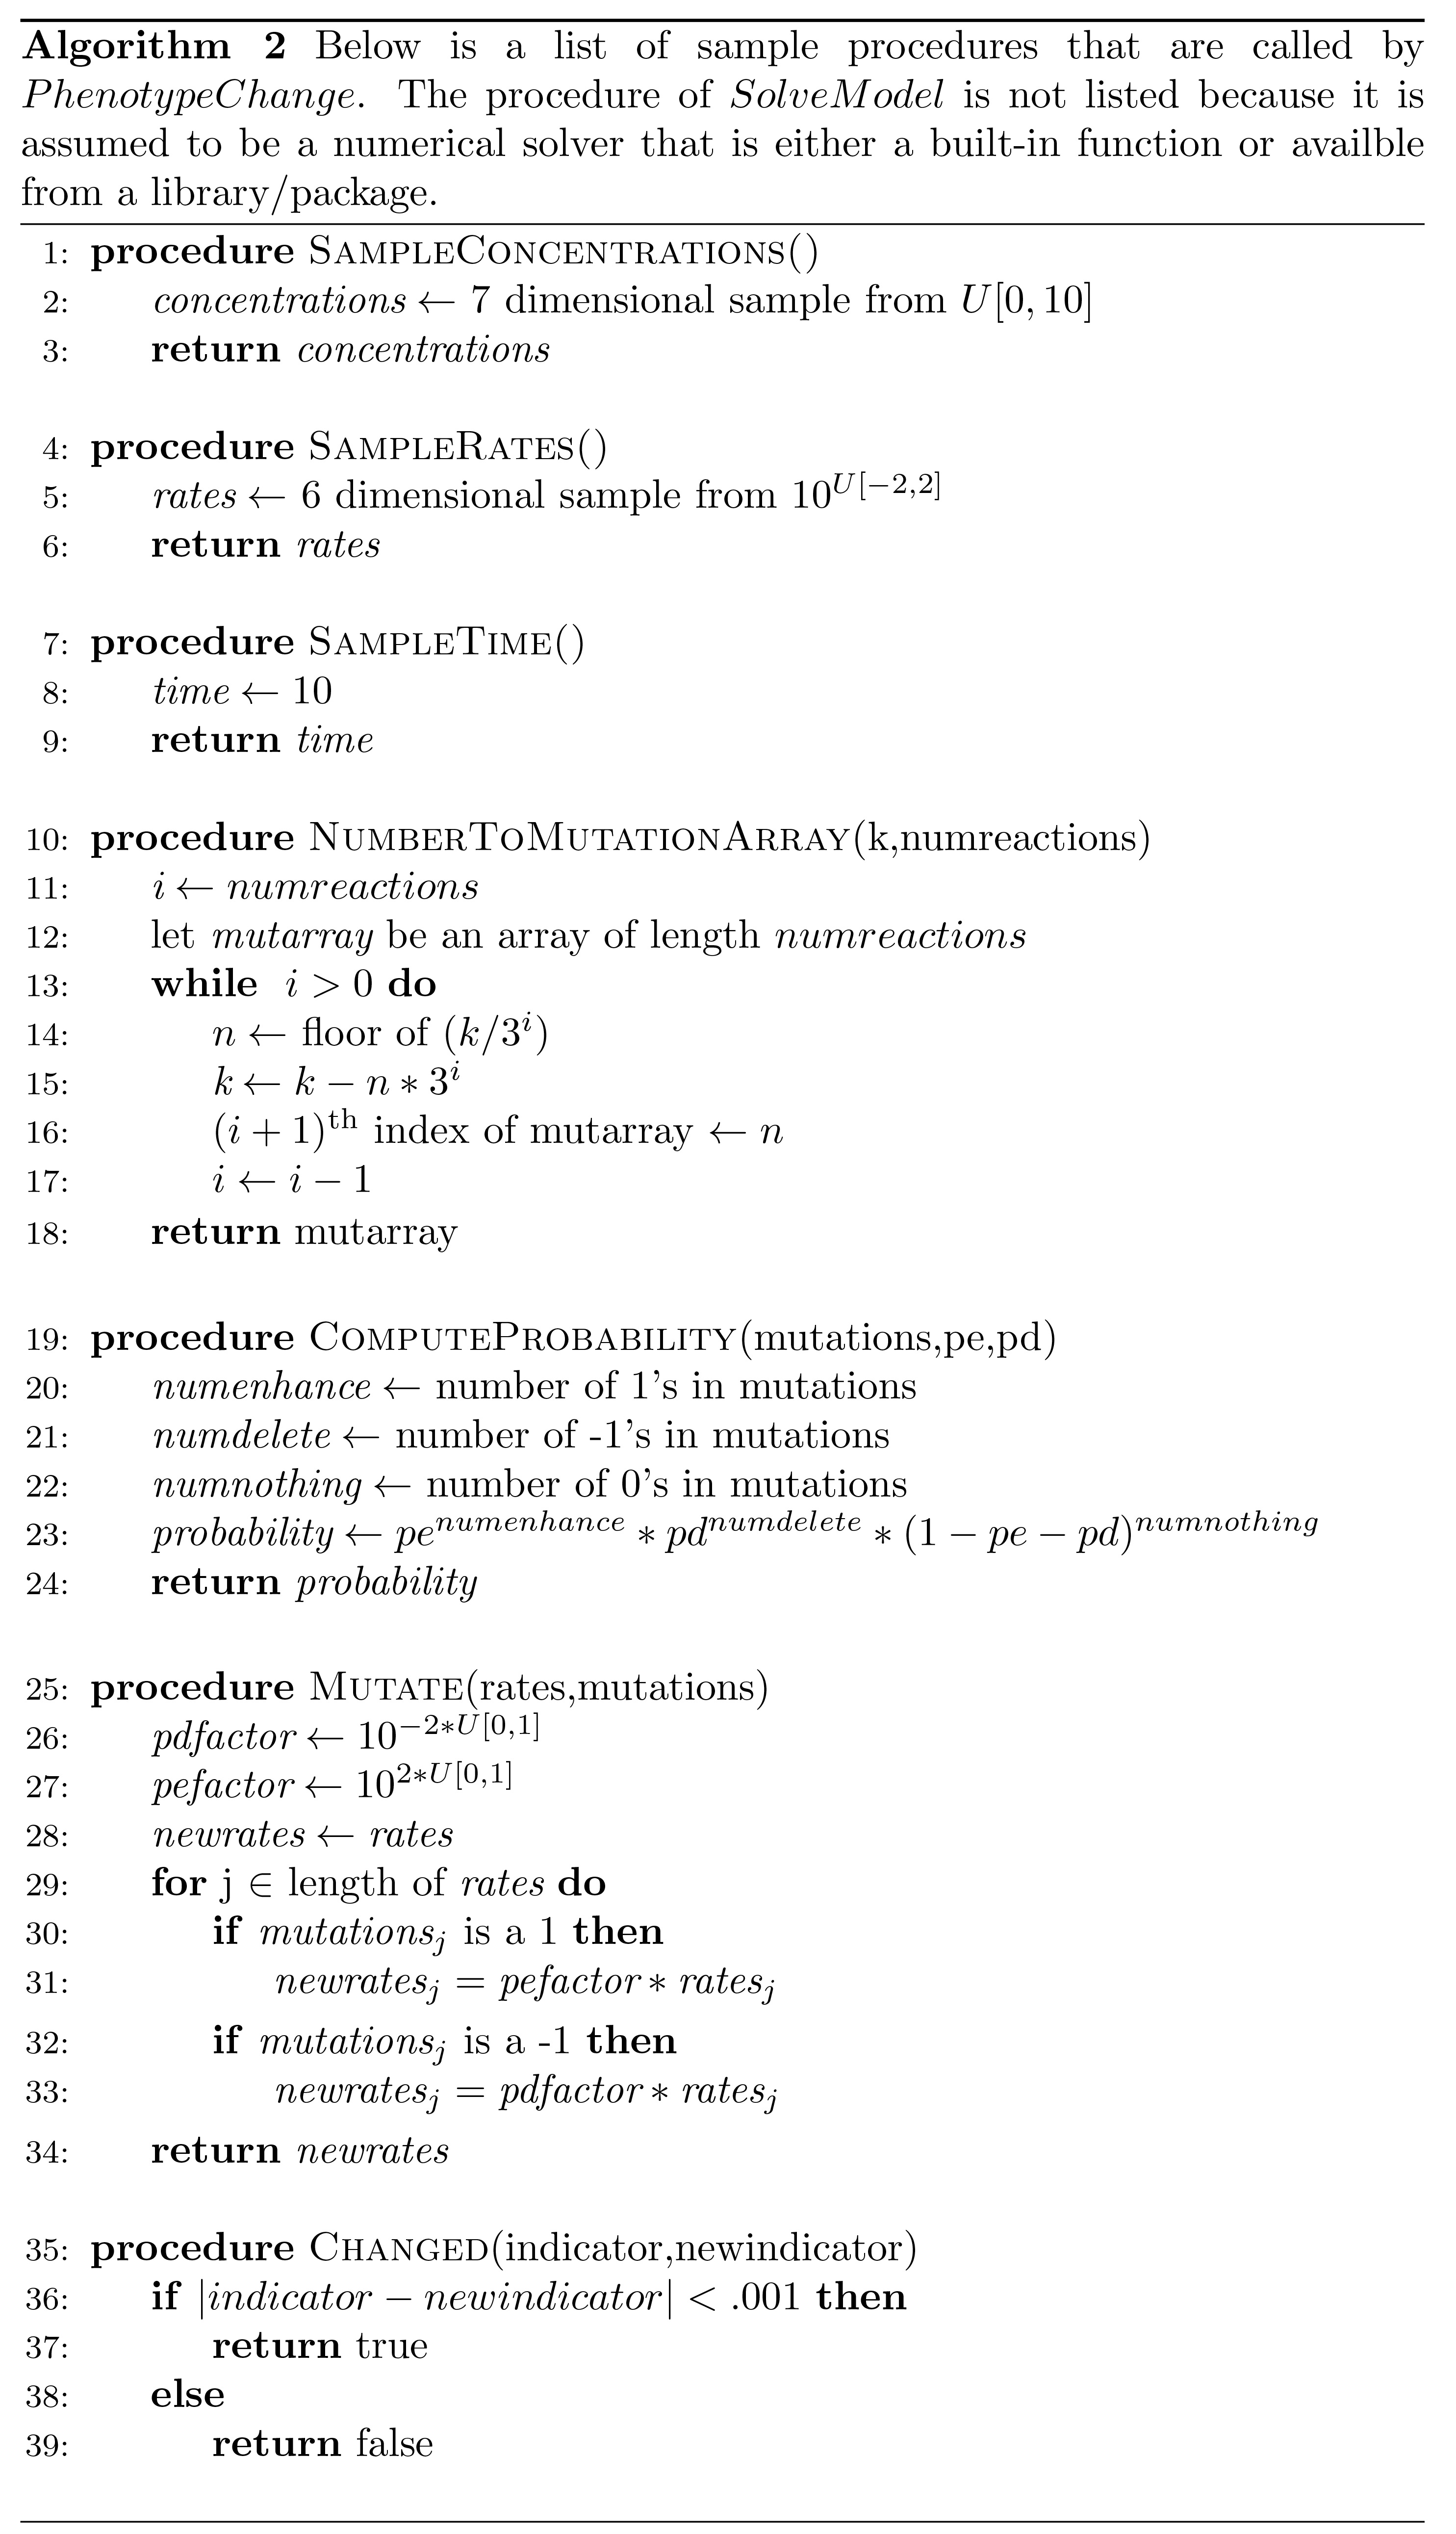
Figure 4. Pseudocode for procedures used by “PhenotypeChange” procedure shown in Figure 3. The SolveModel procedure is not listed as it is assumed to be a numerical solver available as a built-in function or from a library/package.
Data analysis
The result of running the codes “Run Model Comparison” (https://github.com/ericlibby/BioProtocol/blob/master/RunModelComparison.m) and “Plot Model Comparison” (https://github.com/ericlibby/BioProtocol/blob/master/PlotModelComparison.m) is a contour plot that shows the ratio of likelihoods that the pathways produce a phenotypic change for different values of the probabilities of enhancing and disabling mutations (the vertical and horizontal axes, respectively). In terms of statistical analyses, it depends on the conclusions that are drawn. The contour plot only shows the ratio of the average likelihood for each pathway. Further analyses can investigate the standard deviation or maximum/minimum of the likelihoods. We recommend that additional analyses be performed to validate any conclusions. In particular, the analyses can be performed again with changes to the probability distributions to test for parameter sensitivity. Alternatively, the number of iterations can be increased/decreased by some factor to evaluate whether the contour plot remains stable. Examples of these analyses can be found in Figure 5 and associated methods of Lind et al., 2019.
Acknowledgments
This protocol was adapted from (Lind et al., 2019).
Competing interests
The authors declare no competing financial interest.
References
- Bocci, F., Suzuki, Y., Lu, M. and Onuchic, J. N. (2018). Role of metabolic spatiotemporal dynamics in regulating biofilm colony expansion. Proc Natl Acad Sci U S A 115: 4288-4293.
- Bromberg, Y. and Rost, B. (2007). SNAP: predict effect of non-synonymous polymorphisms on function. Nucleic Acids Res 35(11): 3823-3835.
- Capriotti, E., Calabrese, R., Fariselli, P., Martelli, P. L., Altman, R. B. and Casadio, R. (2013). WS-SNPs&GO: a web server for predicting the deleterious effect of human protein variants using functional annotation. BMC Genomics 14 Suppl 3: S6.
- Capriotti, E., Fariselli, P. and Casadio, R. (2005). I-Mutant2.0: predicting stability changes upon mutation from the protein sequence or structure. Nucleic Acids Res 33(Web Server issue): W306-310.
- Celniker, G., Nimrod, G., Ashkenazy, H., Glaser, F., Martz, E., Mayrose, I., Pupko, T. and Ben-Tal, N. (2013). ConSurf: using evolutionary data to raise testable hypotheses about protein function. Isr J Chem 53: 199-206.
- Chandrasekaran, S. and Price, N. D. (2010). Probabilistic integrative modeling of genome-scale metabolic and regulatory networks in Escherichia coli and Mycobacterium tuberculosis. Proc Natl Acad Sci U S A 107: 17845-17850.
- Choi, Y. and Chan, A. P. (2015). PROVEAN web server: a tool to predict the functional effect of amino acid substitutions and indels. Bioinformatics 31(16): 2745-2747.
- Dehouck, Y., Kwasigroch, J. M., Gilis, D. and Rooman, M. (2011). PoPMuSiC 2.1: a web server for the estimation of protein stability changes upon mutation and sequence optimality. BMC Bioinformatics 12: 151.
- Edwards, J. S. and Palsson, B. O. (2000). Metabolic flux balance analysis and the in silico analysis of Escherichia coli K-12 gene deletions. BMC Bioinformatics 1: 1.
- Kumar, P., Henikoff, S. and Ng, P. C. (2009). Predicting the effects of coding non-synonymous variants on protein function using the SIFT algorithm. Nat Protoc 4(7): 1073-1081.
- Lind, P. A. (2018). Evolutionary forecasting of phenotypic and genetic outcomes of experimental evolution in Pseudomonas. bioRxiv. 342261.
- Lind, P. A., Arvidsson, L., Berg, O. G. and Andersson, D. I. (2017). Variation in mutational robustness between different proteins and the predictability of fitness effects. Mol Biol Evol 34(2): 408-418.
- Lind, P. A., Farr, A. D. and Rainey, P. B. (2015). Experimental evolution reveals hidden diversity in evolutionary pathways. Elife 4: e07074.
- Lind, P. A., Libby, E., Herzog, J. and Rainey, P. B. (2019). Predicting mutational routes to new adaptive phenotypes. Elife 8: e38822.
- Liu, J., Prindle, A., Humphries, J., Gabalda-Sagarra, M., Asally, M., Lee, D. Y., Ly, S., Garcia-Ojalvo, J. and Suel, G. M. (2015). Metabolic co-dependence gives rise to collective oscillations within biofilms. Nature 523(7562): 550-554.
- Luksza, M. and Lassig, M. (2014). A predictive fitness model for influenza. Nature 507(7490): 57-61.
- McCandlish, D. M. and Stoltzfus, A. (2014). Modeling evolution using the probability of fixation: history and implications. Q Rev Biol 89(3): 225-252.
- Neher, R. A., Russell, C. A. and Shraiman, B. I. (2014). Predicting evolution from the shape of genealogical trees. Elife 3: e03568.
- O'Brien EJ, Monk JM, Palsson BO. (2015). Using Genome-scale Models to Predict Biological Capabilities. Cell 161:971-987.
- Yates, C. M., Filippis, I., Kelley, L. A. and Sternberg, M. J. (2014). SuSPect: enhanced prediction of single amino acid variant (SAV) phenotype using network features. J Mol Biol 426(14): 2692-2701.
Article Information
Copyright
![]() Libby and Lind. This article is distributed under the terms of the Creative Commons Attribution License (CC BY 4.0).
Libby and Lind. This article is distributed under the terms of the Creative Commons Attribution License (CC BY 4.0).
How to cite
Readers should cite both the Bio-protocol article and the original research article where this protocol was used:
- Libby, E. and Lind, P. A. (2019). Probabilistic Models for Predicting Mutational Routes to New Adaptive Phenotypes. Bio-protocol 9(20): e3407. DOI: 10.21769/BioProtoc.3407.
- Lind, P. A., Libby, E., Herzog, J. and Rainey, P. B. (2019). Predicting mutational routes to new adaptive phenotypes. Elife 8: e38822.
Category
Microbiology > Microbial genetics
Systems Biology > Genomics > Screening
Do you have any questions about this protocol?
Post your question to gather feedback from the community. We will also invite the authors of this article to respond.