- Protocols

- Articles and Issues
- For Authors
- About
- Become a Reviewer

Subcellular Fractionation of Hela Cells for Lysosome Enrichment Using a Continuous Percoll-density Gradient
Published: Vol 9, Iss 18, Sep 20, 2019 DOI: 10.21769/BioProtoc.3362 Views: 10071
Reviewed by: Ralph Thomas BoettcherManish ChamoliAnonymous reviewer(s)
Original research article
The authors used this protocol in:
Feb 2019
Advertisement


Protocol Collections
Comprehensive collections of detailed, peer-reviewed protocols focusing on specific topics


Abstract
The enrichment of lysosomes is a useful way to study their structure and function. These dynamic vesicles can be enriched from cell cultures in a variety of ways including immunoprecipitation and fluorescence-activated organelle sorting. These methods are extremely precise but often require the transfection and expression of an affinity or fluorophore-tagged lysosomal membrane protein. A simpler approach uses differential density of subcellular organelles, which are characteristic to a particular type of organelle. Separation of organelles along a density-gradient enables fractionation to enrich for specific organelles (such as lysosomes) in their native state. This protocol outlines an optimized method for enriching lysosomes from HeLa cells with a continuous density-gradient that contains Percoll. Gentle cell lysis and extraction conditions yield dense-fractions that are enriched with functional and intact lysosomes, which can be assayed in downstream analyses. This method is quick (conducted in less than 2 h after harvesting cells), and can be easily scaled and optimized for other cell types.
Keywords: LysosomeBackground
The lysosomal system is the cell’s recycling center and is responsible for breaking down macromolecules such as proteins, carbohydrates and lipids. This system is responsible for quality control and is one of the cell’s front-line defenses against aging. As such, researching lysosomal function has found application in age-related diseases such as Alzheimer’s and Parkinson’s disease, which are both genetically associated with the lysosomal system (Gao et al., 2018), and display profound lysosomal system dysfunction (Whyte et al., 2017). The enrichment or purification of cellular organelles that are a part of the lysosomal system is a powerful way to study their structure and function.
Enrichment of subcellular structures such as lysosomes and related organelles from cell cultures can be conducted in a variety of ways including immunoprecipitation, fluorescence-activated organelle sorting, and magnetic separation of organelles that contain superparamagnetic iron nanoparticles (Gauthier et al., 2008; Abu-Remaileh et al., 2017; Lloyd-Lewis et al., 2018). Whilst being extremely precise these methods often require the transfection and expression of an affinity or fluorophore-tagged lysosomal membrane protein (e.g., LAMP1, LAMP2 or TMEM192). Density-gradients offer an alternative simple approach that takes advantage of the different densities of specific organelles.
The use of Percoll for the creation of density gradients with which cells can be fractionated and organelles enriched is an easy-to-use and well-established method (Pertoft et al., 1978). Separation of cell lysates along a density-gradient enables fractionation to enrich for specific organelles (such as lysosomes) in their native state. Percoll media itself is made of polydisperse silica particles that are coated in polyvinylpyrrolidone that have an average size in water of 35 nm. One of the main advantages of using Percoll above other media is that it has a low osmolality. Osmolality does not change with respect to position in a Percoll gradient. This contrasts with sucrose gradients, and even Ficoll (sucrose polymer) gradients that change in osmolality with respect to position in the density gradient (Pertoft, 2000).
This protocol outlines an optimized method for enriching lysosomes from HeLa cells with a density-gradient that contains Percoll (summarized in Figure 1A). Gentle extraction conditions yield dense-fractions that are enriched with functional and intact lysosomes. These fractions can be measured for lysosomal proteins and lysosomal enzyme activity (Cui et al., 2019). This method is quick (i.e., can be performed in < 2 h after harvesting cells), and can be easily scaled for size and optimized for other cell types.
Materials and Reagents
- 1.5 ml tube (Sigma, catalog number: T9661-500EA)
- 10 ml syringe (Terumo, catalog number: 55+10S)
- 10 ml tube (SARSTEDT, catalog number: 62-9924-284)
- 20 ml syringe (BD Plastipak, catalog number: 300613)
- 21 G x 1½” needle (Terumo, catalog number: NN*2138R)
- 23 cm cell scraper, radiation sterilized (Nunc, catalog number: 179693)
- 75 cm2 canted neck non-pyrogenic polystyrene (T75) flasks (Sigma, catalog number: CLS430641U-100EA)
- P200, P1000 pipette tips
- Parafilm (Bemis, catalog number: PM-996)
- HeLa cells (ATCC, catalog number: CRM-CCL-2)
- Thickwall open-top 31 ml ultracentrifuge tubes (Beckman Coulter, catalog number: 355631)
- cOmplete tablets, EDTA-free easy pack (protease inhibitors) (Roche, catalog number: 04693132001)
- Dulbecco’s Modified Eagle Medium, high glucose and L-glutamine (DMEM) (Gibco, catalog number: 11965-092)
- Dulbecco’s phosphate buffered saline (DPBS) (Gibco, catalog number: 14190-136)
- Ethylenediaminetetraacetic acid disodium salt dihydrate (EDTA) (Sigma Aldrich, catalog number: E5134)
- Foetal Bovine Serum (FBS) (Gibco, catalog number: 10099-141)
- HEPES (Sigma, catalog number: H3375-100G)
- Mixing cannula (catheter) (Fairmont Medical, catalog number: MIX1001)
- Percoll (GE Healthcare, catalog number: 17-0891-02)
- Sucrose (Sigma, catalog number: S0389-1KG)
- Trypsin-EDTA solution 1x (Sigma, catalog number: 59430C-100ML)
- (Optional) Pefabloc (Merck, catalog number: 11429868001), or Pepstatin A (Sigma-Aldrich, catalog number: 77170)
- Sucrose buffer (see Recipes)
- Sucrose buffer supplemented with protease inhibitors (see Recipes)
- 18% (v/v) Percoll/sucrose buffer (see Recipes)
Equipment
- Pipettes (P200, P1000)
- -80 °C freezer
- Cell culture incubator (Thermo Scientific, model: Heraeus HERAcell 150i)
- Centrifuge (Thermo Scientific, model: Heraeus Megafuge 40R)
- Laboratory-grade weighing scale
- Retort clamp
- Retort stand
- Fixed angle rotor (Beckman Coulter, model: Type 70Ti)
- Ultracentrifuge (Beckman Coulter, model: Optima XPN-100)
Procedure
- Maintain a T75 flask of HeLa cells in DMEM containing 10% FBS (culture medium) at 37 °C with 5% CO2 in a cell culture incubator until cells reach confluency.
- Pre-cool all centrifuges, ultracentrifuge and rotor to 4 °C.
- Wash the confluent T75 flask twice each with 10 ml of ice-cold DPBS and harvest cells by scraping into 5 ml of ice-cold DPBS.
- Transfer to a 10 ml tube and centrifuge the cells at 1,500 x g for 5 min at 4 °C. Discard the supernatant and resuspend the cell pellet.
- Resuspend the cell pellet in 1.5 ml of sucrose buffer containing protease inhibitors.
- Draw the cell suspension through a 21 G x 1½” needle into the chamber of a 10 ml syringe.
- Remove the needle and evacuate any air from within the syringe chamber such that the cell suspension is ~3 mm away from the tip.Note: Be careful when handling sharps, and dispose in sharps bin.
- Cover the syringe tip with 5-6 layers of parafilm to ensure that the cell suspensions do not leak from the syringe.
- To lyse cells, press the covered syringe tip firmly against a wall/bench top and pull the plunger backward maximally and release.Note: The vacuum of pressure within the syringe will cause the plunger to retract resulting in a “pop” sound (Video 1).
 Video 1. Lysing cells for subcellular fractionation. This video shows loading a cell suspension into a syringe, sealing this syringe and using it to lyse cells in a way that preserves organellar integrity for fractionation in a Percoll gradient.
 - Repeat Step 9 five more times for a total of 6x “pops” per sample.Note: Excessive “popping” will lyse the lysosomal membrane and disrupt their separation through the density-gradient. Six pops have been empirically determined as optimal for HeLa cells. If “pops” are not heard it may mean that syringe chamber is not air-tight (i.e., the parafilm on the syringe tip may be loose or punctured).
- Transfer all of the soluble fraction into a 10 ml tube and centrifuge at 200 x g for 10 min at 4 °C (Thermo Scientific) to separate the insoluble fraction (pellet: un-lysed cells, debris, plasma and nuclear membranes) from the soluble fraction (supernatant: cytosol, endosomes, lysosomes, endoplasmic reticulum etc.).
- Transfer the all of the soluble fraction to a 31 ml ultracentrifuge tube on ice and mix with 1.5 ml of sucrose buffer by gently pipetting up and down. This mixture is the input for subcellular fractions (Figure 2A).
- Remove 50 μl input and store at -80 °C.Note: The input is useful as a measure of normalization when treatments or genotypes are compared.
- Draw 13 ml of ice-cold 18% Percoll/sucrose buffer into the chamber of a 20 ml syringe. Attach a catheter to the tip of the syringe and evacuate any air from within the chamber such that the liquid is ~3 mm away from the tip of the catheter.
- Place the catheter into the ultracentrifuge tube and slowly deliver 13 ml of ice-cold 18% Percoll/sucrose buffer so that it forms a layer below the input. Gently remove the catheter.Note: The cell lysate (opaque) should be floating on top of the 18% Percoll/sucrose cushion (clear) (Figures 2B and 2C).
- Weigh each filled centrifuge tube and equilibrate their mass to within 0.01 g by gentle addition of sucrose buffer to the floating input.
- Gently place the ultracentrifuge tubes into the rotor and ultracentrifuge at 30,000 x g for 1 h at 4 °C. Set both acceleration and deceleration to maximum.Note: Ensure that the ultracentrifuge is balanced.
- Gently remove the ultracentrifuge tubes and secure the ultracentrifuge tube on ice until fractionation. The gradient should look relatively featureless (Figure 2D).
- Securely mount the retort clamp to the retort stand, then secure the centrifuge tube within the grip of the clamp.
- With a P1000 pipette, gently remove 1 ml fractions from the top-most layer of the gradient and store at -80 °C in 1.5 ml tubes numbered for identification. For each sample, number each fraction #1-16 (e.g., the top-most [least dense] fraction is nominated #1 and the bottom [most dense] fraction is nominated #16).Note: The fraction volume, and therefore the number of fractions can be modified to increase or decrease assay resolution. A total number of fractions between #15 and #20 is optimal.
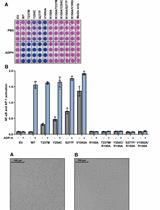
- Perform a quality control experiment to determine which fractions are enriched with lysosomes. Activity and protein analysis can be performed on neat samples taken from Percoll fractions. For example, analyze each fraction by Western blot, probing for the lysosome marker LAMP1 (Figure 1B). Analysis of the cation independent mannose-6-phosphate receptor (CI-M6PR) is useful as this receptor is present on endosomes but not lysosomes (Cheng et al., 2018), evident in fractions 13-18. Additionally, activity of lysosomal enzymes (such as β-hexosaminidase, β-glucocerebrosidase, β-galactosidase, and acid phosphatase) can be used to detect lysosomal fractions (Figure 1C) (Leaback and Walker, 1961; Kolodny and Mumford, 1976). If cell lysis was too vigorous and lysosomes were burst open, this will be revealed as a ‘flat’ β-hexosaminidase profile across the fractions as opposed to a profile that peaks in the denser fractions. Cell components other than endosomes and lysosomes will be present in this gradient as well. For example, plasma membrane will be enriched in the lightest fractions (Perret et al., 1979). Endoplasmic reticulum will also appear in lighter fractions, and the Golgi apparatus will appear in intermediate fractions. Mitochondria may appear in heavier fractions and need to be considered as potential contaminants when purifying lysosomal fractions (Suhy et al., 2000).
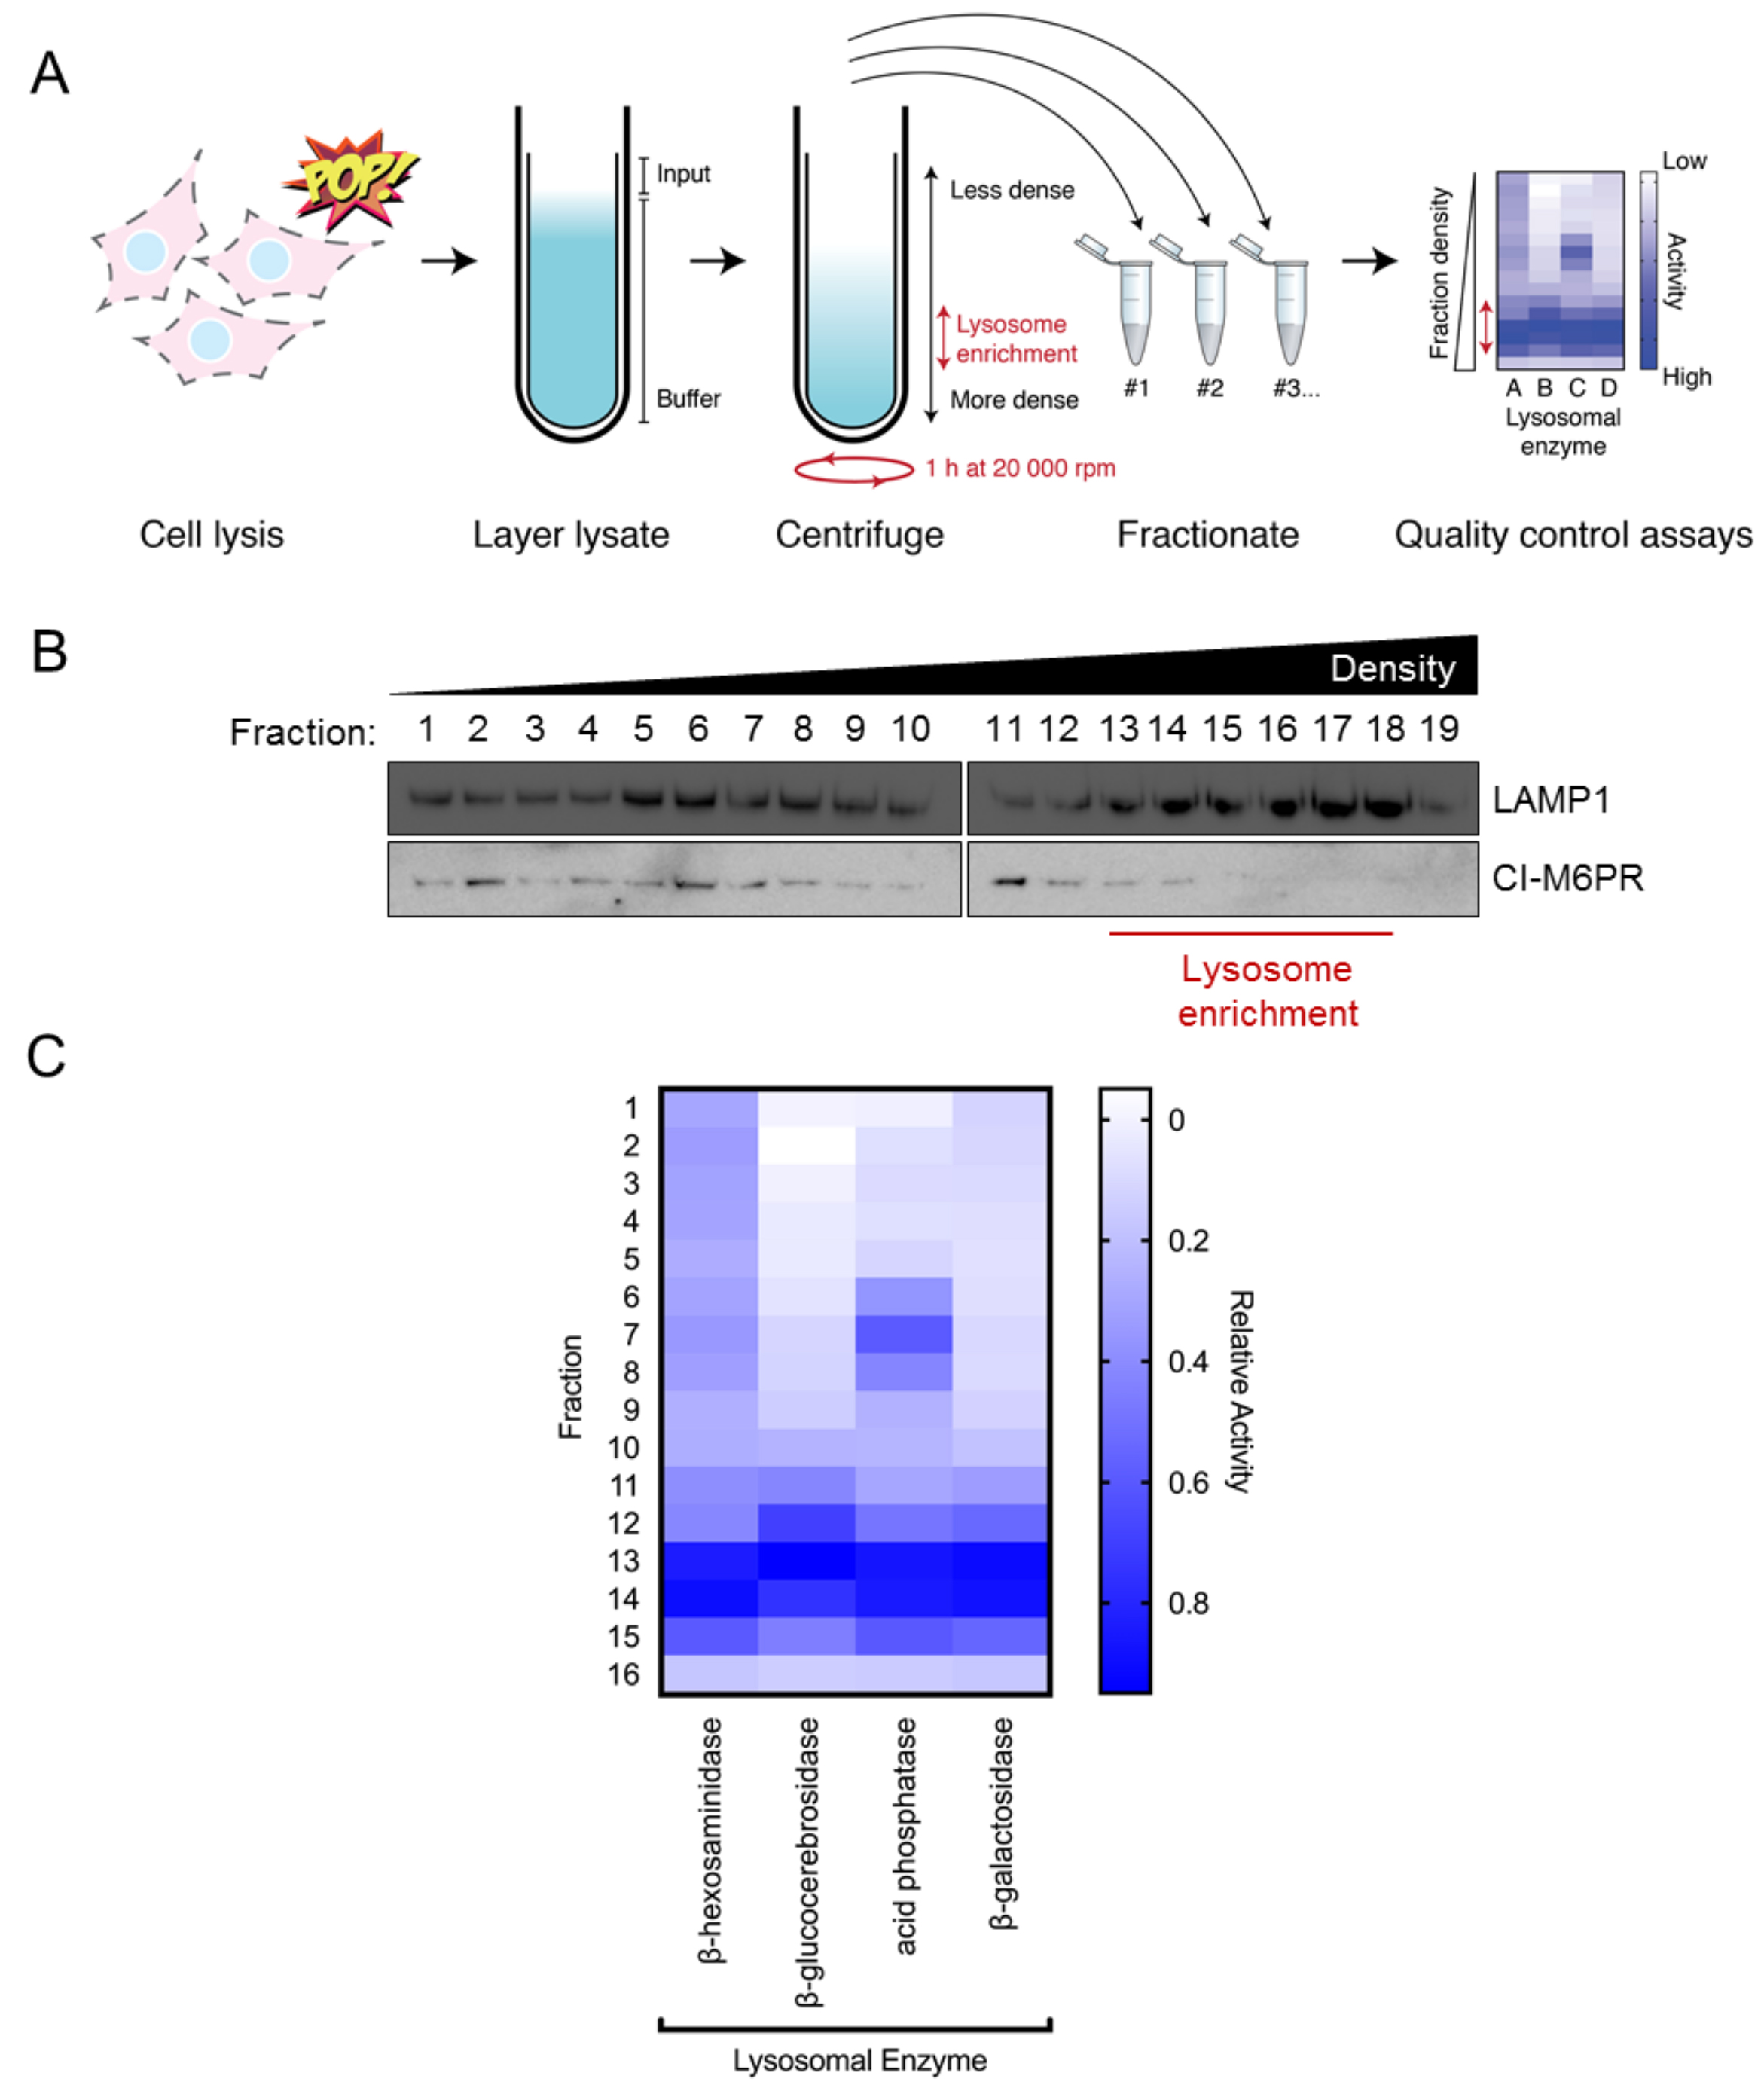
Figure 1. Density-gradients yield subcellular fractions that are enriched with lysosomes. A. Schematic of experimental workflow. Briefly, cells are gently lysed by popping in a syringe and the soluble fraction layered on top of a Percoll/sucrose cushion. Ultra-centrifugation for 1 h at 30,000 x g at 4 °C will distribute organelles along the gradient in a density-dependent manner. Top-to-bottom fractionation is used to separate organelles based on their sedimentation profile. Less dense organelles (such as early endosomes) sediment toward the top of the gradient, whereas denser organelles (such as late endosomes and lysosomes) sediment toward to bottom of the gradient. B. Western blot analysis of density-gradient fractions (#1-19; out of 19) from HeLa cells. Blots were probed for the late endosome/lysosome marker LAMP1. Note that LAMP1 is enriched in high-density fractions #13-18. C. Activity analysis of lysosomal enzymes across density-gradient fractions (#1-16; out of 16). Note that for all enzymes there is increased activity in high-density fractions #13-15. Data presented is the mean of three independent experiments.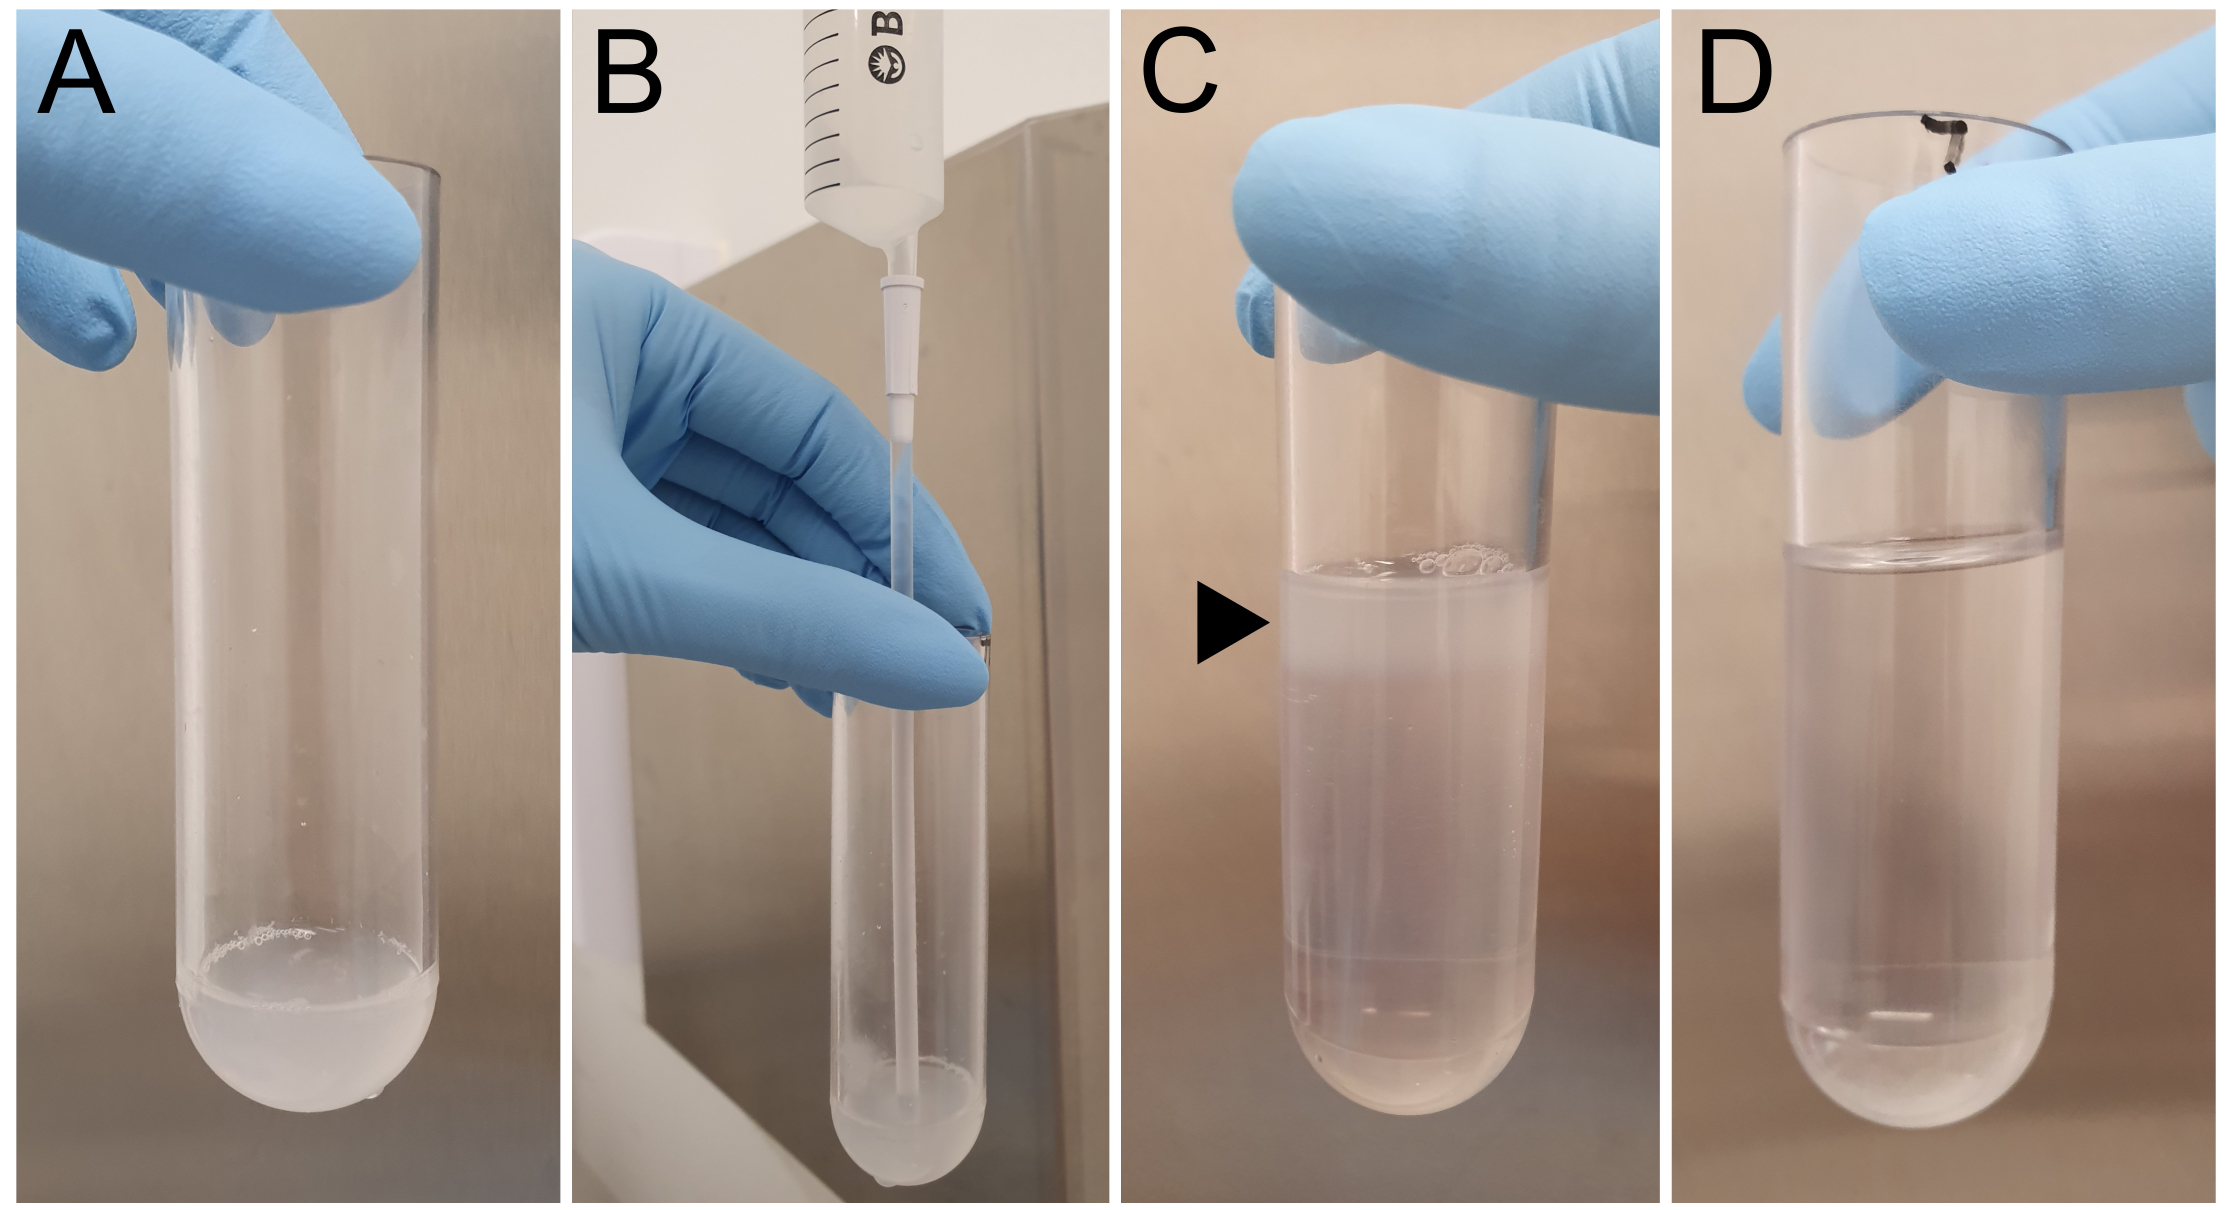
Figure 2. Preparation of a continuous Percoll gradient. A. Homogenized cell sample is placed into an ultracentrifuge tube. B. 18% Percoll is placed underneath the homogenized sample. C. Before ultracentrifugation, cell lysate should be seen as a discreet layer (black arrow) on top of the Percoll suspension. D. After centrifugation, the gradient appears relatively featureless, although high-density Percoll may be observed as a cloudy region or ‘button’ at the bottom of the tube.
Recipes
Prepare the following solutions and store at 4 °C until required.
Note: For all solutions, prepare more than is required to allow for pipetting errors.
- Sucrose buffer
250 mM sucrose
10 mM HEPES
1 mM EDTA at pH 7.4 (pH adjusted using NaOH)
This solution is stable at 4 °C for at least one-month and can therefore be prepared in advance - Sucrose buffer supplemented with protease inhibitors
Use one tablet of protease inhibitors per 25 ml of buffer
Prepare fresh on the day of experiment
Note: If downstream analysis of specific lysosomal proteases is anticipated, substitute EDTA-free protease inhibitors for specific protease inhibitors that will not impact measurement of the activity of the desired protease. For example, if cathepsin B is to be measured, do not use leupeptin or other cysteine protease inhibitors. However, in this situation, Pefabloc (Merck), or Pepstatin A (Sigma-Aldrich), which are serine and aspartyl protease inhibitors, respectively, could be used to provide some protection against proteolytic degradation. - 18% (v/v) Percoll/sucrose buffer
Prepare fresh on the day of experiment
Acknowledgments
This work was supported by the Hopwood Centre for Neurobiology, a Research Training Stipend and a Commonwealth Scholarship by the Australian Government (awarded to J.M.C). This protocol was adapted and modified from Cui et al. (2019). J.M.C and K.J.H optimized and performed key experiments. J.M.C wrote the manuscript, analysed data and prepared all figures. J.M.C, K.J.H, R.D.T, Y.C, Z.Y and T.J.S critically reviewed the manuscript.
Competing interests
T.J.S and co-authors declare no conflicts of interest.
References
- Abu-Remaileh, M., Wyant, G. A., Kim, C., Laqtom, N. N., Abbasi, M., Chan, S. H., Freinkman, E. and Sabatini, D. M. (2017). Lysosomal metabolomics reveals V-ATPase- and mTOR-dependent regulation of amino acid efflux from lysosomes. Science 358(6364): 807-813.
- Cui, Y., Carosi, J. M., Yang, Z., Ariotti, N., Kerr, M. C., Parton, R. G., Sargeant, T. J. and Teasdale, R. D. (2019). Retromer has a selective function in cargo sorting via endosome transport carriers. J Cell Biol 218(2): 615-631.
- Cheng, X. T., Xie, Y. X., Zhou, B., Huang, N., Farfel-Becker, T. and Sheng, Z. H. (2018). Characterization of LAMP1-labeled nondegradative lysosomal and endocytic compartments in neurons. J Cell Biol 217(9): 3127-3139.
- Gao, S., Casey, A. E., Sargeant, T. J. and Makinen, V. P. (2018). Genetic variation within endolysosomal system is associated with late-onset Alzheimer's disease. Brain 141(9): 2711-2720.
- Gauthier, D. J., Sobota, J. A., Ferraro, F., Mains, R. E. and Lazure, C. (2008). Flow cytometry-assisted purification and proteomic analysis of the corticotropes dense-core secretory granules. Proteomics 8(18): 3848-3861.
- Kolodny, E. H. and Mumford, R. A. (1976). Human leukocyte acid hydrolases: characterization of eleven lysosomal enzymes and study of reaction conditions for their automated analysis. Clin Chim Acta 70(2): 247-257.
- Leaback, D. H. and Walker, P. G. (1961). Studies on glucosaminidase. 4. The fluorimetric assay of N-acetyl-β-glucosaminidase. Biochem J 78: 151-156.
- Lloyd-Lewis, B., Krueger, C. C., Sargeant, T. J., D'Angelo, M. E., Deery, M. J., Feret, R., Howard, J. A., Lilley, K. S. and Watson, C. J. (2018). Stat3-mediated alterations in lysosomal membrane protein composition. J Biol Chem 293(12): 4244-4261.
- Pertoft, H. (2000). Fractionation of cells and subcellular particles with Percoll. J Biochem Biophys Methods 44(1-2): 1-30.
- Pertoft, H., Warmegard, B. and Hook, M. (1978). Heterogeneity of lysosomes originating from rat liver parenchymal cells. Metabolic relationship of subpopulations separated by density-gradient centrifugation. Biochem J 174(1): 309-317.
- Perret, B., Chap, H. J. and Douste-Blazy, L. (1979). Asymmetric distribution of arachidonic acid in the plasma membrane of human platelets. A determination using purified phospholipases and a rapid method for membrane isolation. Biochim Biophys Acta 556(3): 434-446.
- Suhy, D. A., Giddings, T. H., Jr. and Kirkegaard, K. (2000). Remodeling the endoplasmic reticulum by poliovirus infection and by individual viral proteins: an autophagy-like origin for virus-induced vesicles. J Virol 74(19): 8953-8965.
- Whyte, L. S., Lau, A. A., Hemsley, K. M., Hopwood, J. J. and Sargeant, T. J. (2017). Endo-lysosomal and autophagic dysfunction: a driving factor in Alzheimer's disease? J Neurochem 140(5): 703-717.
Article Information
Copyright
© 2019 The Authors; exclusive licensee Bio-protocol LLC.
How to cite
Readers should cite both the Bio-protocol article and the original research article where this protocol was used:
- Carosi, J. M., Hattersly, K. J., Cui, Y., Yang, Z., Teasdale, R. D. and Sargeant, T. J. (2019). Subcellular Fractionation of Hela Cells for Lysosome Enrichment Using a Continuous Percoll-density Gradient. Bio-protocol 9(18): e3362. DOI: 10.21769/BioProtoc.3362.
- Cui, Y., Carosi, J. M., Yang, Z., Ariotti, N., Kerr, M. C., Parton, R. G., Sargeant, T. J. and Teasdale, R. D. (2019). Retromer has a selective function in cargo sorting via endosome transport carriers. J Cell Biol 218(2): 615-631.
Category
Biochemistry > Protein > Activity
Cell Biology > Organelle isolation > Lysosome
Do you have any questions about this protocol?
Post your question to gather feedback from the community. We will also invite the authors of this article to respond.