- Protocols

- Articles and Issues
- For Authors
- About
- Become a Reviewer

Single-probe RNA FISH in Yeast

Published: Vol 8, Iss 11, Jun 5, 2018 DOI: 10.21769/BioProtoc.2868 Views: 9064
Reviewed by: Gal HaimovichChenchen LiuAnonymous reviewer(s)
Original research article
The authors used this protocol in:

Sep 2017
Advertisement


Protocol Collections
Comprehensive collections of detailed, peer-reviewed protocols focusing on specific topics


Abstract
Quantitative profiling of mRNA expression is an important part of understanding the state of a cell. The technique of RNA Fluorescence In Situ Hybridization (FISH) involves targeting an RNA transcript with a set of 40 complementary fluorescently labeled DNA oligonucleotide probes. However, there are many circumstances such as transcripts shorter than 200 nt, splicing variations, or alternate initiation sites that create transcripts that would be indistinguishable to a set of multiple probes. To this end we adapted the standard FISH protocol to allow the use of a single probe with a single fluorophore to quantify the amount of transcripts inside budding yeast cells. In addition to allowing the quantification of short transcripts or short features of transcripts, this technique reduces the cost of performing FISH.
Keywords: RNA FISHBackground
Precise quantification of the transcript profile of single cells is possible by single molecule Fluorescence In Situ Hybridization (smFISH). This procedure gives good signal to noise by targeting a single mRNA molecule with multiple fluorescently labeled DNA oligo probes (Raj and Tyagi, 2010). Using this scheme, mRNA of length shorter than 200 nucleotides cannot be detected. However, in most experiments, the absolute transcript copy number is less informative than the relative copy number. To detect short transcripts or sequences, a short single DNA oligo probe can be used. The detection efficiency of a single probe is greater than 50 percent when using a single fluorophore to count mRNA (Wadsworth et al., 2017).
Materials and Reagents
- Pyrex bottle (Corning, PYREXTM, catalog number: 13951L )
- Falcon tube 50 ml (VWR, catalog number: 89039-658 )
- Falcon tube 15 ml (VWR, catalog number: 89039-666 )
- Nitrile gloves (VWR, catalog number: 40101-348 )
- Light-duty tissue wipers (VWR, catalog number: 82003-820 )
- Lens cleaning tissues (Olympus, catalog number: C-0100 )
- Aluminum foil
- Pipette tips (VWR, catalog numbers: 89079-466 , 89079-460 , and 89079-472 )
- Plastic cuvettes (BrandTech Scientific, catalog number: 759075D )
- Culture flask (Corning, PYREXTM, catalog number: 4442-250 )
- Microcentrifuge tube (Corning, Axygen®, catalog number: MCT-175-C )
- Microcentrifuge tube rack (Thermo Fisher Scientific, catalog number: 5973-0015 )
- Petri dish (VWR, catalog number: 25384-088 )
- #1.5 18 mm square coverslip (Fisher Scientific, catalog number: 12-518-108B )
- Glass slide (Fisher Scientific, catalog number: 12-544-1 )
- Saccharomyces cerevisiae strains (collaborators or ATCC)
- Low Auto Fluorescence Immersion Oil (Thorlabs, catalog number: MOIL-30 )
- Ethanol (VWR, catalog number: BDH1156 )
- Methanol ≥ 99% ACS Spectrophotometric grade (Sigma-Aldrich, catalog number: 154903-2L )
- RNase free water (Quality Biological, catalog number: 351-068-131 )
- Fluorophore labeled DNA oligo probes, HPLC purified (Integrated DNA technologies or Eurofins Scientific)
- High Strength 5-min Epoxy (Amazon B001QFGTHG)
- Zymolyase-20T at 21,000 units/g (Zymolyase-20T, Seikagaku Business Corporation)
- SD Complete (see Recipes)
- Carbon, Nitrogen, and Salts (CNS)
Dextrose (Sigma-Aldrich, catalog number: G8270-25KG )
Ammonium sulfate (Sigma-Aldrich, catalog number: A4418-5KG )
Potassium phosphate monobasic (VWR, catalog number: MK710002 )
Magnesium sulfate (Sigma-Aldrich, catalog number: M2773-500G )
Sodium chloride (Fisher Scientific, catalog number: S671-500 )
Calcium chloride (Sigma-Aldrich, catalog number: C3306-250G )
Biotin (Sigma-Aldrich, catalog number: B4501-1G )
Calcium pantothenate (Sigma-Aldrich, catalog number: 21210-25G-F ) - Vitamins and trace elements (Vitamix)
Folic acid (Fisher Scientific, catalog number: BP251910 )
Inositol (Sigma-Aldrich, catalog number: 57569-25G )
Niacin (Acros Organics, catalog number: 128291000 )
P-aminobenzoic acid (Sigma-Aldrich, catalog number: A9878-25G )
Pyridoxine HCl (Acros Organics, catalog number: 150770500 )
Riboflavin (Sigma-Aldrich, catalog number: R9504-25G )
Thiamine HCl (Sigma-Aldrich, catalog number: T4625-25G )
Boric acid (Sigma-Aldrich, catalog number: B6768-500G )
Copper sulfate (Sigma-Aldrich, catalog number: C1297-100G )
Potassium iodide (Avantor Performance Materials, catalog number: JT3168-4 )
Ferric chloride (Acros Organics, catalog number: 217091000 )
Manganese sulfate (Sigma-Aldrich, catalog number: M7634-100G )
Sodium molybdate 2 (Sigma-Aldrich, catalog number: 243655-5G )
Zinc sulfate (Sigma-Aldrich, catalog number: Z4750-100G ) - Complete Supplement Mixture (CSM)
Adenine (Sigma-Aldrich, catalog number: A9126-25G )
Arginine (Sigma-Aldrich, catalog number: A5131-100G )
Aspartic acid (Acros Organics, catalog number: 105041000 )
Histidine (Sigma-Aldrich, catalog number: H8000-25G )
Isoleucine (Acros Organics, catalog number: 166170250 )
Leucine (Sigma-Aldrich, catalog number: L8000-100G )
Lysine (Sigma-Aldrich, catalog number: L5626-100G )
Methionine (Sigma-Aldrich, catalog number: M9625-25G )
Phenylalanine (Acros Organics, catalog number: 130311000 )
Threonine (Acros Organics, catalog number: 138930250 )
Tryptophan (Acros Organics, catalog number: 140590250 )
Tyrosine (Acros Organics, catalog number: 140641000 )
Uracil (Acros Organics, catalog number: 157300250 )
Valine (Acros Organics, catalog number: 140811000 ) - Bacto-agar (BD, catalog number: 214030 )
- Carbon, Nitrogen, and Salts (CNS)
- Buffer B (see Recipes)
Sorbitol (Sigma-Aldrich, catalog number: S6021-1KG )
Potassium phosphate (dibasic) (Sigma-Aldrich, catalog number: P3786-500G ) - Spheroplasting Buffer (see Recipes)
Vanadyl ribonucleoside complex (Fisher Scientific, catalog number: 50-812-650 ) - Hybridization Buffer (see Recipes)
Dextran sulfate (Sigma-Aldrich, catalog number: D8906-10G )
Escherichia coli tRNA (Sigma-Aldrich, catalog number: R1753-500UN )
BSA (RNase free) (Fisher Scientific, catalog number: BP671-1 )
20x SSC (RNase free) (Thermo Fisher Scientific, catalog number: AM9763 ) - Wash Buffer (see Recipes)
Formamide (RNase free) (VWR, catalog number: 97061-392 ) - Imaging Buffer (see Recipes)
6-hydroxy-2,5,7,8-tetramethylchroman-2-carboxylic acid (Trolox) (Sigma-Aldrich, catalog number: 238813-1G )
Tris base (For making 200 mM, pH 8 Tris- HCl) (Fisher Scientific, catalog number: BP152-500 )
Protocatechuic acid (PCA) (Sigma-Aldrich, catalog number: 08992-50MG )
Protocatechuate-3,4-dioxygenase (PCD) (Sigma-Aldrich, catalog number: P8279-25UN )
Equipment
- Pipettors (e.g., VWR, catalog number: 75786-304 )
- x-y translation mount (Thorlabs, catalog number: ST1XY-S )
- Fiberport (Thorlabs, catalog number: PAF-X-11-PC-A )
Note: This product has been superseded by part number PAF2P-11A . - Fiber optic cable (Thorlabs, catalog number: SM450 )
- Single mode fiberoptic cable (Thorlabs, catalog number: P5-460B-PCAPC-1 )
- Widefield microscope (e.g., Olympus, model: IX81 )
- Spectrophotometer (e.g., Eppendorf, catalog number: 2231000516 )
- Centrifuge (e.g., Thermo Fisher Scientific, model: SorvallTM LegendTM XTR , catalog number: 75004521)
- Lenses (e.g., Thorlabs, catalog numbers: ACN127-020-A , LB1157-A)
- Filters and dichroics (e.g., Semrock, catalog numbers: BLP01-635R-25 , FF650-Di01-25x36 )
- Micro-centrifuge (Eppendorf, catalog number: 022620100 )
- Incubator (e.g., Thermo Fisher Scientific, catalog number: 50125590 )
- Autoclave (e.g., YAMATO SCIENTIFIC, catalog number: SM300 )
- 60x or 100x high NA objective (e.g., Olympus, UPlanSApo 100X/1.4 Oil)
- EMCCD camera (e.g., Andor Technology, model: iXonEM + )
- Laser illumination (e.g., solid state laser: Oxxius, model: LCX-532L-100 ; Coherent, catalog number: 1185055 )
- Slide translation stage (e.g., Ludl Electronic Products, model: BioPoint2 X-Y Stage )
Software
- Melting temperature calculator (IDT, http://www.idtdna.com/calc/analyzer)
- RNA folding calculator (Mfold, http://unafold.rna.albany.edu/?q=mfold)
- Sequence specificity check (BLAST, https://blast.ncbi.nlm.nih.gov/Blast.cgi)
- Microscope control (Micromanager, https://micro-manager.org/)
- Spot counting software (Fish-Quant, https://bitbucket.org/muellerflorian/fish_quant)
- Matlab
Procedure
- Probe design
DNA oligo probes are designed by selecting an 18-30 nucleotide region in the target mRNA using four criteria.- The choice of probe length should be determined by the RNA-DNA melting temperature of the sequence, which can be done by using the calculator provided on the Integrated DNA Technologies, Inc (IDT) website.
- The probe should have minimal secondary structure.
- The target sequence should have minimal secondary structure. The secondary structure can be calculated for the RNA by using the Mfold website (Zuker, 2003). A proper choice has the 5’ end of the probe binding inside a loop rather than a stem in the secondary structure of the mRNA.
- The probe should be checked for homology with other sequences in the genome using BLAST (Basic Local Alignment Search Tool) (Johnson et al., 2008).
When labeled internally the fluorophore should be positioned 2 nt away from either end. - The choice of probe length should be determined by the RNA-DNA melting temperature of the sequence, which can be done by using the calculator provided on the Integrated DNA Technologies, Inc (IDT) website.
- Microscope design
Our microscope is a custom-built microscope configured in highly inclined illumination geometry (HILO). For single fluorophores, epi-fluorescence will not generate an adequate signal, Figure 1. It is necessary to have a variable angle geometry on the illumination (most TIR/HILO microscopes have this.) This can be achieved by using a fiber coupled laser or coupling a free space laser to a fiber using a fiberport and a fiber optic cable and moving the fiber output with an x-y translation mount (see Figure 2). Using the x-y translation, the beam can be adjusted away from the center of the back focal plane of the objective. Once this beam is displaced to the critical angle, total internal reflection geometry is achieved. The angle for inclined illumination is less than the critical angle and should be selected for optimum z-sectioning and intensity in the volume of interest.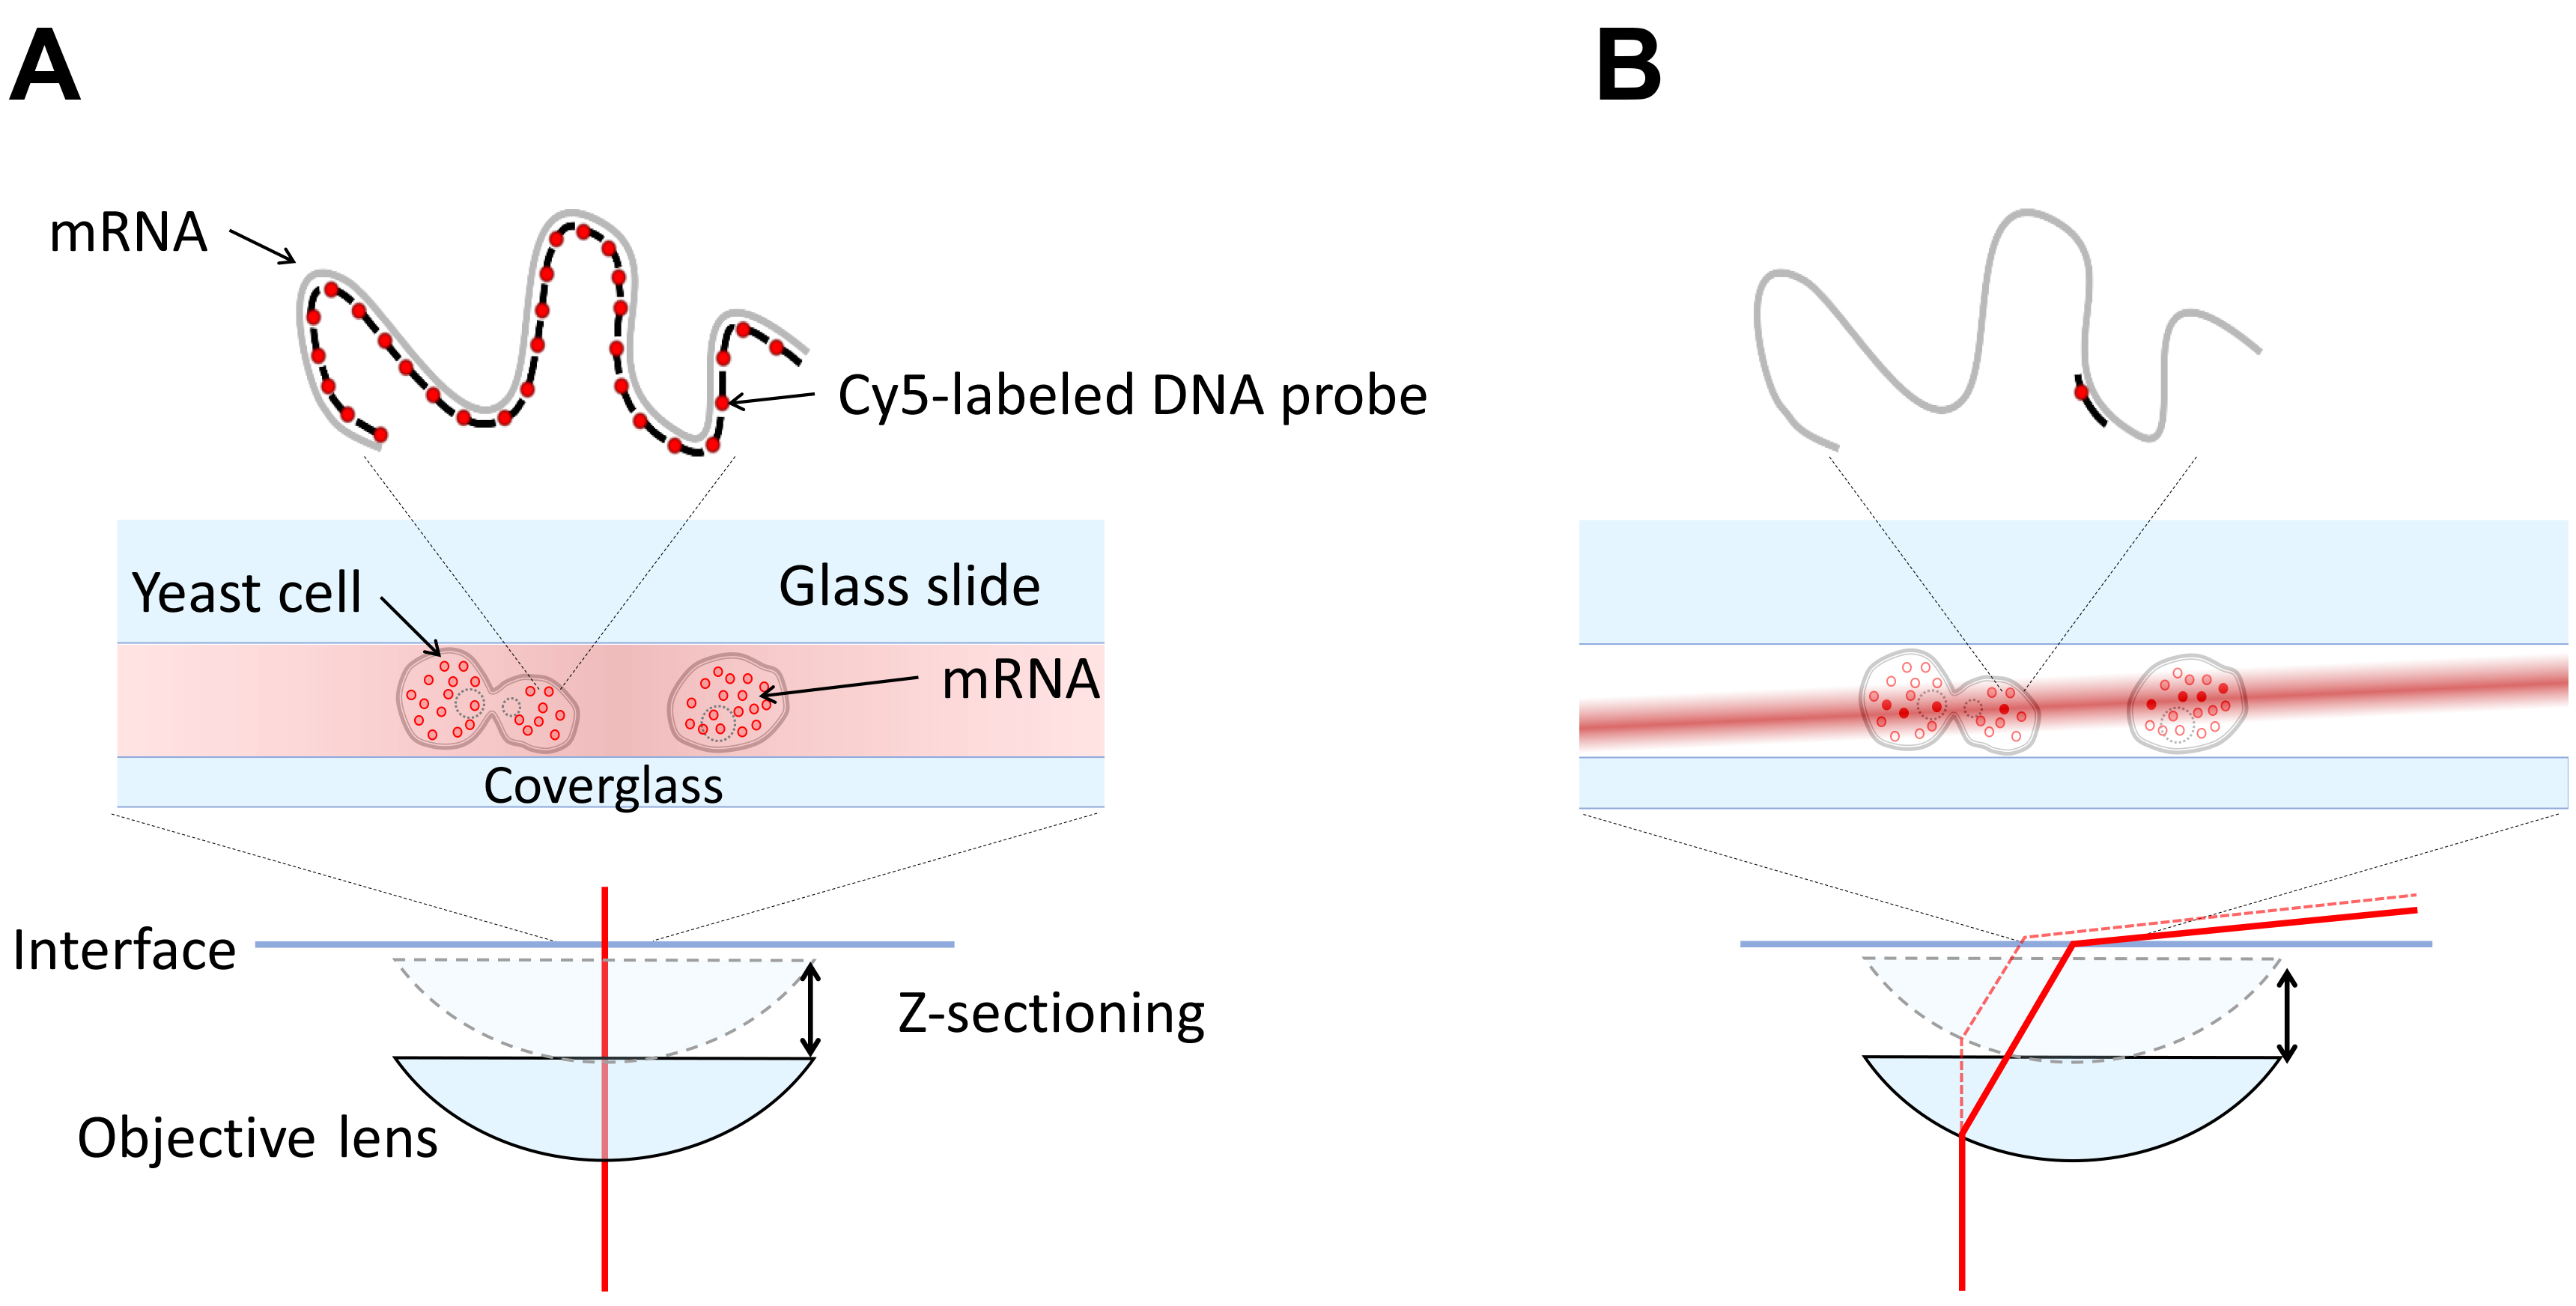
Figure 1. Comparing Epi and HILO illumination. A. An epi-fluorescence microscope has the illumination incident (red line) on the sample through the objective and the entire volume of the sample is illuminated. This leads to poor signal to noise for single fluorophores since the widefield microscope collects out of focus light. B. An inclined illumination geometry has the illumination (red line) displaced radially in the back focal plane of the objective so that the light becomes a thin laminated sheet in the sample volume (Tokunaga et al., 2008). This enables z-sectioning and increases signal to noise significantly.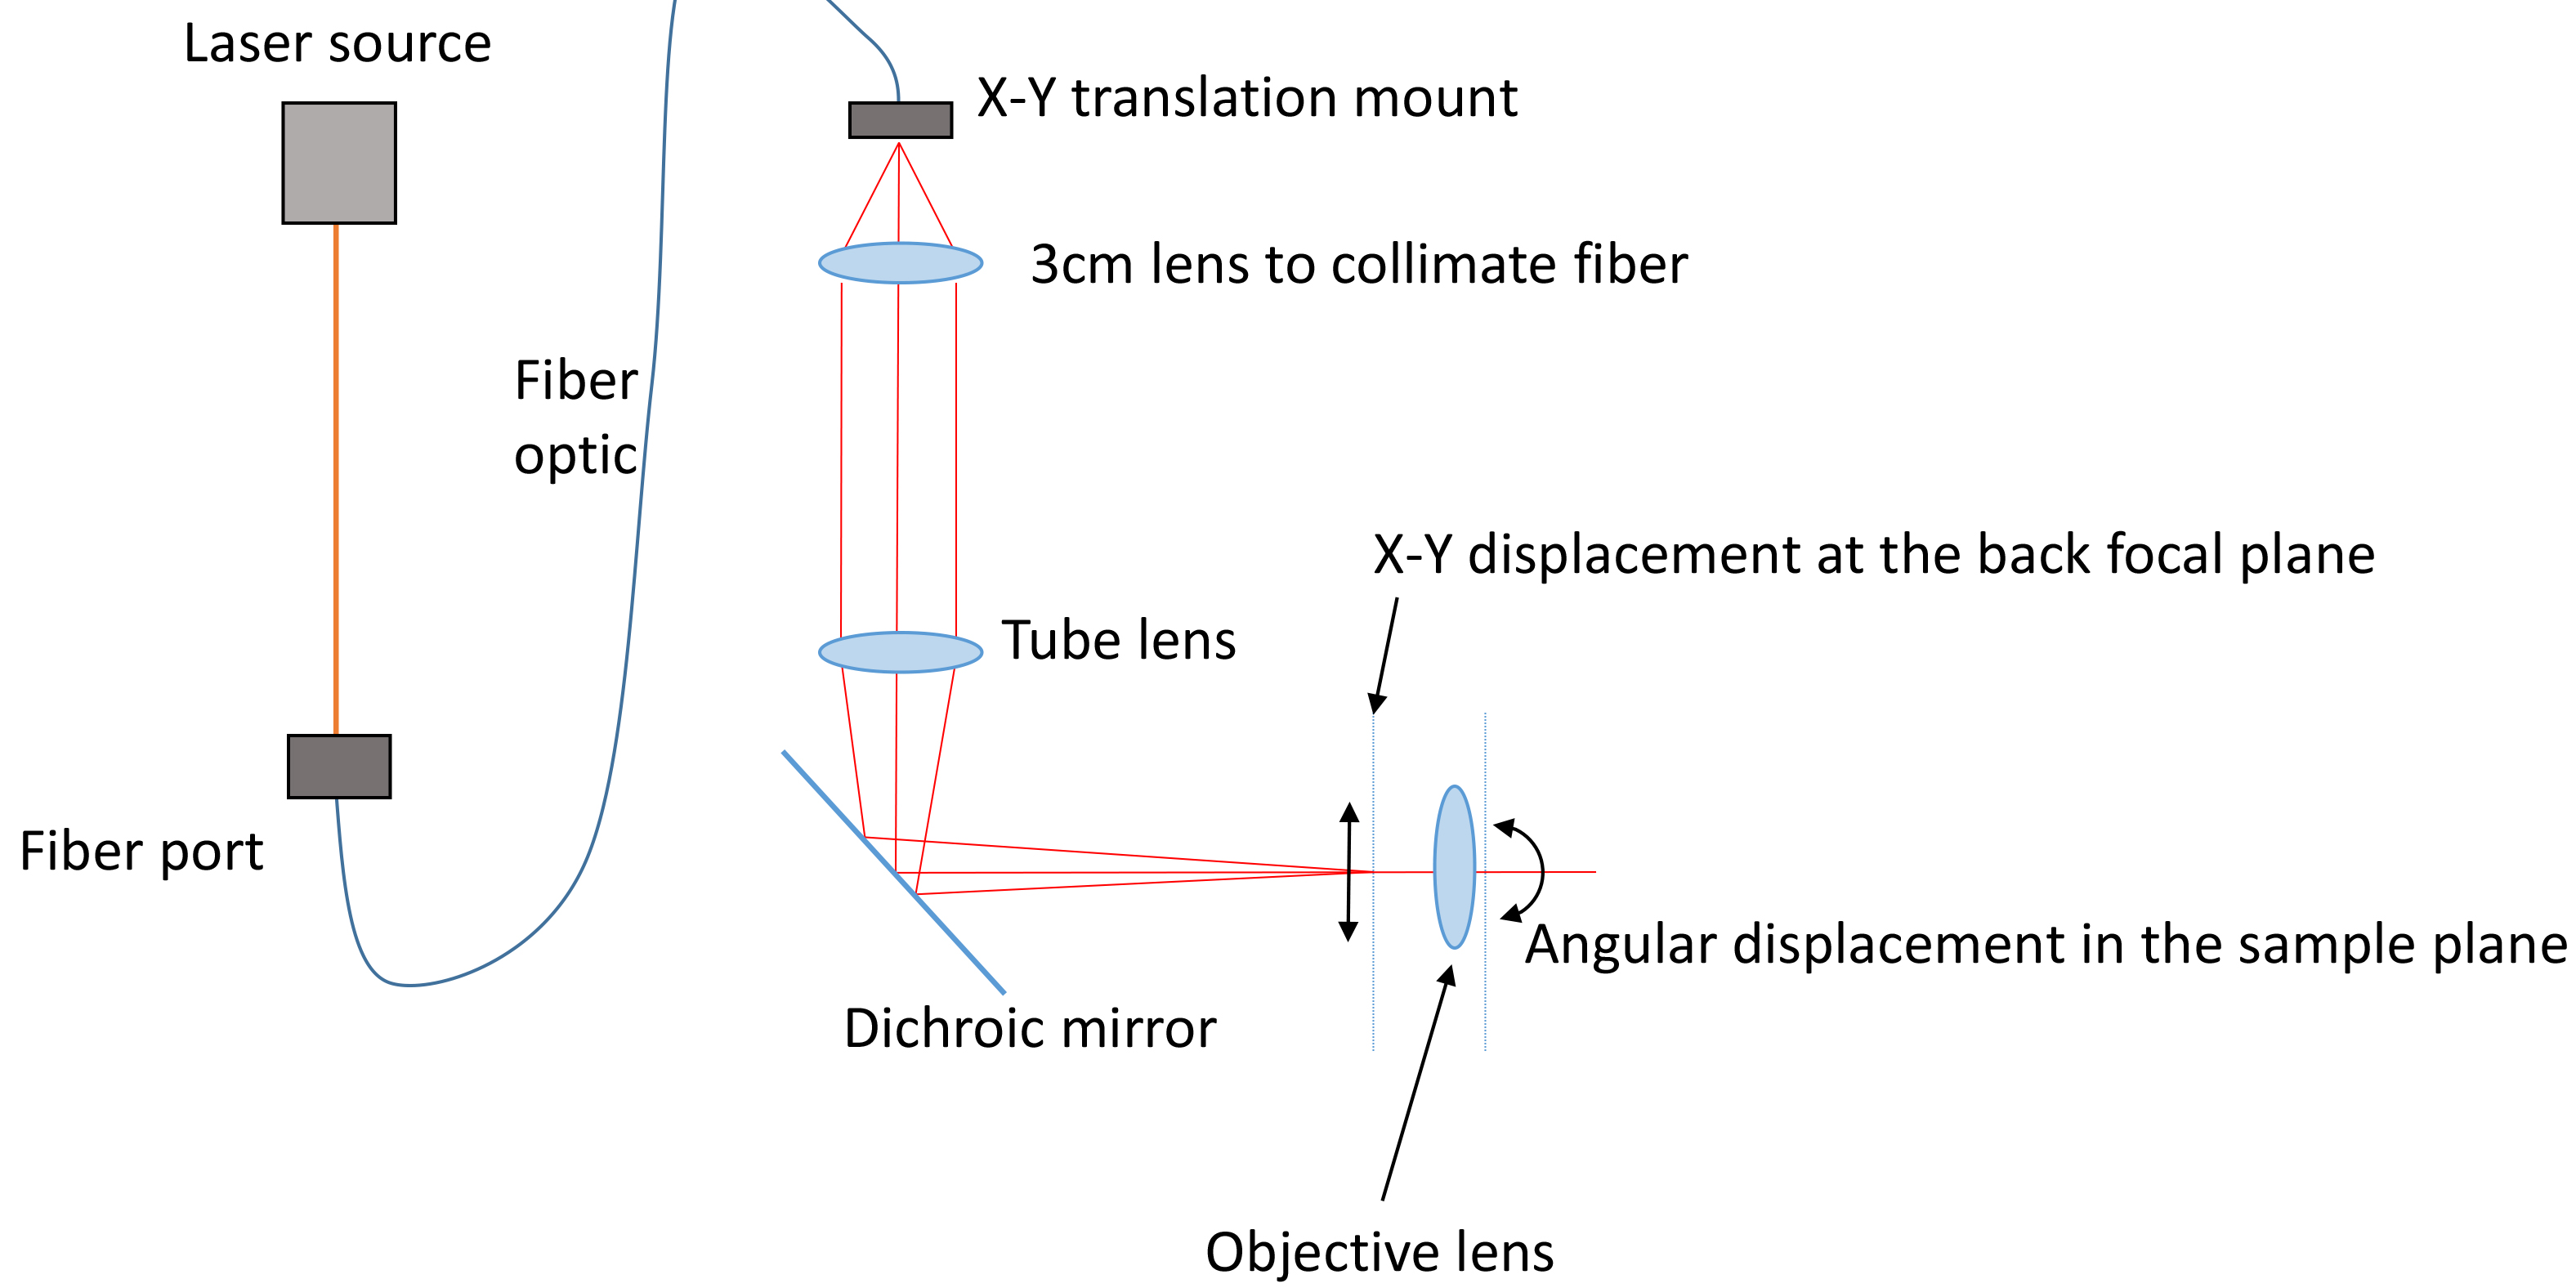
Figure 2. Schematic of the illumination path. One or more lasers are coupled into a fiber optic cable using a fiberport. This fiber is fitted onto an X-Y translation mount and collimated by a short lens (focal length chosen by the field of view). The tube lens focuses the illumination on the back focal plane. When the X-Y position is adjusted away from the center of the back focal plane the beam becomes inclined through the sample volume. - Sample preparation
Day 1
At the end of the day, inoculate yeast cells into 50 ml of liquid media in a culture flask from cells actively growing on a plate.
Day 2–Cell fixation and permeabilization- Measure Cell OD using a spectrophotometer at OD600 by placing 1 ml of cell culture in a cuvet.
- Once cell OD600 has reached 0.6, decant cells into a 50 ml Falcon tube and pelleted by centrifuging at 671 x g for 5 min and aspirated.
- Resuspend the pellet in 10 ml of ice cold (4 °C) methanol for 10 min for fixation.
- Cells are pelleted and resuspended in ice cold Buffer B twice and aspirated.
- Resuspend the cells in 1 ml of Spheroplasting buffer and transfer to a 1.75 ml microcentrifuge tube and add 2 µl of 5 units/µl of zymolyase and gently pipette to mix.
- Incubate the cells for 30 min or until the OD600 of 100 µl of cells added to 900 µl of deionized water shows a reduction of 30% from the initial OD after 1 min, which demonstrates cell lysis.
- Pellet the cells and aspirate. Centrifuge at no more than 268 x g since they are fragile once they are spheroplasts.
- Wash the cells two more times in ice cold Buffer B and aspirate (wash means spin down to a pellet, aspirate liquid and resuspend.)
- Resuspend the cells in 1 ml of 70% ethanol and keep at 4 °C for a minimum of 1 h to overnight.
Day 2 cont./Day 3–hybridization- Pellet cells at 268 x g and wash twice each with 1 ml Wash Buffer and aspirate.
Note: Wash buffer should be prepared fresh and formamide should be warmed to room temperature before opening. - Dilute the probes to 1 µM in 10 mM Tris-HCl, pH 8.
- Prepare a mixture of hybridization buffer and probes based on the working concentration determined by titration (see Notes).
- Resuspend cells to a final volume of 100 µl in the probe-hybridization buffer mixture by gentle pipetting.
- Then wrap samples with aluminum foil and place in the incubator at 30 °C overnight.
Day 3/Day4–Slide Preparation- Prepare Imaging Buffer immediately before use.
- Wipe the slides with ethanol; or (optional) clean slides and coverslips in a plasma cleaner for 10 min.
Note: The slide should be clean of dust and other particles by wiping with ethanol. Any air bubbles will severely impact the performance of the Imaging Buffer. - Mix 2.5 µl of Imaging Buffer with 2.5 µl of cells and place on the coverslip.
- Place the coverslip on a slide and seal with epoxy along the edges.
Note: Slides should be kept in a dark place while not on the microscope. Several slides can be prepared simultaneously. Once sealed, the performance of the imaging buffer will not degrade for several hours.
- Measure Cell OD using a spectrophotometer at OD600 by placing 1 ml of cell culture in a cuvet.
- Data acquisition
Using a microscope as described above, hardware control and the acquisition parameters can be set in the Micromanager software (Edelstein et al., 2014). Z-stack images can be acquired using the multi-dimensional tool in Micromanager for each channel of interest (e.g., DIC, Cy5, etc.).- Acquire images at full region of interest (512 x 512) on an EMCCD (iXonEM +, Andor) at 100 msec exposure times. The pixel size and z-step are chosen to be less than or equal to the Nyquist sampling limit for the shortest wavelength (see Introduction to Fourier Optics 3rd edition, Goodman.).
- The Nyquist limit for a widefield microscope is shown by the following equations where the wavelength λemission used is the peak emission of the fluorophore chosen, the angle θ is the half-aperture angle, and n is the index of refraction of the immersion oil.
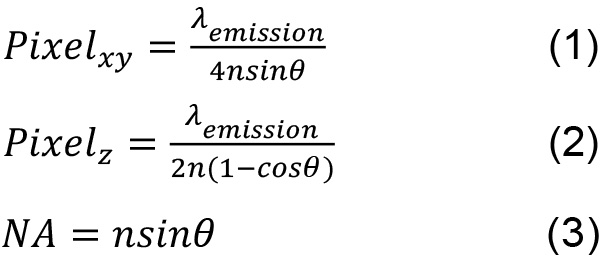
These values allow the maximum amount of spatial information to be recorded. Sampling above this limit is acceptable although the resolution between two objects will not be improved. Undersampling will lead to the inability to distinguish between two close fluorophores because the information in one pixel is not coupled to the information in its neighboring pixels. - Set the laser to output 25 mW at the sample plane. For each chamber, the thickness is approximately 2 µm and an appropriate number of z-slices are acquired. An example of the contrast between a negative control and a low copy number strain is shown in Figure 3.
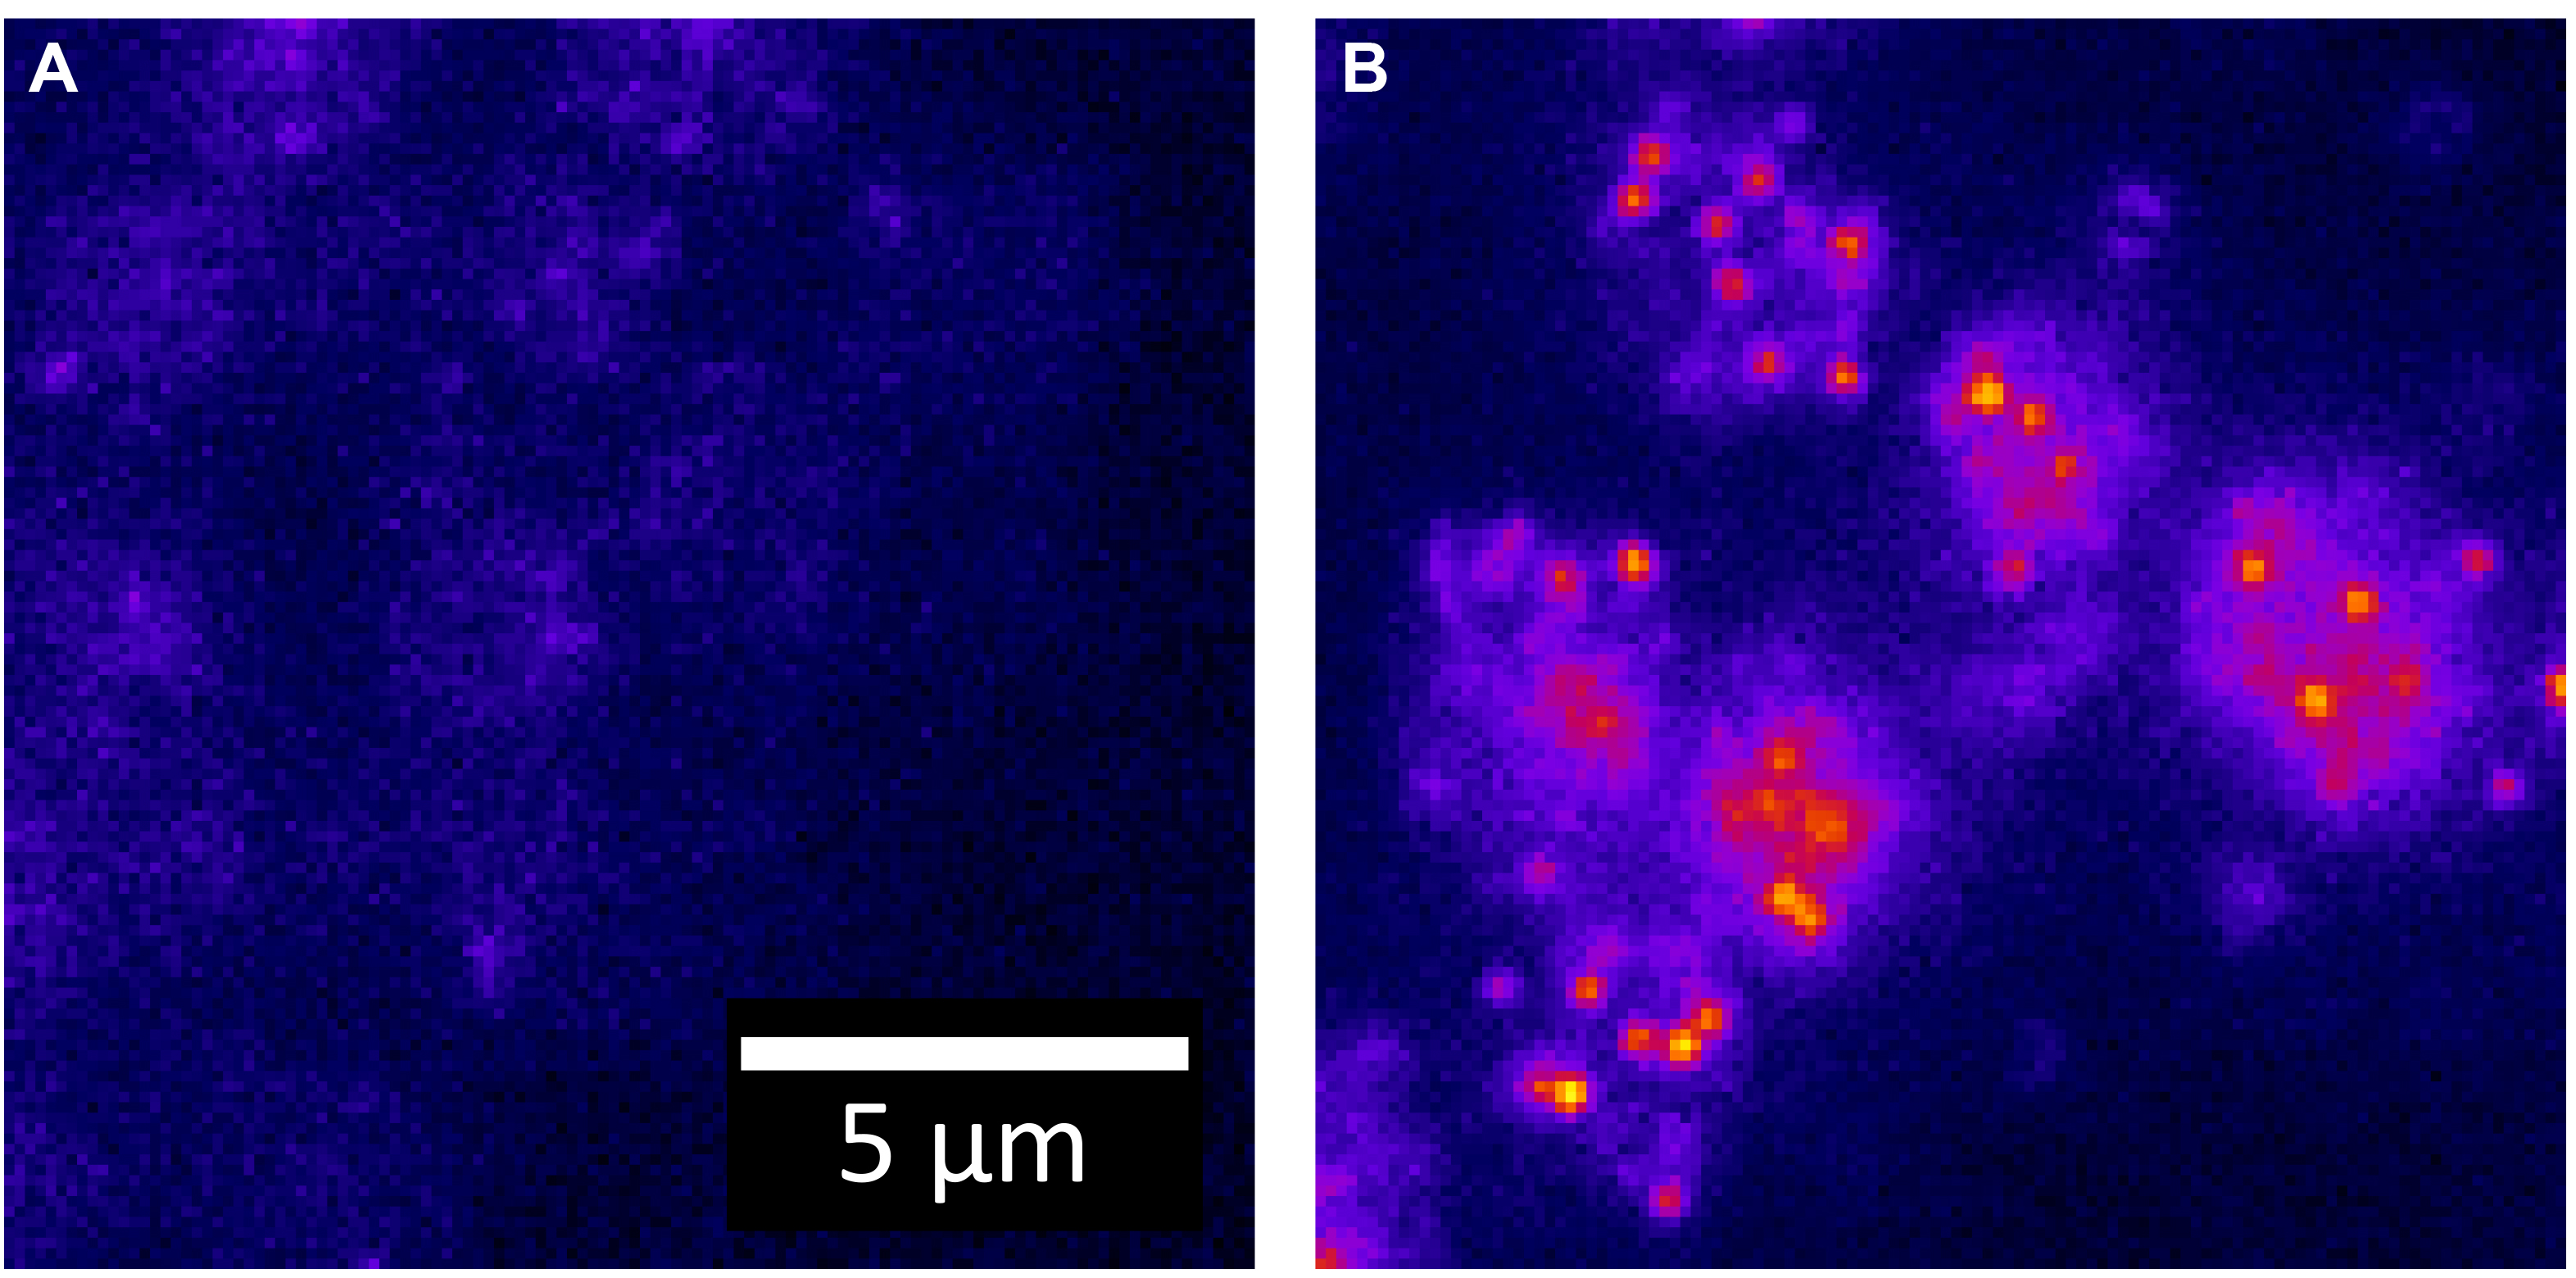
Figure 3. Contrast between strains. A. One z-slice of a negative control for yEvenus mRNA (e.g., wildtype) is shown. All intensity is due to auto-fluorescence. The yEvenus probes are 26nt in length and labeled internally (sequence in Wadsworth, et al., 2017). B. One z-slice of a strain expressing a low copy number (< 20) of yEvenus mRNA transcripts per cell is shown. mRNA transcripts are targeted with a single Cy5 labeled DNA oligo probe.
- Acquire images at full region of interest (512 x 512) on an EMCCD (iXonEM +, Andor) at 100 msec exposure times. The pixel size and z-step are chosen to be less than or equal to the Nyquist sampling limit for the shortest wavelength (see Introduction to Fourier Optics 3rd edition, Goodman.).
Data analysis
The Matlab Image Processing Toolbox was used to analyze the three-dimensional images. In cases where the researcher is unfamiliar with coding, we recommend FISH-quant for its rigor and user-friendly GUI. For systems with very non- uniform illumination, Corrected Intensity Distributions using Regularized Energy minimization (CIDRE) (Smith et al., 2015) can be used to flatten the images. Many functions in the Image Processing Toolbox can be accelerated by simply converting them to a gpuArray () in Matlab with a compatible graphics card (e.g., Nvidia Geforce 1080). An outline of the algorithm used to locate cells and spots is as follows:
- Segmentation
- Perform edge detection on the sharpest DIC image using the Sobel filter in Matlab.
- Connect detected edges using 1 x 4 and 4 x 1 structural elements.
- Perform binary morphological erosion and dilation of the image.
- Label the detected regions in the binary image using the bwlabeln () function.
- Perform edge detection on the sharpest DIC image using the Sobel filter in Matlab.
- Spot detection
- Apply a wide Gaussian filter to the image and subtract the result from the raw data as an approximation of background fluorescence.
- Apply a Laplacian of Gaussian (LoG) filter to the result to enhance the spots.
- Inside each region detected by segmentation, find pixels that are local maxima in the LoG result and call those spot candidates.
- Fit each spot candidate with a Gaussian profile and subtract the mean intensity of the annular region around the spot from each pixel included in the spot to get the spot intensity.
- Determine some threshold brightness based on the intensity of single spots detected on the surface of the slide.
- Count the spots detected in each cell by using logical indexing of the segmented cells on an 3D array where the detected centers are marked as 1 and all other locations are 0.
- Apply a wide Gaussian filter to the image and subtract the result from the raw data as an approximation of background fluorescence.
Notes
- Probe design notes
We have used single probes of lengths between 18-30 nt with both internal labeling and end labeling. When compared to a standard smFISH probe set (Biosearch Technologies), we found that the probes hybridized between 50-70% of the true transcript count (Wadsworth et al., 2017). This seems to have more dependence on melting temperature than length. Further, we found that the modified Cy5 analog Quasar 670 was much dimmer (it has a smaller molar extinction coefficient) so that Cy5 outperformed substantially. Finally, when using single probes that can be added independently of one another, we found that the true transcript count was achieved with 4-5 probes (Wadsworth et al., 2017). - Microscope
It is not necessary to have a custom-built microscope. The minimum criteria for a microscope to detect single fluorophores is a ~1.4 NA 100X Objective, an EMCCD, a coherent light source with at least 5 mW of power at the sample plane, and variable angle illumination (TIR/HILO.) Any microscope that can be adjusted from epi-fluorescence to total internal reflection geometry is adequate to accomplish HILO. We do not recommend TIR geometry as the yeast samples are general 2-3 µm thick and this is well outside the range of TIR. TIR will only illuminate probes non-specifically bound to the surface and not in the cytoplasm.
We do not recommend a confocal microscope because the signal is in the 1-2 photon limit that is beyond the capability of most turnkey confocal setups. Also, we do not recommend sCMOS or CCD cameras because of the 1-2 photon regime. We have tested several in-house and had poor results.
With the Andor EMCCD camera (EM stands for electron multiplying), we can observe single fluorophores in either a HILO or total internal reflection geometry with nominal gain that is between 50-500 depending on the fluorophore. With our illumination setup, we find no reason to expose for longer than 100 msec although exposures of 1 sec to 2 sec are common in literature. - Sample Preparation: Day 2 notes
- Spheroplasting is the most critical step in order to get the probes inside the cell. If the population of cells is poorly converted to spheroplasts, there will be a lot of variability in the FISH spots counted. Spheroplasting can also be observed by DIC imaging. The cells should appear more round and there should be cell wall debris in the sample.
- While overnight treatment with ethanol is acceptable, we find the most consistent results when cells are hybridized after 1 h of ethanol treatment.
- Spheroplasting is the most critical step in order to get the probes inside the cell. If the population of cells is poorly converted to spheroplasts, there will be a lot of variability in the FISH spots counted. Spheroplasting can also be observed by DIC imaging. The cells should appear more round and there should be cell wall debris in the sample.
- Day 2cont./Day 3 – hybridization notes
- When working with a sample in hybridization buffer, a sample volume that is too small will not produce a large enough pellet after hybridization. This is particularly noteworthy when trying to work with initial cell culture volumes of 5 ml to 10 ml. Also, it should be noted that the pellet should be around 10 µl to 20 µl of the hybridization volume. Larger concentrations of cells cause poor efficiency of probe penetration in any dense clusters of cells.
- Create serial dilutions of probes in hybridization buffer from 1 nM to 100 nM or a range where the detected number of FISH spots in the sample plateaus. This concentration is chosen as the working concentration of probes. 65 nM working concentration probes seems to be appropriate for probes of 60 °C RNA-DNA melting temperature in the range of 18-26 nt.
- When imaging, if there are many probes diffusing in solution around your cells, then the cells need further washing to remove unbound probes.
- Commercial anti-fade reagents such as Prolong Gold may work, but have not been tested in our lab for single fluorophore detection.
- When working with a sample in hybridization buffer, a sample volume that is too small will not produce a large enough pellet after hybridization. This is particularly noteworthy when trying to work with initial cell culture volumes of 5 ml to 10 ml. Also, it should be noted that the pellet should be around 10 µl to 20 µl of the hybridization volume. Larger concentrations of cells cause poor efficiency of probe penetration in any dense clusters of cells.
- Day 3/Day4 – Slide preparation notes
The imaging buffer will not perform well if not used immediately. When imaging, if probes rapidly photobleach as the slide is explored by moving from one field of view to the next with live viewing, which means your imaging buffer is not working due to expiring or due to tiny bubbles in the chamber (they can be seen by eye).
We avoid using nail polish although it is common, because it contains solvents that will wick into the sample and cause photobleaching or auto-fluorescence. We find epoxy does not have that effect. - Data acquisition notes
- We use a 1.4 NA 100x objective with additional magnification to oversample based on the Nyquist criterion. The camera is set to Frame Transfer mode. The hardware binning is set to 1 x 1. The gain is set to a level that confines the intensity to the dynamic range of the camera on the brightest sample (200 for Cy5).
- When trouble shooting poor signal to noise, there are several potential sources of auto-fluorescence; methanol, ethanol, and formamide. We found that lower grade methanol and ethanol are fluorescent in the visible spectrum and use ≤ 99.5 ACS grade reagents. Also, if the auto-fluorescence appears during the hybridization procedure, it is likely because of formamide being contaminated. Formamide is very delicate and will convert to formic acid when mixed with water from condensation if handled poorly. This will lead to inconsistent results.
- We use a 1.4 NA 100x objective with additional magnification to oversample based on the Nyquist criterion. The camera is set to Frame Transfer mode. The hardware binning is set to 1 x 1. The gain is set to a level that confines the intensity to the dynamic range of the camera on the brightest sample (200 for Cy5).
Recipes
Q: The concentration at the end of reagent.
- SD Complete (1 L), pH 5.8
Carbon, Nitrogen, and Salts (CNS) 26.7 g
Dextrose 20 g
Ammonium sulfate 5 g
Potassium phosphate monobasic 1 g
Magnesium sulfate 0.5 g
Sodium chloride 0.1 g
Calcium chloride 0.1 g- Vitamins and trace elements (Vitamix) 2,840 µl
Biotin (5 mg/50 ml) 20 µl Calcium pantothenate (1 g/50 ml) 20 µl Folic acid (5 mg/50 ml) 20 µl Inositol (0.5 g/50 ml) 200 µl Niacin (0.1 g/50 ml) 200 µl P-aminobenzoic acid (50 mg/50 ml) 200 µl Pyridoxine HCl (1 g/50 ml) 20 µl Riboflavin (5 mg/50 ml) 2 ml Thiamine HCl (1 g/50 ml) 20 µl Boric acid (1.25 g/50 ml) 20 µl Copper sulfate (0.1 g/50 ml) 20 µl Potassium iodide (0.25 g/50 ml) 20 µl Ferric chloride (0.5 g/50 ml) 20 µl Manganese sulfate (1 g/50 ml) 20 µl Sodium molybdate (0.5 g/50 ml) 20 µl Zinc sulfate (1 g/50 ml) 20 µl - Complete Supplement Mixture (CSM) 790 mg
Adenine 10 mg
Arginine 50 mg
Aspartic acid 80 mg
Histidine 20 mg
Isoleucine 50 mg
Leucine 100 mg
Lysine 50 mg
Methionine 20 mg
Phenylalanine 50 mg
Threonine 100 mg
Tryptophan 50 mg
Tyrosine 50 mg
Uracil 20 mg
Valine 140 mg - Bacto-agar 20 g optional
- Vitamins and trace elements (Vitamix) 2,840 µl
- Buffer B (1 L)
Sorbitol (218 g)
Potassium phosphate (dibasic) (17.4 g)
RNase free water - Spheroplasting Buffer (10.1 ml)
Buffer B 10 ml
Vanadyl ribonucleoside complex (200 mM) 100 µl - Hybridization Buffer (10 ml)
Dextran sulfate 1 g
Escherichia coli tRNA 10 mg
Vanadyl ribonucleoside complex (200 mM) 100 µl
BSA 40 µl (5 mg/ml) (RNase free)
20x SSC 1 ml (RNase free)
RNase free water - Wash Buffer (50 ml)
Formamide 5 ml (RNase free)
20x SSC 5 ml (RNase free)
RNase free water - Imaging Buffer (100 µl)
Trolox (1 mM) 70 µl 20x SSC 10 µl Tris-HCl (200 mM, pH 8) 5 µl Protocatechuic acid (PCA) (25 mM) 10 µl Protocatechuate-3,4-dioxygenase (PCD)(200 nM) 5 µl
Acknowledgments
This protocol has been adapted from Raj et al. (2010). This work was supported by Georgia Institute of Technology startup funds, GAANN Molecular Biophysics and Biotechnology Fellowship, and the National Institutes of Health grant (R01-GM112882).
Competing interests
The authors declare no conflicts of interests or competing interests.
References
- Edelstein, A. D., Tsuchida, M. A., Amodaj, N., Pinkard, H., Vale, R. D. and Stuurman, N. (2014). Advanced methods of microscope control using muManager software. J Biol Methods 1(2).
- Johnson, M., Zaretskaya, I., Raytselis, Y., Merezhuk, Y., McGinnis, S. and Madden, T. L. (2008). NCBI BLAST: a better web interface. Nucleic Acids Res 36(Web Server issue): W5-9.
- Raj, A. and Tyagi, S. (2010). Detection of individual endogenous RNA transcripts in situ using multiple singly labeled probes. Methods Enzymol 472: 365-386.
- Smith, K., Li, Y., Piccinini, F., Csucs, G., Balazs, C., Bevilacqua, A. and Horvath, P. (2015). CIDRE: an illumination-correction method for optical microscopy. Nat Methods 12(5): 404-406.
- Tokunaga, M., Imamoto, N. and Sakata-Sogawa, K. (2008). Highly inclined thin illumination enables clear single-molecule imaging in cells. Nat Methods 5(2): 159-161.
- Wadsworth, G. M., Parikh, R. Y., Choy, J. S. and Kim, H. D. (2017). mRNA detection in budding yeast with single fluorophores. Nucleic Acids Res 45(15): e141.
- Zuker, M. (2003). Mfold web server for nucleic acid folding and hybridization prediction. Nucleic Acids Res 31(13): 3406-3415.
Article Information
Copyright
© 2018 The Authors; exclusive licensee Bio-protocol LLC.
How to cite
Wadsworth, G. M., Parikh, R. Y. and Kim, H. D. (2018). Single-probe RNA FISH in Yeast. Bio-protocol 8(11): e2868. DOI: 10.21769/BioProtoc.2868.
Category
Molecular Biology > RNA > RNA detection
Microbiology > Microbial genetics > Gene expression
Do you have any questions about this protocol?
Post your question to gather feedback from the community. We will also invite the authors of this article to respond.