- Protocols

- Articles and Issues
- For Authors
- About
- Become a Reviewer

Dual-probe RNA FRET-FISH in Yeast

Published: Vol 8, Iss 11, Jun 5, 2018 DOI: 10.21769/BioProtoc.2867 Views: 8732
Reviewed by: Gal HaimovichManuel D GaheteImre Gáspár
Original research article
The authors used this protocol in:

Sep 2017
Advertisement


Protocol Collections
Comprehensive collections of detailed, peer-reviewed protocols focusing on specific topics


Abstract
mRNA Fluorescence In Situ Hybridization (FISH) is a technique commonly used to profile the distribution of transcripts in cells. When combined with the common single molecule technique Fluorescence Resonance Energy Transfer (FRET), FISH can also be used to profile the co-expression of nearby sequences in the transcript to measure processes such as alternate initiation or splicing variation of the transcript. Unlike in a conventional FISH method using multiple probes to target a single transcript, FRET is limited to the use of two probes labeled with matched dyes and requires the use of sensitized emission. Any widefield microscope capable of sensitive single molecule detection of Cy3 and Cy5 should be able to measure FRET in yeast cells. Alternatively, a FRET-FISH method can be used to unambiguously ascertain identity of the transcript without the use of a guide probe set used in other FISH techniques.
Keywords: RNA FISHBackground
Quantification of the transcript distribution of single cells is typically accomplished by targeting mRNA with multiple probes to achieve a bright signal that can be distinguished from non-specifically bound probes (Raj and Tyagi, 2010). However, in some instances, there are features on the transcript such as splicing variants or alternative initiation sites that would be indistinguishable to a conventional FISH probe set. These isoform sequences can have short 50 nt uniquely identifying sequences. Using two probes, one can target either side of the junction with a FRET pair and quantify up to three classifications of mRNA isoform simultaneously, e.g., the isoform with both probes (FRET), the isoform with probe 1 only, and the isoform with probe 2 only. The reliance on a single fluorophore or pair of fluorophores requires sensitive detection through an EMCCD. Also, the detection efficiency of a probe for a sequence without other isoforms can be estimated using a FRET pair (Wadsworth et al., 2017).
Materials and Reagents
- Pyrex bottle (Corning, PYREXTM, catalog number: 13951L )
- Falcon tube 50 ml (VWR, catalog number: 89039-658 )
- Falcon tube 15 ml (VWR, catalog number: 89039-666 )
- Nitrile gloves (VWR, catalog number: 40101-348 )
- Light-duty tissue wipers (VWR, catalog number: 82003-820 )
- Lens cleaning tissues (Olympus, catalog number: C-0100 )
- Aluminum foil
- Pipette tips (VWR, catalog numbers: 89079-466 , 89079-460 , and 89079-472 )
- Plastic cuvettes (BrandTech Scientific, catalog number: 759075D )
- Culture flask (Corning, PYREXTM, catalog number: 4442-250 )
- Microcentrifuge tube (Corning, Axygen®, catalog number: MCT-175-C )
- Microcentrifuge tube rack (Thermo Fisher Scientific, catalog number: 5973-0015 )
- Petri dish (VWR, catalog number: 25384-088 )
- #1.5, 18 mm square coverslip (Fisher Scientific, catalog number: 12-518-108B )
- Glass slide (Fisher Scientific, catalog number: 12-544-1 )
- Saccharomyces cerevisiae strains (collaborators or ATCC)
- Low Auto Fluorescence Immersion Oil (Thorlabs, catalog number: MOIL-30 )
- Ethanol (VWR, catalog number: BDH1156 )
- Methanol ≥ 99% ACS Spectrophotometric grade (Sigma-Aldrich, catalog number: 154903-2L )
- RNase free water (Quality Biological, catalog number: 351-068-131 )
- Flourophore labeled DNA oligo probes, HPLC purified (Integrated DNA technologies or Eurofins Scientific)
- High Strength 5-min Epoxy (Amazon, B001QFGTHG)
- Zymolyase-20T at 21 000 units/g (Zymolyase-20T, Seikagaku Business Corporation)
- SD Complete (see Recipes)
- Carbon, Nitrogen, and Salts (CNS)
Dextrose (Sigma-Aldrich, catalog number: G8270-25KG )
Ammonium sulfate (Sigma-Aldrich, catalog number: A4418-5KG )
Potassium phosphate monobasic (VWR, catalog number: MK710002 )
Magnesium sulfate (Sigma-Aldrich, catalog number: M2773-500G )
Sodium chloride (Fisher Scientific, catalog number: S671-500 )
Calcium chloride (Sigma-Aldrich, catalog number: C3306-250G )
Biotin (Sigma-Aldrich, catalog number: B4501-1G )
Calcium pantothenate (Sigma-Aldrich, catalog number: 21210-25G-F ) - Vitamins and trace elements (Vitamix)
Folic acid (Fisher Scientific, catalog number: BP251910 )
Inositol (Sigma-Aldrich, catalog number: 57569-25G )
Niacin (Acros Organics, catalog number: 128291000 )
P-aminobenzoic acid (Sigma-Aldrich, catalog number: A9878-25G )
Pyridoxine HCl (Acros Organics, catalog number: 150770500 )
Riboflavin (Sigma-Aldrich, catalog number: R9504-25G )
Thiamine HCl (Sigma-Aldrich, catalog number: T4625-25G )
Boric acid (Sigma-Aldrich, catalog number: B6768-500G )
Copper sulfate (Sigma-Aldrich, catalog number: C1297-100G )
Potassium iodide (Avantor Performance Materials, catalog number: JT3168-4 )
Ferric chloride (Acros Organics, catalog number: 217091000 )
Manganese sulfate (Sigma-Aldrich, catalog number: M7634-100G )
Sodium molybdate 2 (Sigma-Aldrich, catalog number: 243655-5G )
Zinc sulfate (Sigma-Aldrich, catalog number: Z4750-100G ) - Complete Supplement Mixture (CSM)
Adenine (Sigma-Aldrich, catalog number: A9126-25G )
Arginine (Sigma-Aldrich, catalog number: A5131-100G )
Aspartic acid (Acros Organics, catalog number: 105041000 )
Histidine (Sigma-Aldrich, catalog number: H8000-25G )
Isoleucine (Acros Organics, catalog number: 166170250 )
Leucine (Sigma-Aldrich, catalog number: L8000-100G )
Lysine (Sigma-Aldrich, catalog number: L5626-100G )
Methionine (Sigma-Aldrich, catalog number: M9625-25G )
Phenylalanine (Acros Organics, catalog number: 130311000 )
Threonine (Acros Organics, catalog number: 138930250 )
Tryptophan (Acros Organics, catalog number: 140590250 )
Tyrosine (Acros Organics, catalog number: 140641000 )
Uracil (Acros Organics, catalog number: 157300250 )
Valine (Acros Organics, catalog number: 140811000 ) - Bacto-agar (BD, catalog number: 214030 )
- Carbon, Nitrogen, and Salts (CNS)
- Buffer B (see Recipes)
Sorbitol (Sigma-Aldrich, catalog number: S6021-1KG )
Potassium phosphate (dibasic) (Sigma-Aldrich, catalog number: P3786-500G ) - Spheroplasting Buffer (see Recipes)
Vanadyl ribonucleoside complex (Fisher Scientific, catalog number: 50-812-650 ) - Hybridization Buffer (see Recipes)
Dextran sulfate (Sigma-Aldrich, catalog number: D8906-10G )
Escherichia coli tRNA (Sigma-Aldrich, catalog number: R1753-500UN )
BSA (RNase free) (Fisher Scientific, catalog number: BP671-1 )
20x SSC (RNase free) (Thermo Fisher Scientific, catalog number: AM9763 ) - Wash Buffer (see Recipes)
Formamide (RNase free) (VWR, catalog number: 97061-392 ) - Imaging Buffer (see Recipes)
6-hydroxy-2,5,7,8-tetramethylchroman-2-carboxylic acid (Trolox) (Sigma-Aldrich, catalog number: 238813-1G )
Tris-base (for making 200 mM, pH 8 Tris-HCl) (Fisher Scientific, catalog number: BP152-500 )
Protocatechuic acid (PCA) (Sigma-Aldrich, catalog number: 08992-50MG )
Protocatechuate-3,4-dioxygenase (PCD) (Sigma-Aldrich, catalog number: P8279-25UN )
Equipment
- Pipettors (e.g., VWR, catalog number: 75786-304 )
- Centrifuge (e.g., Thermo Fisher Scientific, model: SorvallTM LegendTM XTR , catalog number: 75004521)
- Spectrophotometer (e.g., Eppendorf, catalog number: 2231000516 )
- Micro-centrifuge (Eppendorf, catalog number: 022620100 )
- Incubator (e.g., Thermo Fisher Scientific, catalog number: 50125590 )
- Autoclave (e.g., YAMATO SCIENTIFIC, catalog number: SM300 )
- TIRF/HILO widefield microscope capable of sensitized emission
- Lenses (e.g., Thorlabs, catalog numbers: ACN127-020-A , LB1157-A)
- Filters and dichroics (e.g., Semrock, catalog numbers: BLP01-635R-25 , FF650-Di01-25x36 , FF560/659-Di01-25x36 , FF01-593/40-25 )
- Adjustable mechanical slit (Thorlabs, catalog number: VA100 )
- Broadband mirrors (Thorlabs, catalog number: BB1-E02 )
- Optical mounts, posts, post holders (Thorlabs)
- Widefield microscope (e.g., Olympus, model: IX81 )
- 60x or 100x high NA objective (e.g., Olympus UPlanSApo 100X/1.4 Oil)
- EMCCD camera (e.g., Andor Technology, model: iXonEM + )
- Fiberport (Thorlabs, catalog number: PAF-X-11-PC-A )
- Single mode fiberoptic cable (Thorlabs, catalog number: P5-460B-PCAPC-1 )
- Laser illumination (e.g., solid state laser: Oxxius, model: LCX-532L-100 ; Coherent, catalog number: 1185055 )
- Slide translation stage (e.g., Ludl Electronic Products, model: BioPoint2 X-Y Stage )
- Lenses (e.g., Thorlabs, catalog numbers: ACN127-020-A , LB1157-A)
Software
- Melting temperature calculator (IDT, http://www.idtdna.com/calc/analyzer)
- Rna folding calculator (Mfold, http://unafold.rna.albany.edu/?q=mfold)
- Sequence specificity check (BLAST, https://blast.ncbi.nlm.nih.gov/Blast.cgi)
- Microscope control (Micromanager, https://micro-manager.org/)
- Spot counting software (Fish-Quant, https://bitbucket.org/muellerflorian/fish_quant)
- Matlab
Procedure
- Probe design
Two DNA oligo probe sequences are chosen based on the target of interest. Designing a FRET pair of probes is much more constrained than designing a single probe.- The probes should target a specific feature of the mRNA. Ideally, for mRNA isoforms, they should flank the junction between a sequence that is unique to one isoform and a sequence that is conserved in both isoforms. The donor should be on the conserved sequence so that both isoforms can be detected using a single excitation. For example, an intron retention isoform could be detected by placing Cy3 on the exon and Cy5 on the intron. However, FRET can also be used to simply exclude false positives and not need a specific feature. In this case, FRET only occurs if the donor and acceptor probes are on the target so that any spot appearing in the donor channel is a non-specific spot. (Note A1)
- The probes should not interfere with the binding of each other. To avoid steric effects, these probes are placed two nucleotides apart from the 3’ end of the first to 5’ end of the second probe.
- The probe should be stable and specific. Overall probe length should be determined by RNA-DNA melting temperature (60 °C and between 20-30 nt). (Note A2)
- The secondary structure of the target RNA should be avoided. Ideally, one of the probes should bind completely or partially in a loop in the determined mRNA structure (mFOLD) (Zuker et al., 2003).
- FRET efficiency should be high. Cy3 and Cy5 should be placed within 5 nm of one another when bound to the target to ensure high FRET. Placing the fluorophores 2 nucleotides in from the adjacent 3’ and 5’ ends of the sequence places the fluorophores ~2 nm apart if there is a 2 nucleotide gap between the ends, e.g., 6 nucleotide total separation.
- The probes should target a specific feature of the mRNA. Ideally, for mRNA isoforms, they should flank the junction between a sequence that is unique to one isoform and a sequence that is conserved in both isoforms. The donor should be on the conserved sequence so that both isoforms can be detected using a single excitation. For example, an intron retention isoform could be detected by placing Cy3 on the exon and Cy5 on the intron. However, FRET can also be used to simply exclude false positives and not need a specific feature. In this case, FRET only occurs if the donor and acceptor probes are on the target so that any spot appearing in the donor channel is a non-specific spot. (Note A1)
- Microscope design
Our microscope is a custom-built microscope configured in highly inclined illumination geometry (HILO). This custom microscope is not necessary for imaging single fluorophore considering any widefield TIR/HILO microscope should be able to be configured for this type of imaging (~1-2 photon limit) with a properly sensitive camera, such as an EMCCD camera. For single fluorophores in a FRET pair, epi-fluorescence will not generate an adequate signal, Figure 1. It is necessary to have a variable angle geometry on the illumination. This is essentially the same geometry as a single probe FISH experiment (Wadsworth et al., 2017) with the added requirement of dual channel simultaneous imaging of the signal from the FRET pair (e.g., Cy3 and Cy5). This can be done by using a dual band dichroic (Semrock), which reflects the 532 nm excitation beam, but transmits the emissions of both Cy3 and Cy5. In the emission pathway, the camera is no longer mounted to the microscope. The emission is relayed from the image plane to a conjugate image plane where the EMCCD is positioned. In between these planes are a pair of dichroic mirrors that split the emissions of Cy3 and Cy5 (Semrock) along with filters matched to those fluorophores (Semrock), see Figure 2. These paths can be mapped onto one another using an affine transformation and alignment tools (e.g., DNA probe designed with half FRET efficiency) that fluoresce in both channels. (Note B)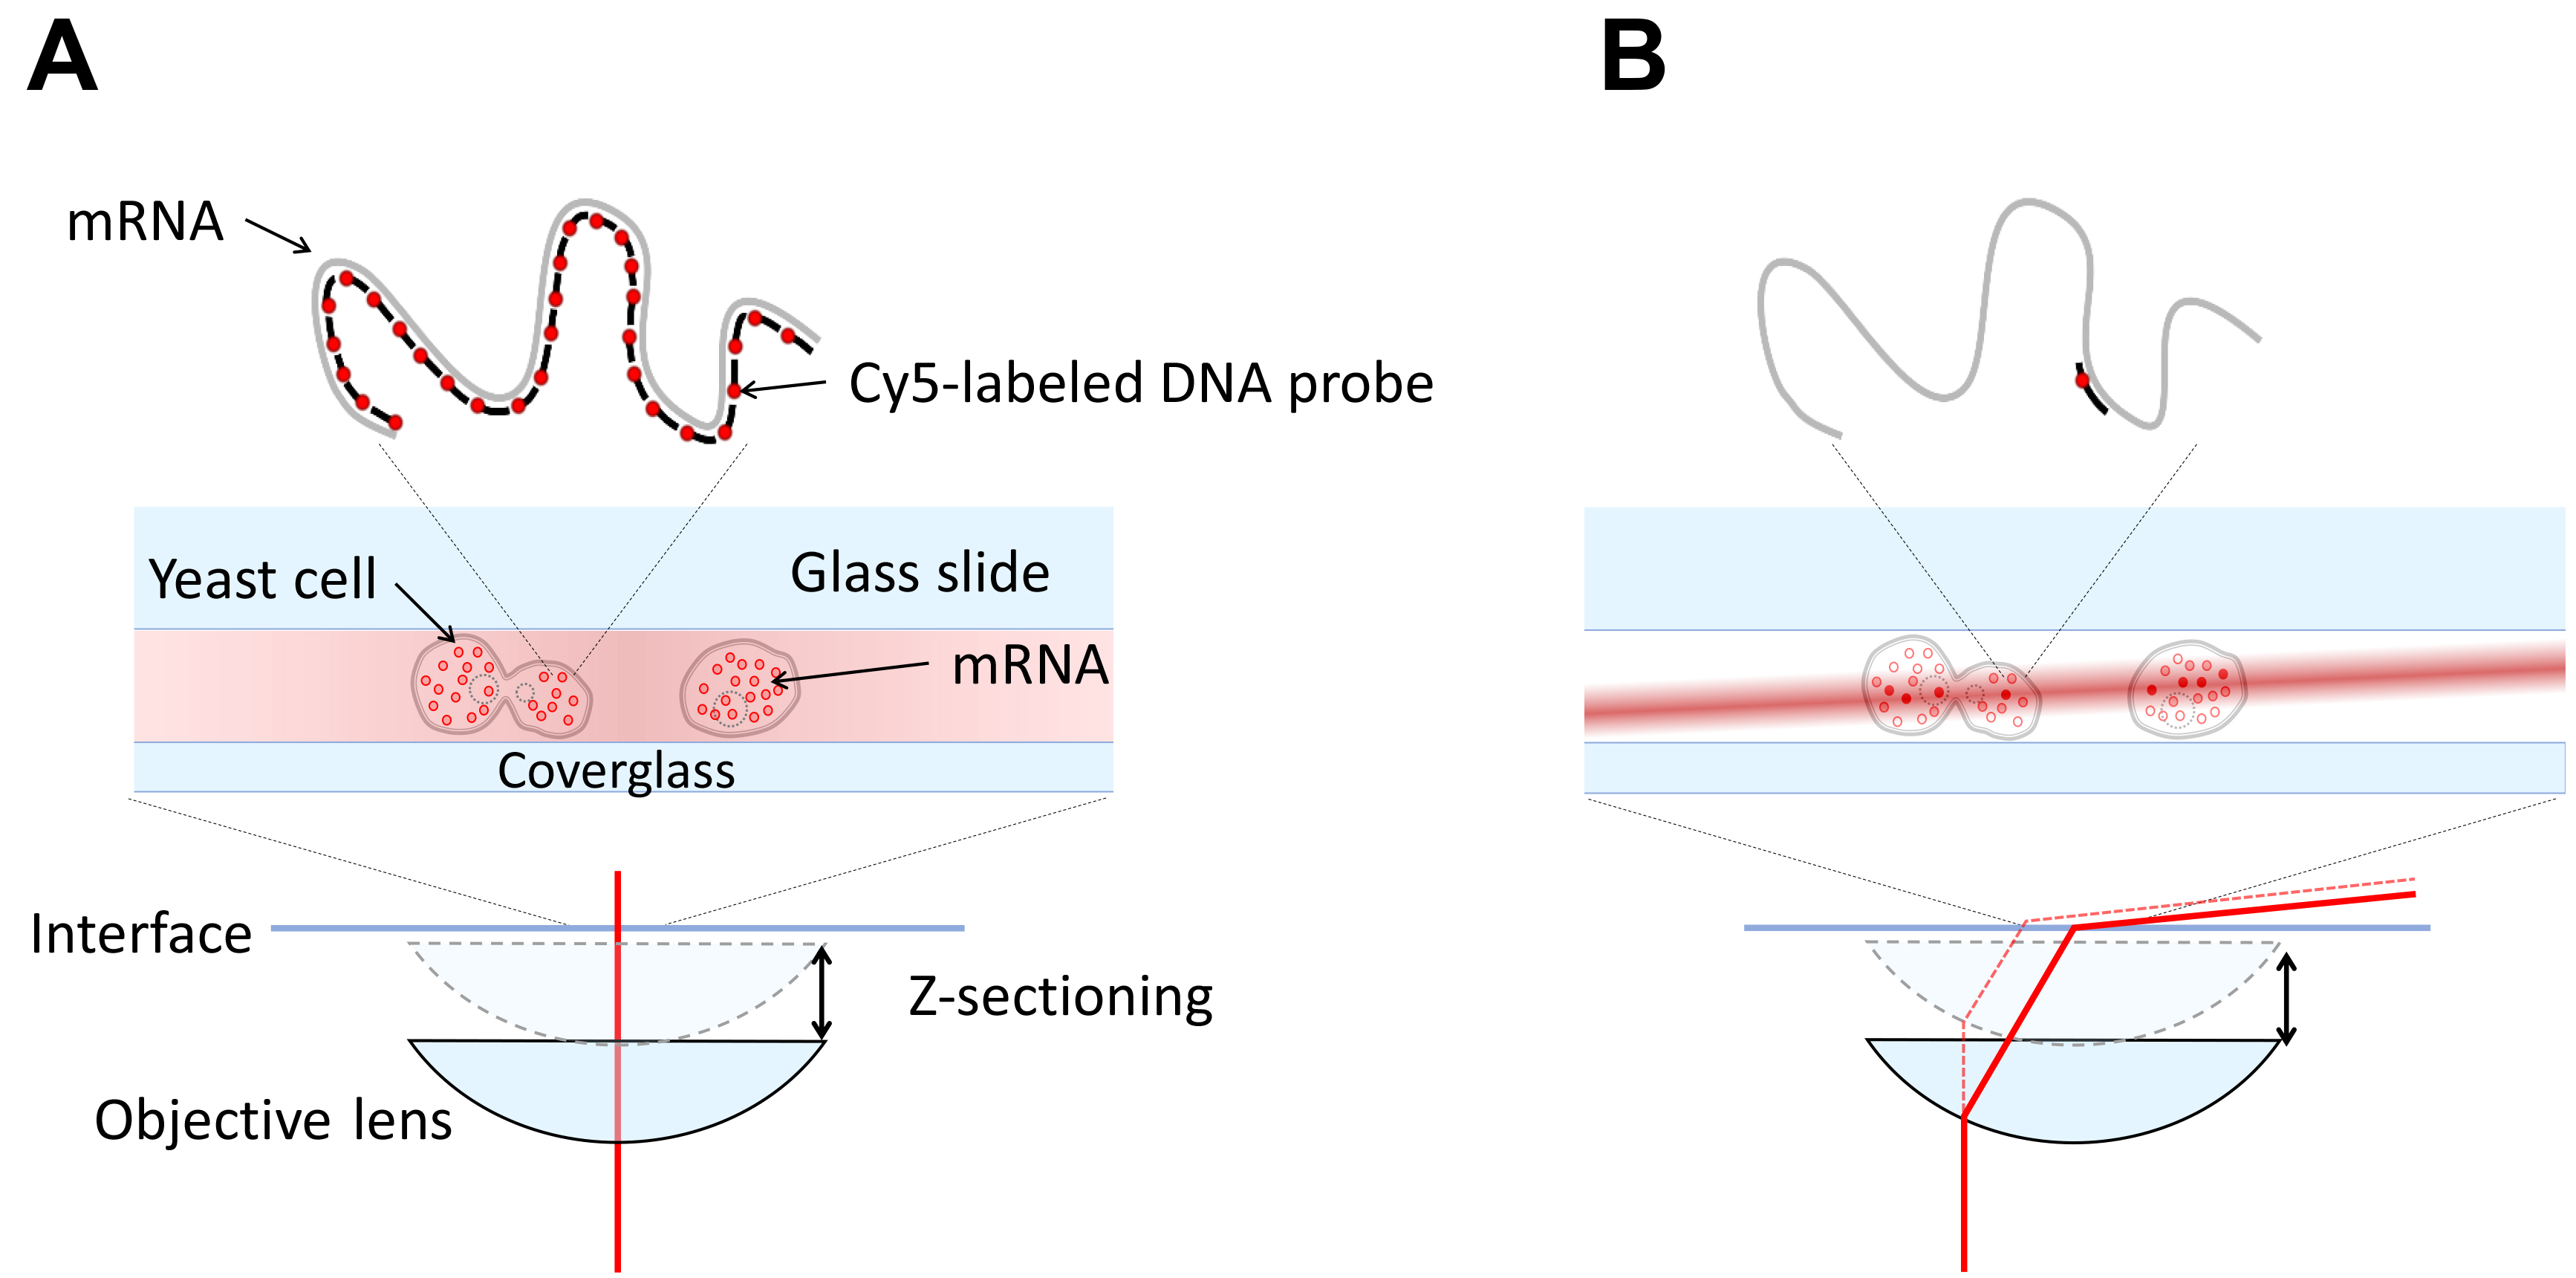
Figure 1. Comparing Epi and inclined illumination. A. An epi-fluorescence microscope has the illumination incident on the sample through the objective and the entire volume of the sample is illuminated. This leads to poor signal to noise for single fluorophores since the widefield microscope collects out of focus light. B. An inclined illumination geometry has the illumination displaced radially in the back focal plane of the objective so that the light becomes a thin laminated sheet in the sample volume (Tokunaga et al., 2008). This enables z-sectioning and increases signal to noise significantly.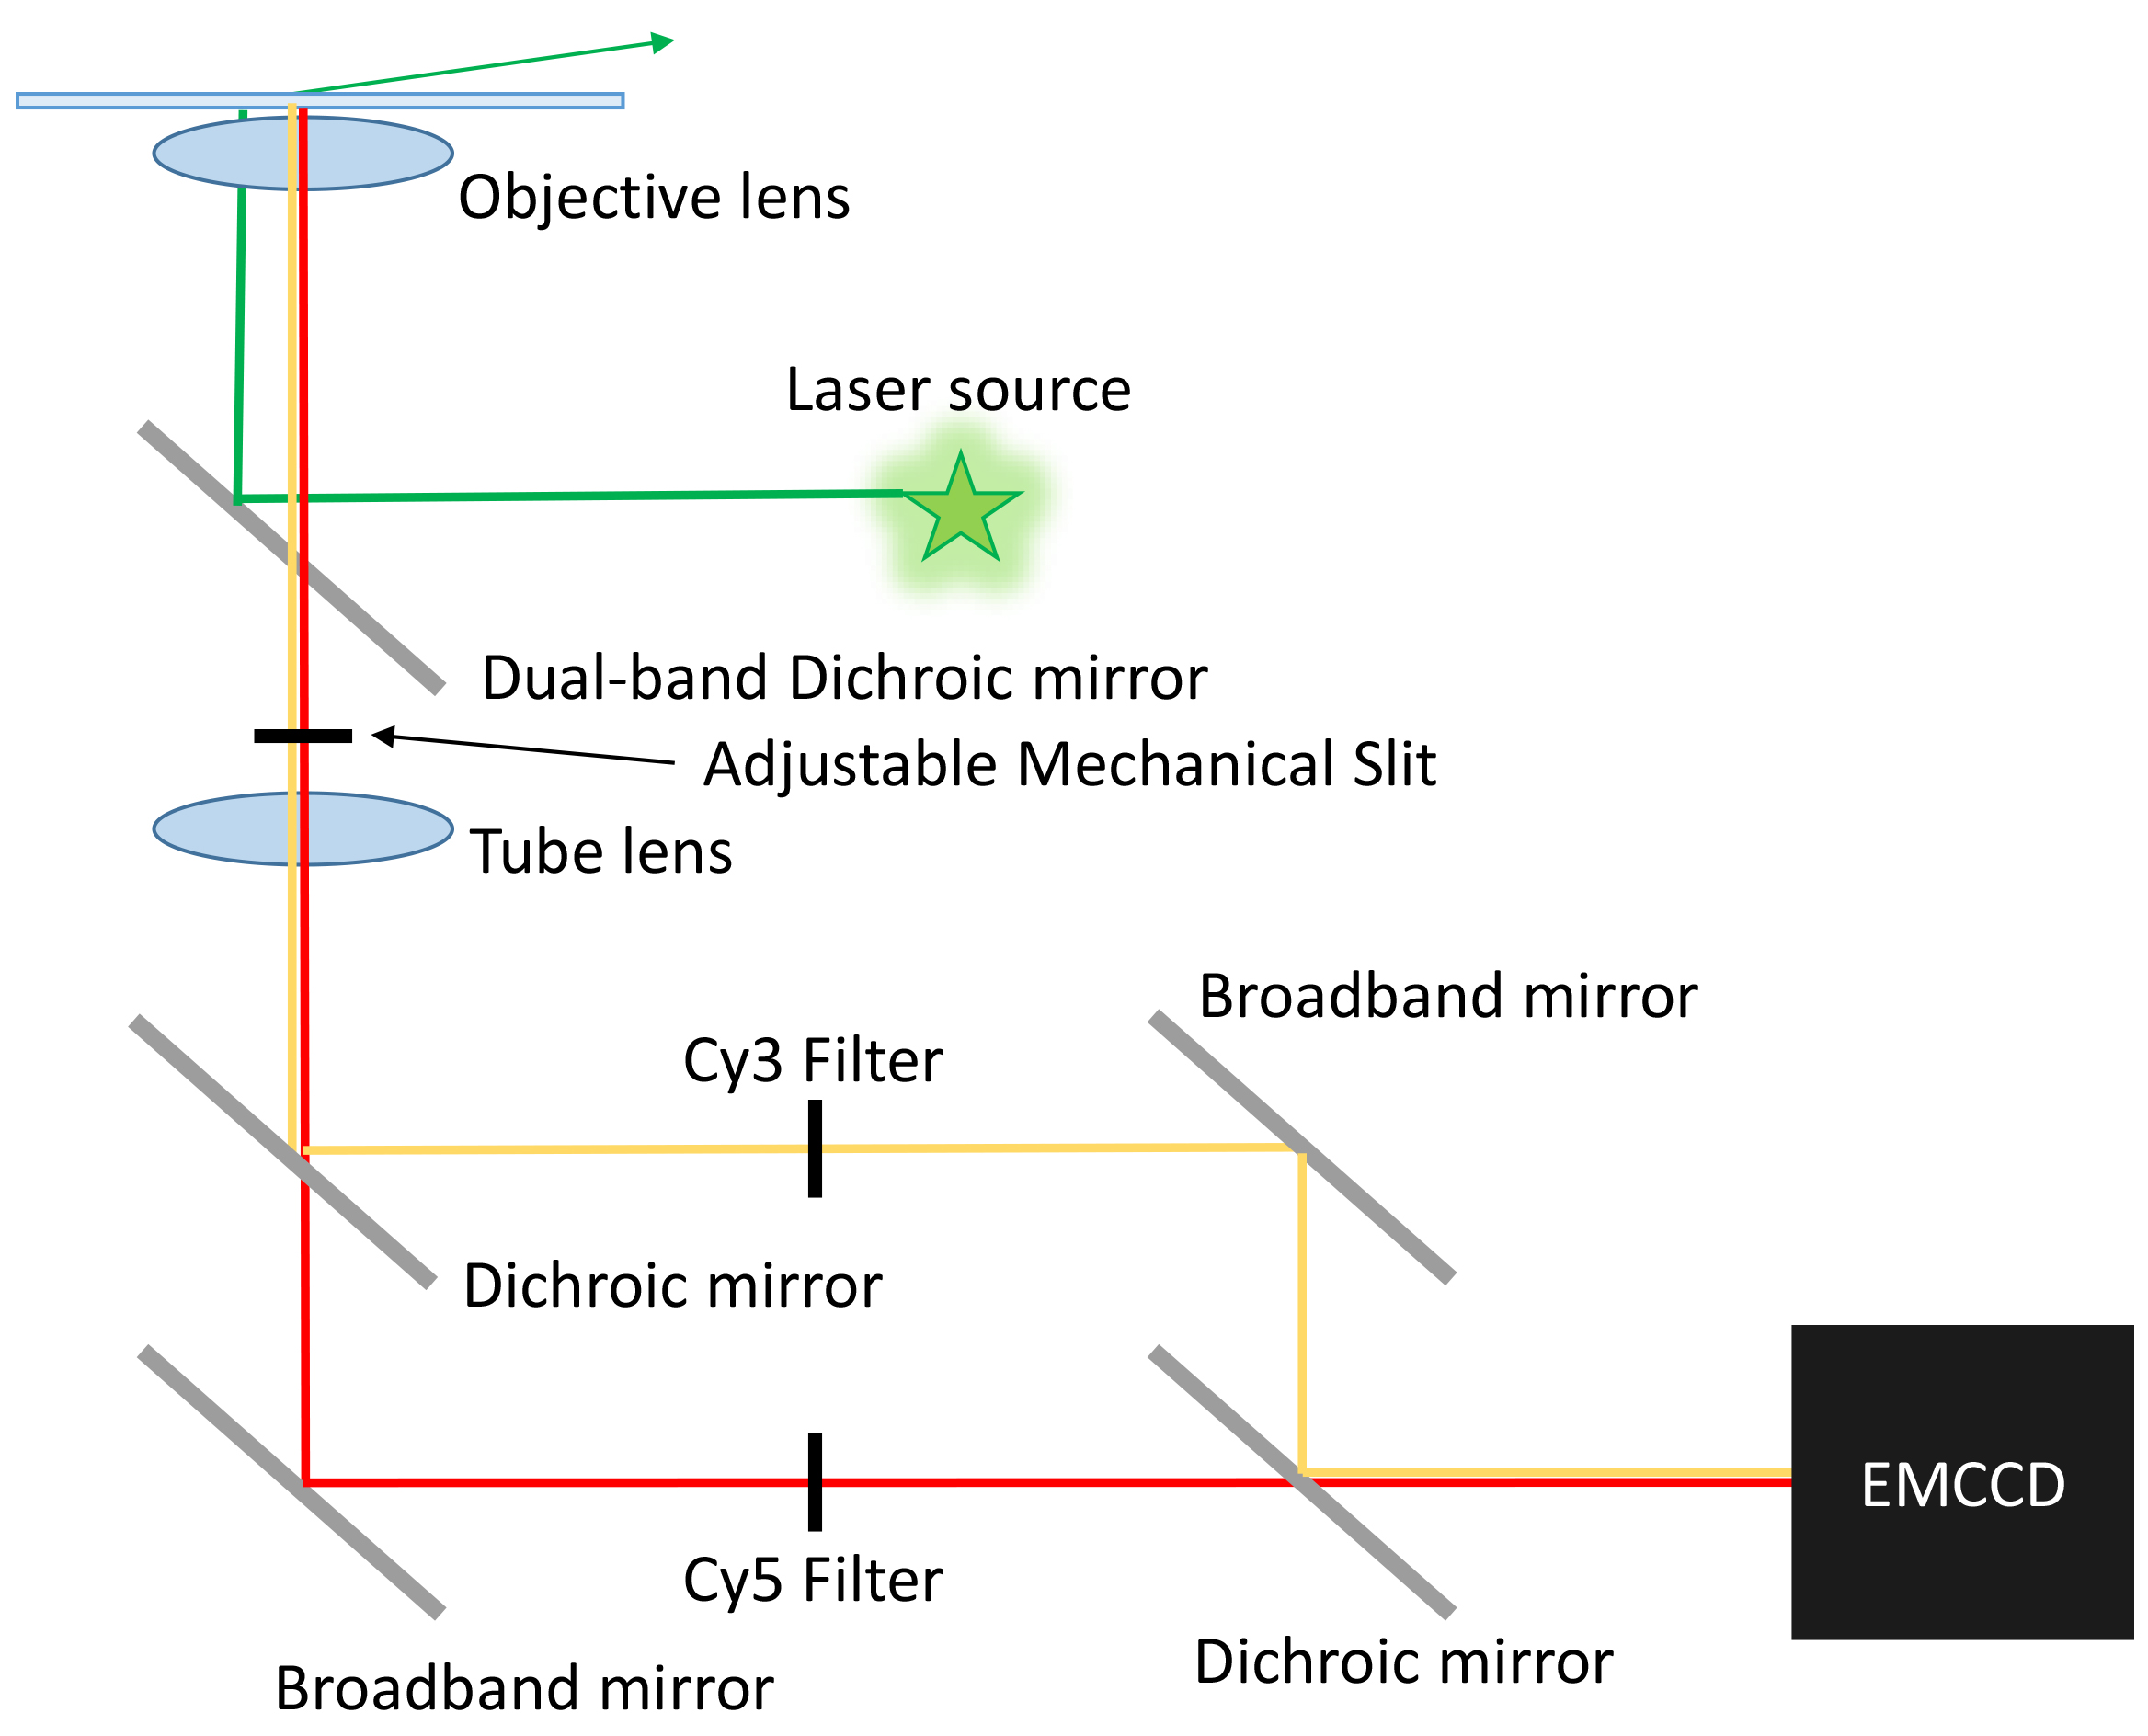
Figure 2. Emission pathway of a microscope configured for two channel FRET. The emission is transmitted through a dichroic with two transmission bands compatible with the FRET pair. An adjustible mechanical slit is placed at the image plane. A dichroic is placed near the image plane formed by the tube lens to split the two bands of emission. Filters are placed in the path between the first dichroic and the second dichroic, which recombines the emissions in the same direction. The broadband mirrors are adjusted so that the light from each path covers half of the sensor. If aligned properly, there should be no difference in orientation or magnification between the two images. - Sample preparation
Day 1
At the end of the day, inoculate yeast cells into SD Complete liquid media in a culture flask from cells actively growing on an SD Complete plate.
Day 2–cell fixation and permeabilization- Measure cell OD600 using a spectrophotometer at 600 nm by placing 1 ml of cell culture in a cuvette.
- Once cell OD600 has reached 0.6, decant cell solution into a 50 ml Falcon tube and pellet by centrifuging at 671 x g for 5 min and aspirate.
- Resuspend the pellet in 10 ml of ice cold (4 °C) methanol for 10 min for fixation.
- Pellet cells and resuspend in ice cold Buffer B twice and aspirate.
- Resuspend the cells in 1 ml of Spheroplasting buffer and transfer to a 1.75 ml microcentrifuge tube and add 2 µl of 5 units/µl of zymolyase and gently pipette to mix. (Note C1)
- Incubate the cells for 30 min or until the OD600 of 100 µl of cells added to 900 µl of deionized water shows a reduction of 30% from the initial OD after 1 min, which demonstrates cell lysis.
- Pellet the cells and aspirate. Centrifuge at no more than 268 x g since they are fragile once they are spheroplasts.
- Wash the cells two more times in ice cold Buffer B and aspirate.
- Resuspend the cells in 1 ml of 70% ethanol and keep at 4 °C for a minimum of 1 h to overnight. (Note C2)
- Pellet cells at 268 x g and wash twice each with 1 ml Wash Buffer and aspirate. Wash buffer should be prepared fresh and formamide should be warmed to room temperature before opening. (Notes D1 and F2)
- Dilute the probes to 1 µM in 10 mM Tris-HCl, pH 8.
- Prepare a mixture of hybridization buffer and probes based on the working concentration determined by titration. (Note D2)
- Resuspend cells to a final volume of 100 µl in the probe-hybridization buffer mixture by gentle pipetting.
- Then wrap samples with aluminum foil to prevent photobleaching and place in an incubator at 30 °C overnight.
Day 3/Day4–Slide Preparation- Pellet cells at 268 x g and wash twice each with 1 ml Wash Buffer and aspirated. (Note D3)
- Imaging buffer is prepared immediately before use. (Note D4)
- Wipe the slides with ethanol; or (optional) clean slides and coverslips in a plasma cleaner for 10 min.
Note: The slide should be clean of dust and other particles by wiping with ethanol. Any air bubbles will severely impact the performance of the Imaging Buffer. - Mix 2.5 µl of Imaging Buffer with 2.5 µl of cells and place on the coverslip.
- Place the coverslip on a slide and seal with epoxy. (Note E)
Note: Slides should be kept in a dark place while not on the microscope. Several slides can be prepared simultaneously. Once sealed, the performance of the imaging buffer will not degrade for several hours.
- Measure cell OD600 using a spectrophotometer at 600 nm by placing 1 ml of cell culture in a cuvette.
- Data acquisition
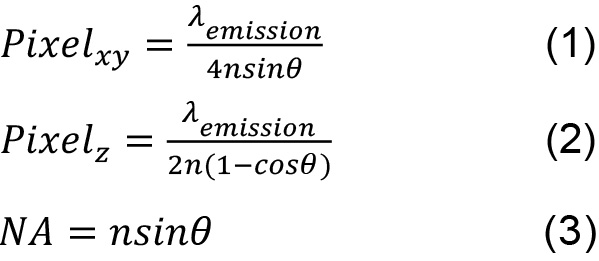
Using a microscope as described above (Note F1), hardware control and the acquisition parameters can be set in the Micromanager software (Edelstein et al., 2014). Z-stack images can be acquired using the multi-dimensional tool in Micromanager for each channel of interest (e.g., DIC, Cy5, etc.).- Aquire images at full region of interest (512x512) on an EMCCD (iXonEM +, Andor) at 100 msec exposure times. The pixel size and z-step were chosen to be less than or equal to the Nyquist sampling limit for the shortest wavelength (see Introduction to Fourier Optics 3rd edition, Goodman).
- Set the laser to output 25 mW at the sample plane. For each chamber, the thickness is approximately 2 µm and acquire an appropriate number of z-slices. An example of the contrast between a negative control and a low copy number strain is shown in Figure 3. (Note F2) An example of bleedthrough can be seen in Figure 4.
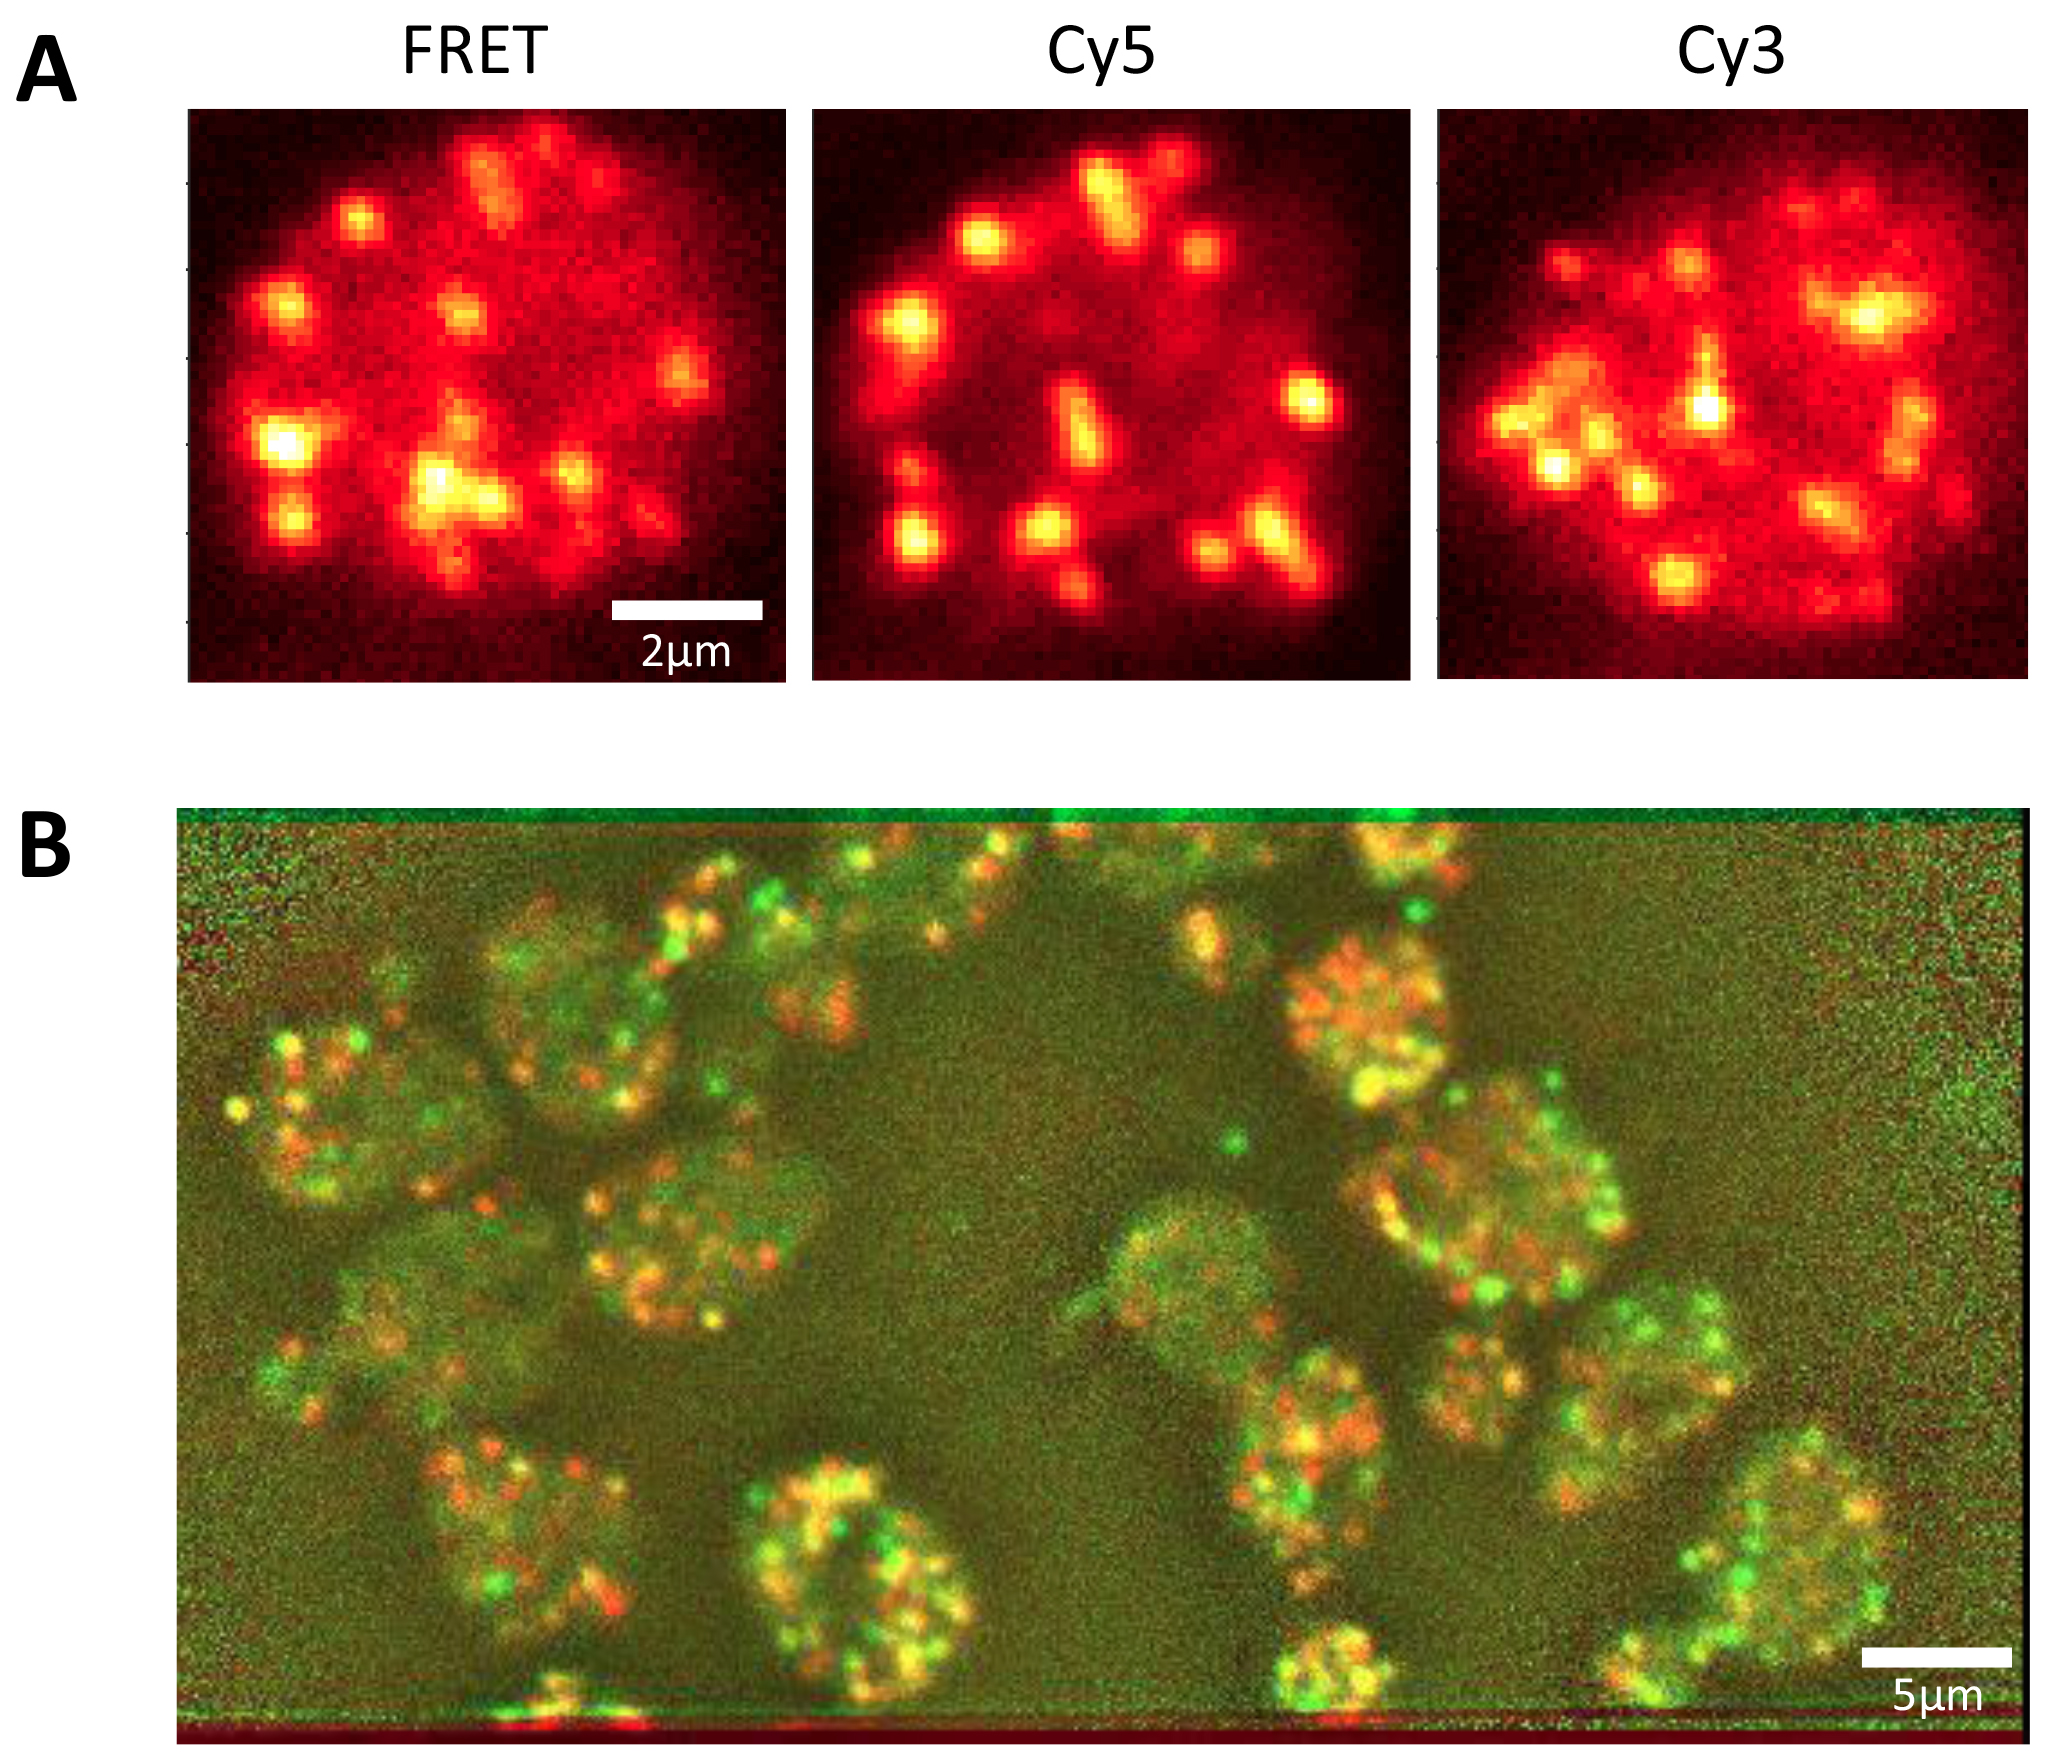
Figure 3. Example images of dual-probe FISH-FRET. A. Three channels of a FRET acquisition are shown on a single cell expressing yEvenus mRNA where every target should have both probes. The left and right images are during excitation using 532 nm light. These images represent a single z-slice of Cy5 emission (left) and Cy3 emission (right). Cy5 emission during direct excitation with 640nm light is shown in the center. This image was taken second so that the spots that are visible in the FRET (left) image but not the Cy5 (center) image are primarily due to photobleaching. The spots visible in the Cy3 (right) image are due to a combination of non-specific binding (lower melting temperature of the probe) and lower detection efficiency (inactive fluorophores). B. The 256x512 image of Cy5 under direct (Red) and FRET (Green) emission is shown. Where fluorophores were detected in both channels, the image is yellow. The direct excitation was measured second. Approximately 80% of fluorophores were detected in both under this excitation condition with the difference due to photobleaching during excitation by FRET. Shown above is an example where transcripts are countable (~40 spots per cell). A more extreme example (~1,000 transcripts expected) of FRET detection is shown in Wadsworth et al., 2017. In this example, the control shows that crosstalk between channels is minimal.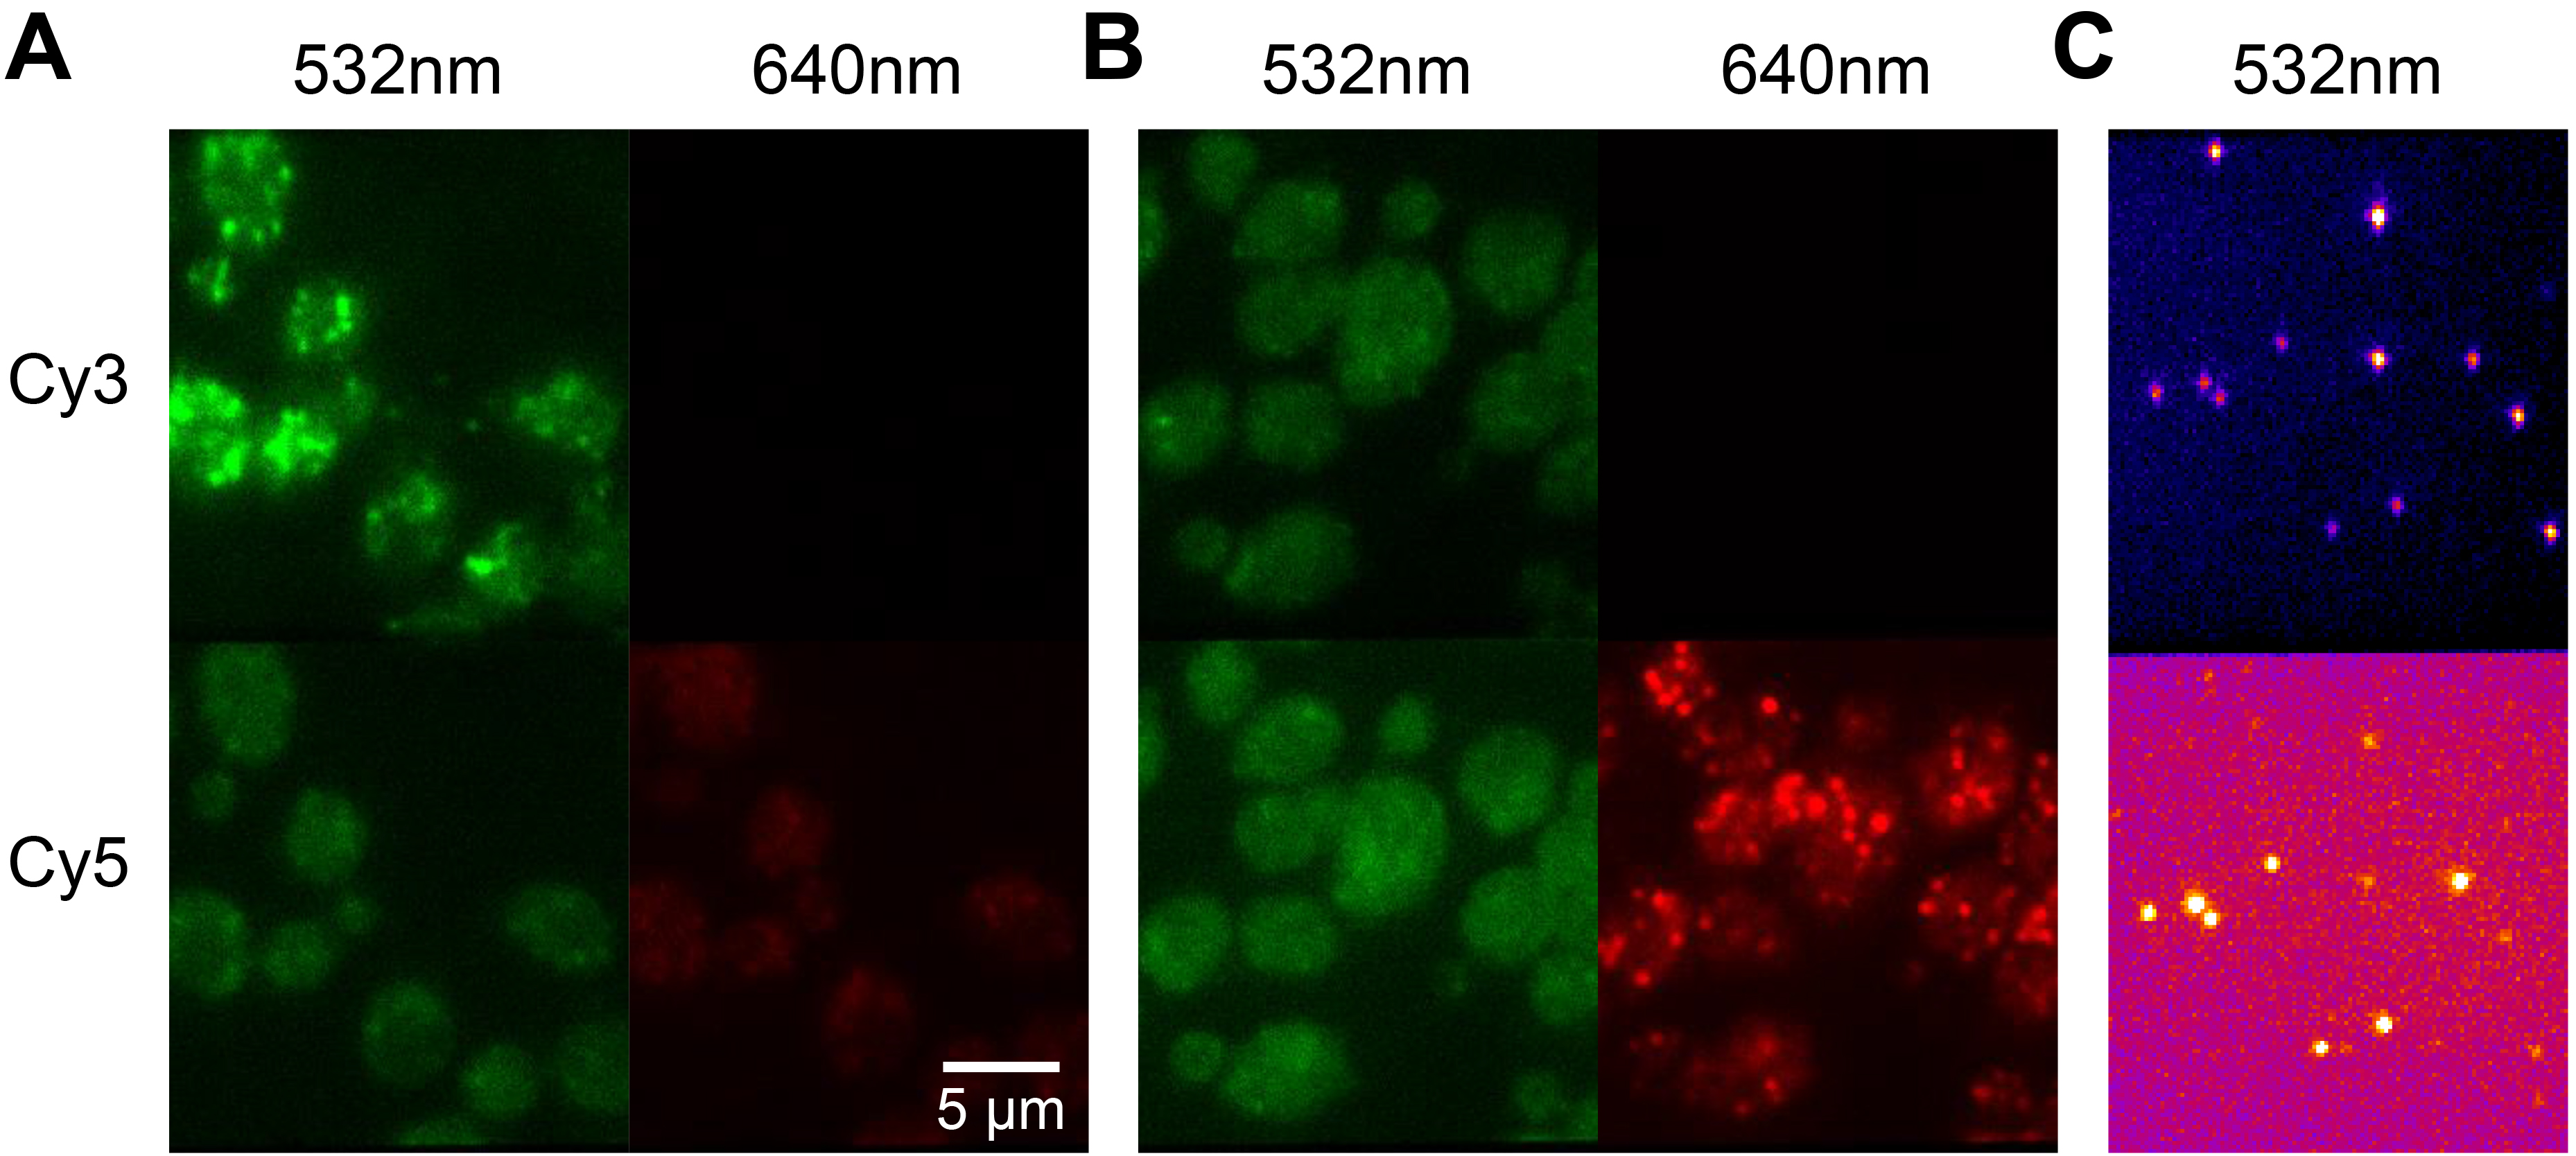
Figure 4. Controls for dual-probe FISH-FRET. Each image shown is at the same scale and contrast. A. Cells that have only been treated with a Cy3 labeled probe are shown in dual-view where the emission on the top and bottom panels of a slice were acquired simultaneously. Some bleedthrough is expected in FRET experiments. Much of the intensity in the bottom channel during 532 nm excitation is due to cellular auto-fluorescence, however, there are some peaks in intensity due to Cy3 emission in the Cy5 channel. B. Cells with only Cy5 labeled probes are shown. Under 532 nm excitation there is very little fluorescence observed. Under 640 nm excitation, Cy5 is seen in the bottom panel and virtually no emission is observed in the top panel. C. In a TIR setup, Cy3 and Cy5 are observed when labeled on the same DNA oligo bound to the surface with BSA-biotin. These are designed to calibrate the affine transformation that maps the top panel to the bottom panel. They can also be used to calibrate sensitized emission to determine FRET efficiency since these fluorophores are separated by a known number of nucleotides and double stranded DNA is essentially rigid below its persistence length. Variations in spot intensity here are due to non-uniform illumination.
- Aquire images at full region of interest (512x512) on an EMCCD (iXonEM +, Andor) at 100 msec exposure times. The pixel size and z-step were chosen to be less than or equal to the Nyquist sampling limit for the shortest wavelength (see Introduction to Fourier Optics 3rd edition, Goodman).
Data analysis
The Matlab Image Processing Toolbox was used to analyze the three-dimensional images. In cases where the researcher is unfamiliar with coding we recommend FISH-quant for its rigor and user friendly GUI. For systems with very non- uniform illumination Corrected Intensity Distributions using Regularized Energy minimization (CIDRE) (Smith et al., 2015) can be used to flatten the images. Many functions in the Image Processing Toolbox can be accelerated by simply converting them to a gpuArray () in Matlab with a compatible graphics card (e.g., Nvidia Geforce 1080). An outline of the algorithm used to locate cells and spots is as follows:
- Segmentation
- Perform edge detection on the sharpest DIC image using the Sobel filter in Matlab.
- Connect detected edges using 1x4 and 4x1 structural elements.
- Perform binary morphological erosion and dilation of the image.
- Label the detected regions using the bwlabeln () function.
- Perform edge detection on the sharpest DIC image using the Sobel filter in Matlab.
- Spot detection
- Apply a wide Gaussian filter to the image and subtract the result from the raw data as an approximation of background fluorescence.
- Apply a Laplacian of Gaussian (LoG) filter to the result to enhance the spots.
- Inside each region detected by segmentation, find pixels that are local maxima in the LoG result and call those spot candidates.
- Fit each spot candidate with a Gaussian profile and subtract the mean intensity of the annular region around the spot from each pixel included in the spot to get the spot intensity.
- Determine some threshold brightness based on the intensity of single spots detected on the surface of the slide.
- Count the spots detected in each cell by using logical indexing of the segmented cells on a 3D array where the detected centers are marked as 1 and all other locations are 0.
- Apply a wide Gaussian filter to the image and subtract the result from the raw data as an approximation of background fluorescence.
- Colocalization
This step is unnecessary unless interested in the efficiency of hybridization or some other feature requiring colocalization of spots in any of the channels.- Spots are detected in each image.
- An affine transformation is calculated to overlay the image by using data taken with an alignment sample bound to the surface in half-FRET condition (Cy3 and Cy5 linked to the same DNA molecule at an intermediate FRET radius), see Figure 4C.
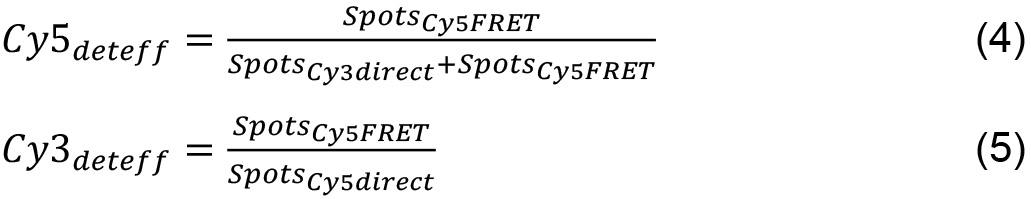
- Cy5 spots under FRET and direct excitation are counted as colocalized if they are within a 2 pixel radius. The detection efficiency for each probe can be estimated as follows:
- Spots are detected in each image.
Notes
- Probe design notes
- The detection efficiency of each probe will be different due to sequence dependence. It should be anticipated in FRET probe pair design that one probe could be detected more efficiently than the other. The efficiency is estimated by counting the spots in each channel as shown in equations (4) and (5). The assumption in this case is that both sequences show up for all target RNA. If the target has isoforms, the assumption fails because the lack of the acceptor no longer implies that it failed to bind. In this case, we can only determine the efficiency of the donor binding. To determine the efficiency of the acceptor, it is necessary to either include a third probe that should colocalize every time the acceptor is detected.
- We have used single probes of lengths between 18-30 nt with both internal labeling and end labeling. When compared to a standard smFISH probe set (Biosearch Technologies), we found that the probes hybridized between 50-70% of the true transcript count (Wadsworth et al., 2017). This seems to have more dependence on melting temperature than length. Further, we found that the modified Cy5 analog Quasar 670 was much dimmer (it has a smaller molar extinction coefficient) so that Cy5 outperformed substantially. Finally, when using single probes that can be added independently of one another, we found that the true transcript count was achieved with 4-5 probes (Wadsworth et al., 2017).
- The detection efficiency of each probe will be different due to sequence dependence. It should be anticipated in FRET probe pair design that one probe could be detected more efficiently than the other. The efficiency is estimated by counting the spots in each channel as shown in equations (4) and (5). The assumption in this case is that both sequences show up for all target RNA. If the target has isoforms, the assumption fails because the lack of the acceptor no longer implies that it failed to bind. In this case, we can only determine the efficiency of the donor binding. To determine the efficiency of the acceptor, it is necessary to either include a third probe that should colocalize every time the acceptor is detected.
- Microscope alignment
It is not necessary to have a custom-built microscope. The minimum criteria for a microscope to detect single fluorophores is a ~1.4 NA 100x Objective, an EMCCD, a coherent light source with at least 5 mW of power at the sample plane, and variable angle illumination (TIR/HILO.) Any microscope that can be adjusted from epi-fluorescence to total internal reflection geometry is adequate to accomplish HILO. We do not recommend TIR geometry as the yeast samples are general 2-3 µm thick and this is well outside the range of TIR. TIR will only illuminate probes non-specifically bound to the surface and not in the cytoplasm.
We do not recommend a confocal microscope because the signal is in the 1-2 photon limit that is beyond the capability of most turnkey confocal setups. Also, we do not recommend sCMOS or CCD cameras because of the 1-2 photon regime. We have tested several in-house and had poor results.
With the Andor EMCCD (EM stands for electron multiplying), we can observe single fluorophores in either a HILO or total internal reflection geometry with nominal gain between 50-500 depending on the fluorophore. With our illumination setup, we find no reason to expose for longer than 100 msec although exposures of 1 sec to 2 sec are common in literature.
The dual-view setup described here is not necessary, however, it has several advantages over sequential acquisition of acceptor channel and donor channel. These include reducing the time of exposure and thereby reducing the chance of acceptor photobleaching during acquisition. Also, it reduces bleedthrough by introducing dichroism which separate the emission pathways of the two channels. - Sample Preparation: Day 2 notes
- Spheroplasting is the most critical step in order to get the probes inside the cell. If the population of cells is poorly converted to spheroplasts, there will be a lot of variability in the FISH spots counted. Spheroplasting can also be observed by DIC imaging. The cells should appear more round and there should be cell wall debris in the sample.
- While overnight treatment with ethanol is acceptable, we find the most consistent results when cells are hybridized after 1 hour of ethanol treatment.
- Spheroplasting is the most critical step in order to get the probes inside the cell. If the population of cells is poorly converted to spheroplasts, there will be a lot of variability in the FISH spots counted. Spheroplasting can also be observed by DIC imaging. The cells should appear more round and there should be cell wall debris in the sample.
- Day 2cont./Day 3 – hybridization notes
- When working with a sample in hybridization buffer, a sample volume that is too small will not produce a large enough pellet after hybridization. This is particularly noteworthy when trying to work with initial cell culture volumes of 5 ml to 10 ml. Also, it should be noted that the pellet should be around 10 µl to 20 µl of the hybridization volume. Larger concentrations of cells cause poor efficiency of probe penetration in any dense clusters of cells.
- Create serial dilutions of probes in hybridization buffer from 1 nM to 100 nM or a range where the detected number of FISH spots in the sample plateaus. This concentration is chosen as the working concentration of probes. 65 nM working concentration probes seems to be appropriate for probes of 60 °C RNA-DNA melting temperature in the range of 18-26 nt. This can also be done with the ratio of FRET probes in the working concentration. We found that a 1:1 ratio was generally adequate, but optimization of this ratio will likely lead to higher colocalization of Cy3 and Cy5 and reduce false negatives.
- When imaging, if there are many probes diffusing in solution around your cells, then the cells need further washing to remove unbound probes.
- Commercial anti-fade reagents such as Prolong Gold may work, but have not been tested in our lab for single fluorophore detection.
- When working with a sample in hybridization buffer, a sample volume that is too small will not produce a large enough pellet after hybridization. This is particularly noteworthy when trying to work with initial cell culture volumes of 5 ml to 10 ml. Also, it should be noted that the pellet should be around 10 µl to 20 µl of the hybridization volume. Larger concentrations of cells cause poor efficiency of probe penetration in any dense clusters of cells.
- Day 3/Day4 – Slide preparation notes
The imaging buffer will not perform well if not used immediately. When imaging, if probes rapidly photobleach as the slide is explored by moving from one field of view to the next with live viewing, which means your imaging buffer is not working due to expiring or due to tiny bubbles in the chamber (they can be seen by eye).
We avoid using nail polish although it is common, because it contains solvents that will stick into the sample and cause photobleaching or auto-fluorescence. We find epoxy does not have that effect. - Data acquisition notes
- We use a 1.4 NA 100x objective with additional magnification to oversample based on the Nyquist criterion. The camera is set to Frame Transfer mode. The hardware binning is set to 1x1. The gain is set to a level that confines the intensity to the dynamic range of the camera on the brightest sample (200 for Cy5).
- When trouble shooting poor signal to noise, there are several potential sources of auto-fluorescence; methanol, ethanol, and formamide. We found that lower grade methanol and ethanol are fluorescent in the visible spectrum and use ≤ 99.5 ACS grade reagents. Also, if the auto-fluorescence appears during the hybridization procedure, it is likely because of formamide being contaminated. Formamide is very delicate and will convert to formic acid when mixed with water from condensation if handled poorly. This will lead to inconsistent results.
- We use a 1.4 NA 100x objective with additional magnification to oversample based on the Nyquist criterion. The camera is set to Frame Transfer mode. The hardware binning is set to 1x1. The gain is set to a level that confines the intensity to the dynamic range of the camera on the brightest sample (200 for Cy5).
Recipes
- SD Complete (1 L)
- Carbon, Nitrogen, and Salts (CNS) 26.7 g
Dextrose 20 g
Ammonium sulfate 5 g
Potassium phosphate monobasic 1 g
Magnesium sulfate 0.5 g
Sodium chloride 0.1 g
Calcium chloride 0.1 g - Vitamins and trace elements (Vitamix) 2,840 µl
Biotin (5 mg/50 ml) 20 µl Calcium pantothenate (1 g/50 ml) 20 µl Folic acid (5 mg/50 ml) 20 µl Inositol (0.5 g/50 ml) 200 µl Niacin (0.1 g/50 ml) 200 µl P-aminobenzoic acid (50 mg/50 ml) 200 µl Pyridoxine HCl (1 g/50 ml) 20 µl Riboflavin (5 mg/50 ml) 2 ml Thiamine HCl (1 g/50 ml) 20 µl Boric acid (1.25 g/50 ml) 20 µl Copper sulfate (0.1 g/50 ml) 20 µl Potassium iodide (0.25 g/50 ml) 20 µl Ferric chloride (0.5 g/50 ml) 20 µl Manganese sulfate (1 g/50 ml) 20 µl Sodium molybdate (0.5 g/50 ml) 20 µl Zinc sulfate (1 g/50 ml) 20 µl - Complete Supplement Mixture (CSM) 790 mg
Adenine 10 mg
Arginine 50 mg
Aspartic acid 80 mg
Histidine 20 mg
Isoleucine 50 mg
Leucine 100 mg
Lysine 50 mg
Methionine 20 mg
Phenylalanine 50 mg
Threonine 100 mg
Tryptophan 50 mg
Tyrosine 50 mg
Uracil 20 mg
Valine 140 mg - Bacto-agar 20 g optional (requires pH 5.8)
- Carbon, Nitrogen, and Salts (CNS) 26.7 g
- Buffer B (1 L)
Sorbitol (218 g)
Potassium phosphate (dibasic) (17.4 g)
RNase free water - Spheroplasting Buffer (10.1 ml)
Buffer B 10 ml
Vanadyl ribonucleoside complex 100 µl (200 mM) - Hybridization Buffer (10 ml)
Dextran sulfate 1 g
Escherichia coli tRNA 10 mg
Vanadyl ribonucleoside complex 100 µl (200 mM)
BSA 40 µl (5 mg/ml) (RNase free)
20x SSC 1 ml (RNase free)
RNase free water - Wash Buffer (50 ml)
Formamide 5 ml (RNase free)
20x SSC 5 ml (RNase free)
RNase free water - Imaging Buffer (100 µl)
Trolox (1 mM) 70 µl 20x SSC 10 µl Tris-HCl (200 mM, pH 8) 5 µl Protocatechuic acid (PCA) (25 mM) 10 µl Protocatechuate-3,4-dioxygenase (PCD)(200 nM) 5 µl
Acknowledgments
Parts of this protocol have been adapted from Raj et al. (2010). This work was supported by Georgia Institute of Technology startup funds, GAANN Molecular Biophysics and Biotechnology Fellowship, and the National Institutes of Health grant (R01-GM112882).
Competing interests
The authors declare no conflicts of interests or competing interests.
References
- Edelstein, A. D., Tsuchida, M. A., Amodaj, N., Pinkard, H., Vale, R. D. and Stuurman, N. (2014). Advanced methods of microscope control using muManager software. J Biol Methods 1(2).
- Raj, A. and Tyagi, S. (2010). Detection of individual endogenous RNA transcripts in situ using multiple singly labeled probes. Methods Enzymol 472: 365-386.
- Smith, K., Li, Y., Piccinini, F., Csucs, G., Balazs, C., Bevilacqua, A. and Horvath, P. (2015). CIDRE: an illumination-correction method for optical microscopy. Nat Methods 12(5): 404-406.
- Tokunaga, M., Imamoto, N. and Sakata-Sogawa, K. (2008). Highly inclined thin illumination enables clear single-molecule imaging in cells. Nat Methods 5(2): 159-161.
- Wadsworth, G. M., Parikh, R. Y., Choy, J. S. and Kim, H. D. (2017). mRNA detection in budding yeast with single fluorophores. Nucleic Acids Res 45(15): e141.
- Zuker, M. (2003). Mfold web server for nucleic acid folding and hybridization prediction. Nucleic Acids Res 31(13): 3406-3415.
Article Information
Copyright
© 2018 The Authors; exclusive licensee Bio-protocol LLC.
How to cite
Wadsworth, G. M., Parikh, R. Y. and Kim, H. D. (2018). Dual-probe RNA FRET-FISH in Yeast. Bio-protocol 8(11): e2867. DOI: 10.21769/BioProtoc.2867.
Category
Molecular Biology > RNA > RNA detection
Microbiology > Microbial genetics > Gene expression
Do you have any questions about this protocol?
Post your question to gather feedback from the community. We will also invite the authors of this article to respond.