- Protocols

- Articles and Issues
- For Authors
- About
- Become a Reviewer

Histone Deubiquitination Assay in Nicotiana benthamiana


Published: Vol 8, Iss 5, Mar 5, 2018 DOI: 10.21769/BioProtoc.2746 Views: 6704
Reviewed by: Tohir BozorovAnonymous reviewer(s)
Original research article
The authors used this protocol in:
Aug 2016
Advertisement


Protocol Collections
Comprehensive collections of detailed, peer-reviewed protocols focusing on specific topics


Abstract
Histone modifications are a group of post-translational modifications on histones which can alter chromatin structure and affect gene expression. Histone ubiquitination is a histone modification found in particular on histone H2A and H2B. Histone ubiquitination can be reversed by ubiquitin-specific proteases (UBP). Here, we describe an in vivo assay for histone deubiquitination activity. After infiltrating UBP12 into Nicotiana benthamiana leaves, H2Aub was visualized by immunocytochemistry. Nicotiana benthamiana leaves, which show high agro infiltration efficiency, were used for transient UBP12 expression for a labor- and time-saving protocol. Reduced H2Aub levels indicated histone deubiquitination activity of UBP12. The clear visualization of nuclei of N. benthamiana leaves makes this method able to easily measure the level of histone modification in vivo by using specific antibodies, providing robust clues of protein function. Thus, this protocol is a powerful complementation to in vitro assays of histone deubiquitination activity.
Keywords: Histone deubiquitinationBackground
Histone modifications play important roles in regulating chromatin structure and gene expression. Best studied histone modifications include methylation, acetylation, phosphorylation, ubiquitination and sumoylation. However, enzymes introducing or removing specific histone modifications are not always known. Powerful in vitro assays can establish the catalytic potential of histone modifying enzymes but in vivo methods are desirable to confirm that in vitro specificity reflects in vivo activity. Here, we describe a flexible protocol to test activity of histone modifying enzymes in the plant N. benthamiana. Although we used the protocol to test activity of ubiquitin specific protease (UBP) on ubiquitylated H2A, it can also easily be adopted to other histone modifications for which specific antibodies are available.
Materials and Reagents
- 50 ml and 15 ml screw cap tubes (SARSTEDT, catalog numbers: 62.547.254 and 62.554.002 )
- 2 ml and 1.5 ml microtubes (SARSTEDT, catalog numbers: 72.695.500 and 72.690.001 )
- 5 ml syringe (BD plastipak, BD, catalog number: 302187 )
- Razor blade (Feather Safety Razor, catalog number: 02.015.00.024 )
- Petri dish, 9.2 cm diameter (SARSTEDT, catalog number: 82.1473.001 )
- CellTrics® (pore size 30 μm) (Sysmex, catalog number: 04-0042-2316 )
- Absorbent paper (Kimberly-Clark, catalog number: 3020 )
- Microscopic slides and cover slips (VWR, catalog number: 631-1551 and 631-9430 )
- Nicotiana benthamiana wild-type plants (seeds kindly provided by Dr. Savenkov, Uppsala), 4-6 weeks old (cultivated at 24 °C,16 h light, 8 h dark, 60% humidity); mature leaves (flat surface and edge) are used
- Agrobacterium tumefaciens strain GV3101 harboring pUBC-UBP12-CFP plasmid (Derkacheva et al., 2016)
- Agrobacterium tumefaciens strain GV3101 harboring pUBC-H3.3-CFP plasmid (Derkacheva et al., 2016)
- Agrobacterium tumefaciens strain GV3101 harboring viral RNA silencing suppressor p19 (kindly provided by E. Savenkov, Uppsala)
- LB broth high salt (Duchefa Biochemie, catalog number: L1704.2500 )
- Formaldehyde (Sigma-Aldrich, catalog number: F8775 )
- Antibody anti-H2Aub (Cell Signaling Technology, catalog number: 8240 )
- Antibody anti-H4 (Merck, EMD Millipore, catalog number: 05-858 )
- Antibody Alexa Fluor 555 conjugated goat anti-rabbit Kit (Thermo Fisher Scientific, Invitrogen, catalog number: A31629 )
- VECTASHIELD® mounting medium with 1 μg/ml DAPI (Vector Laboratories, catalog number: H-1200 )
- Bovine serum albumin (BSA) (Carl Roth, catalog number: 3737.2 )
- MES (Duchefa Biochemie, catalog number: M1503 )
- Magnesium chloride hexahydrate (MgCl2·6H2O) (Sigma-Aldrich, catalog number: M9272 )
- Acetosyringone (Sigma-Aldrich, catalog number: D134406 )
- Tris base (VWR, catalog number: 28811.364 )
- EDTA disodium salt (Na2-EDTA) (Sigma-Aldrich, catalog number: ED2SS )
- Sodium chloride (NaCl) (Merck, catalog number: 567441 )
- 37% HCl (Merck, catalog number: 1.00317.2500 )
- Spermine (Sigma-Aldrich, catalog number: 85590 )
- Potassium chloride (KCl) (Merck, catalog number: 529552 )
- Triton X-100 (Sigma-Aldrich, catalog number: X100 )
- Sodium dihydrogen phosphate dihydrate (NaH2PO4·2H2O) (Merck, EMD Millipore, catalog number: 106342 )
- Sodium hydrogen phosphate (Na2HPO4) (Sigma-Aldrich, catalog number: S3264 )
- Infiltration medium (see Recipes)
- Tris buffer (see Recipes)
- LB01 lysis buffer (see Recipes)
- PBS buffer (see Recipes)
Equipment
- Centrifuges (Eppendorf, model: 5804 R and Thermo Fisher Scientific, Thermo ScientificTM, model: HeraeusTM PicoTM 17 )
- Surgical scissors (DIMEDA Instrumente, catalog number: 08.340.11 )
- Laminar hood
- Pipettes (Gilson, model: PIPETMAN® Classic, P2 , P20 , P200 , P1000 )
- Humid incubator
- Confocal microscope (ZEISS, model: LSM 780 )
Procedure
- Culture A. tumefaciens carrying pUBC-UBP12-CFP, pUBC-H3.3-CFP (as a control) or p19 in 3 ml of liquid LB in 15 ml screw cap tubes separately for 20 h at 28 °C.
- Centrifuge the culture in 2 ml microtubes at 1,500 x g for 5 min at room temperature, discard the supernatant and then suspend the A. tumefaciens pellet in infiltration medium by adjusting OD600 to 1.0.
- Combine the same amount (usually 1 ml) of pUBC-UBP12-CFP or pUBC-H3.3-CFP with (1 ml) p19 culture in a 2 ml microtube.
Note: The p19 construct can increase expression of transgenes in transfected N. benthamiana cells. Without p19 expression, transfected N. benthamiana cells often silence transgenes resulting in low and variable expression. Presence of p19 partially blocks RNA silencing and thus establishes higher and more uniform transgene expression making the presented assay more sensitive and more reproducible. - Place the microtube horizontally for 2 h at room temperature.
- Use a needle to punch some holes in the abaxial (lower) side of 3 to 4 N. benthamiana leaves and infiltrate the A. tumefaciens culture with a 5 ml syringe.
- Between 48 h and 72 h after infiltration, the area of the infiltrated tobacco leaves near the holes is cut into pieces of about 1 x 1 cm using scissors and fixed in 10 ml of Tris buffer containing 4% formaldehyde in 50 ml screw cap tubes on ice for 20 min (operate in a laminar hood to avoid exposure to formaldehyde).
- Pour off the Tris buffer and wash the sample twice with 20 ml of ice-cold Tris buffer each for 10 min.
- Chop the leaves with a razor blade in 400 μl of LB01 buffer in a Petri dish on ice to release the nuclei.
- Filter the suspension through CellTrics® into a new 1.5 ml microtube.
- Pipet 5 to 10 μl of the suspension onto a microscopic slide and air-dry the suspension (about 5 to 10 min) (Note 1).
- Pipette 100 μl of PBS buffer containing 4% formaldehyde onto the slides to postfix the nuclei for 30 min at room temperature (operate in a laminar hood to avoid exposure to formaldehyde), then lean the slides and absorb the PBS buffer by absorbent paper (Note 2).
- Pipette 100 μl of PBS buffer onto the slides to cover the nuclei for rinsing 5 min, then lean the slides and absorb the PBS buffer by absorbent paper, repeat once.
- Permeabilize the cells with 100 μl of 0.2% Triton X-100 (diluted in PBS buffer) for 5 min, then lean the slides and absorb the PBS buffer by absorbent paper.
- Pipette 100 μl of PBS buffer onto the slides to rinse the samples, then lean the slides and absorb the PBS buffer by absorbent paper, repeat 3-4 times.
- Apply sufficient volume (20-100 μl) of Image-iTTM FX signal enhancer to cover nuclei. Incubate for 30 min at room temperature in a humid incubator (Notes 3 and 4).
- Pipette 100 μl of PBS buffer onto the slides, then lean the slides and absorb the PBS buffer by absorbent paper.
- Antibody detection: Mix 1 μl of anti-H2Aub or anti-H4 (as a negative control) with 100 μl of 1% BSA in PBS buffer, pipet the solution on the slides, and incubate in a humid incubator at 37 °C for 2 h (Note 4).
- Pipette 100 μl of PBS buffer onto the slides to rinse the nuclei at room temperature three times, each for 10 min. Lean the slides and absorb the PBS buffer with absorbent paper each time.
- Mix 5 μl of Alexa Fluor 555 conjugated goat anti-rabbit antibody with 1 ml of 1% BSA in PBS buffer, pipet the solution onto the slides and incubate at 37 °C for 30 min.
- Pipette 100 μl of PBS buffer onto the slides at room temperature three times, each for 10 min. Lean the slides and absorb the PBS buffer with absorbent paper each time.
- Pipette VECTASHIELD® mounting medium with 1 μg/ml DAPI onto microscopic slides and cover with cover slips.
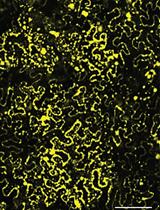
- Observe nuclei (DAPI), CFP signal and antibody signal under a confocal microscope such as a ZEISS LSM 780 using appropriate excitation wavelength. DAPI is excited by the 405 nm laser line; CFP is detected by the 485 nm laser line, while antibody is excited by the 555 nm laser line. DAPI shows the position of nuclei and CFP labels nuclei from transfected cells. Check several fields (about 50 nuclei) and compare the difference when infiltrating N. benthamiana leaves with A. tumefaciens carrying pUBC-UBP12-CFP or pUBC-H3.3-CFP. Figure 1 shows examples of microscopic detection of transfected nuclei and immunocytochemistry for the analyzed histone posttranslational modification (PTM; here, H2Aub). We found that H2Aub signals significantly decreased in cells expressing UBP12 compared to control cells expressing H3.3 (Figure 1A). In contrast, H4 signals did not differ significantly when UBP12 or H3.3 were expressed in N. benthamiana leaves (Figure 1B), implying deubiquitination activity of UBP12.
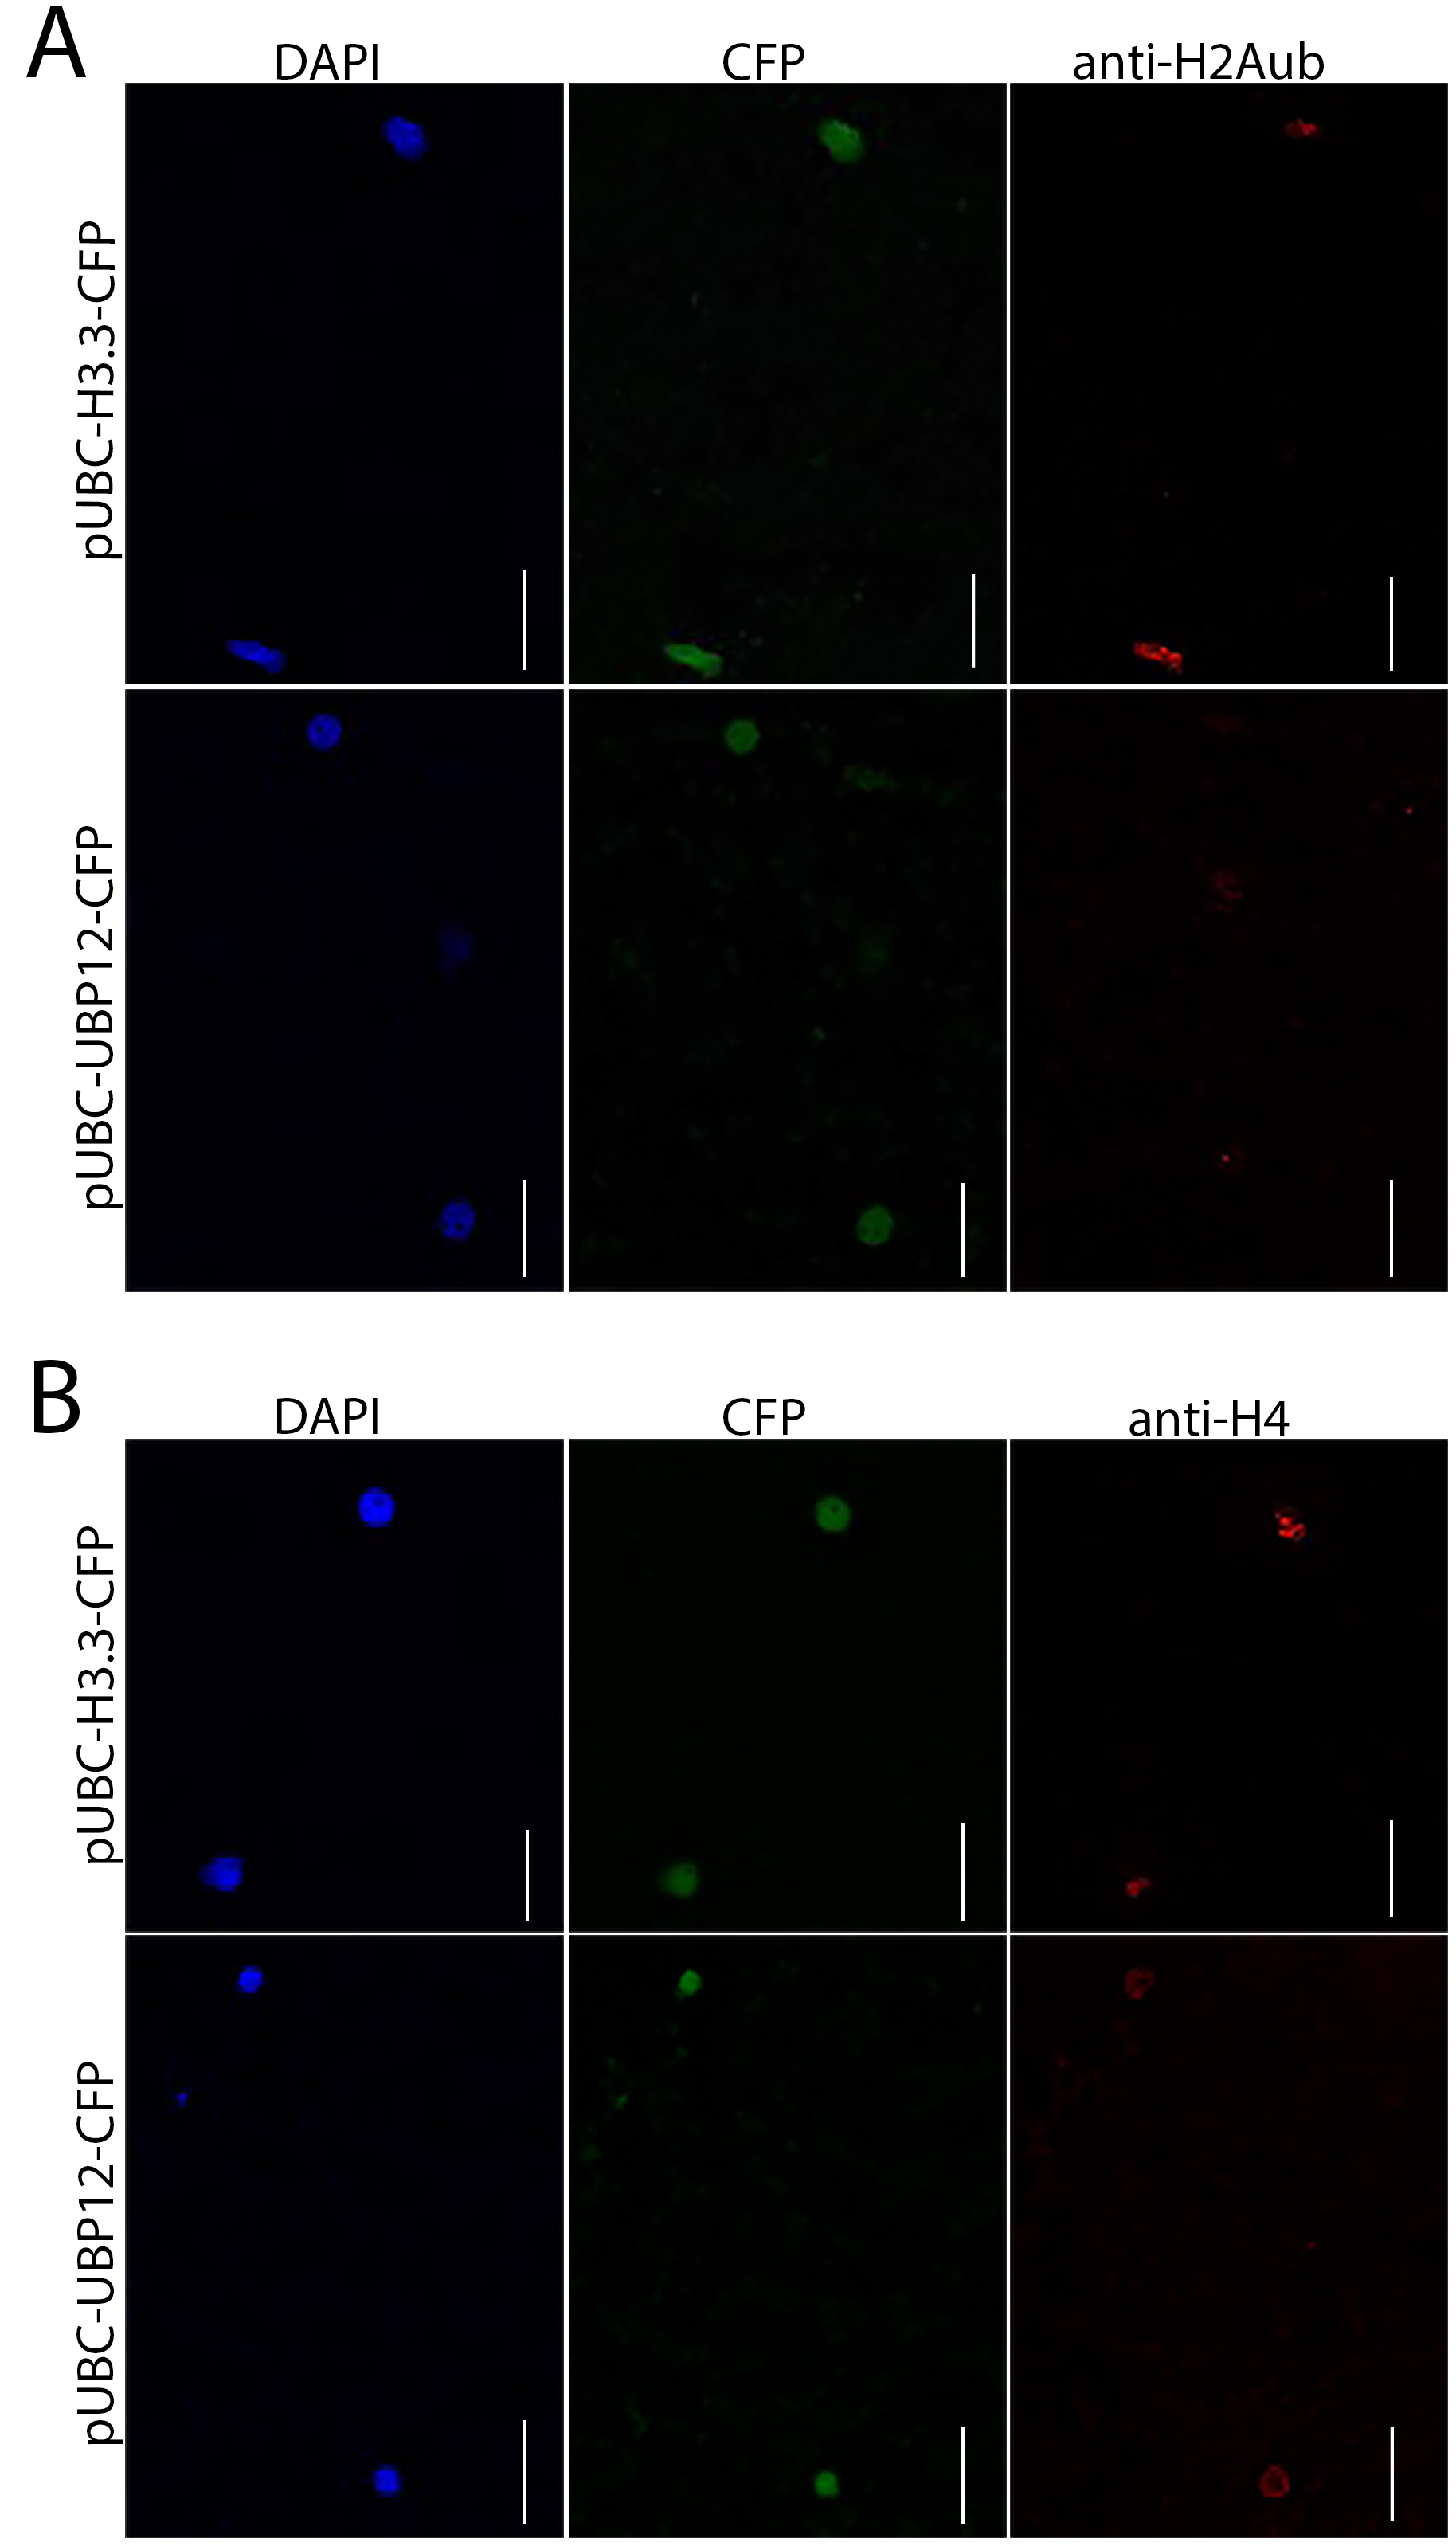
Figure 1. Examples of assay results–UBP12 has deubiquitinase activity. A. Infiltration of pUBC-UBP12-CFP but not of pUBC-H3.3-CFP reduced H2A ubiquitylation in N. benthamiana leaves. B. Infiltration of either pUBC-H3.3-CFP or pUBC-UBP12-CFP did not affect H4 signals in N. benthamiana leaves. Scale bars = 30 µm.
Data analysis
Check several fields containing together at least 50 nuclei for statistical analysis. Choose fields with similar background signal because some regions on the slide may have high background from inadequate rinsing. Figure 2 shows a strategy for quantitative analysis of assay results.
Look for nuclei by DAPI signal (Figures 1A and 1B, left panel) and use the CFP signal to select nuclei that were successfully transfected with pUBC-H3.3-CFP (control construct) or pUBC-UBP12-CFP (test construct) (Figures 1A and 1B, center panel). Compare transfection rates (Figure 2A); ideally, transfection rates should be similar for control and test constructs. Count the number of nuclei with fluorescent signals for H2Aub or H4 (Figures 1A and 1B, right panel). Detection efficiency of immunocytochemistry can be expressed as number of H4-positive nuclei as percentage of all transfected nuclei (Figure 2B). Similar values indicate that the detection process (fixing, staining, washing etc.) was comparable for control and test constructs. The effects of control and test constructs on target PTM can be seen in a comparison of the percentages of PTM-positive nuclei after transfection (Figure 2C). Smaller values for the test than for the control construct indicate that the test construct specifically reduced the target PTM. An alternative display is to compare the relative frequencies of PTM-positive nuclei (Figure 2D). For this, the frequency of PTM-positive nuclei after transfection with the control construct is set as 1 and the frequency of PTM-positive nuclei after transfection with the test construct is expressed relative to it. A well-working test construct should affect the target PTM and thus show a relative frequency of PTM-positive nuclei < 1. This display directly shows the effect size of the transfected test construct and is recommended when transfection or detection rates differ; results should be compared across several experiments or when multiple test constructs are included.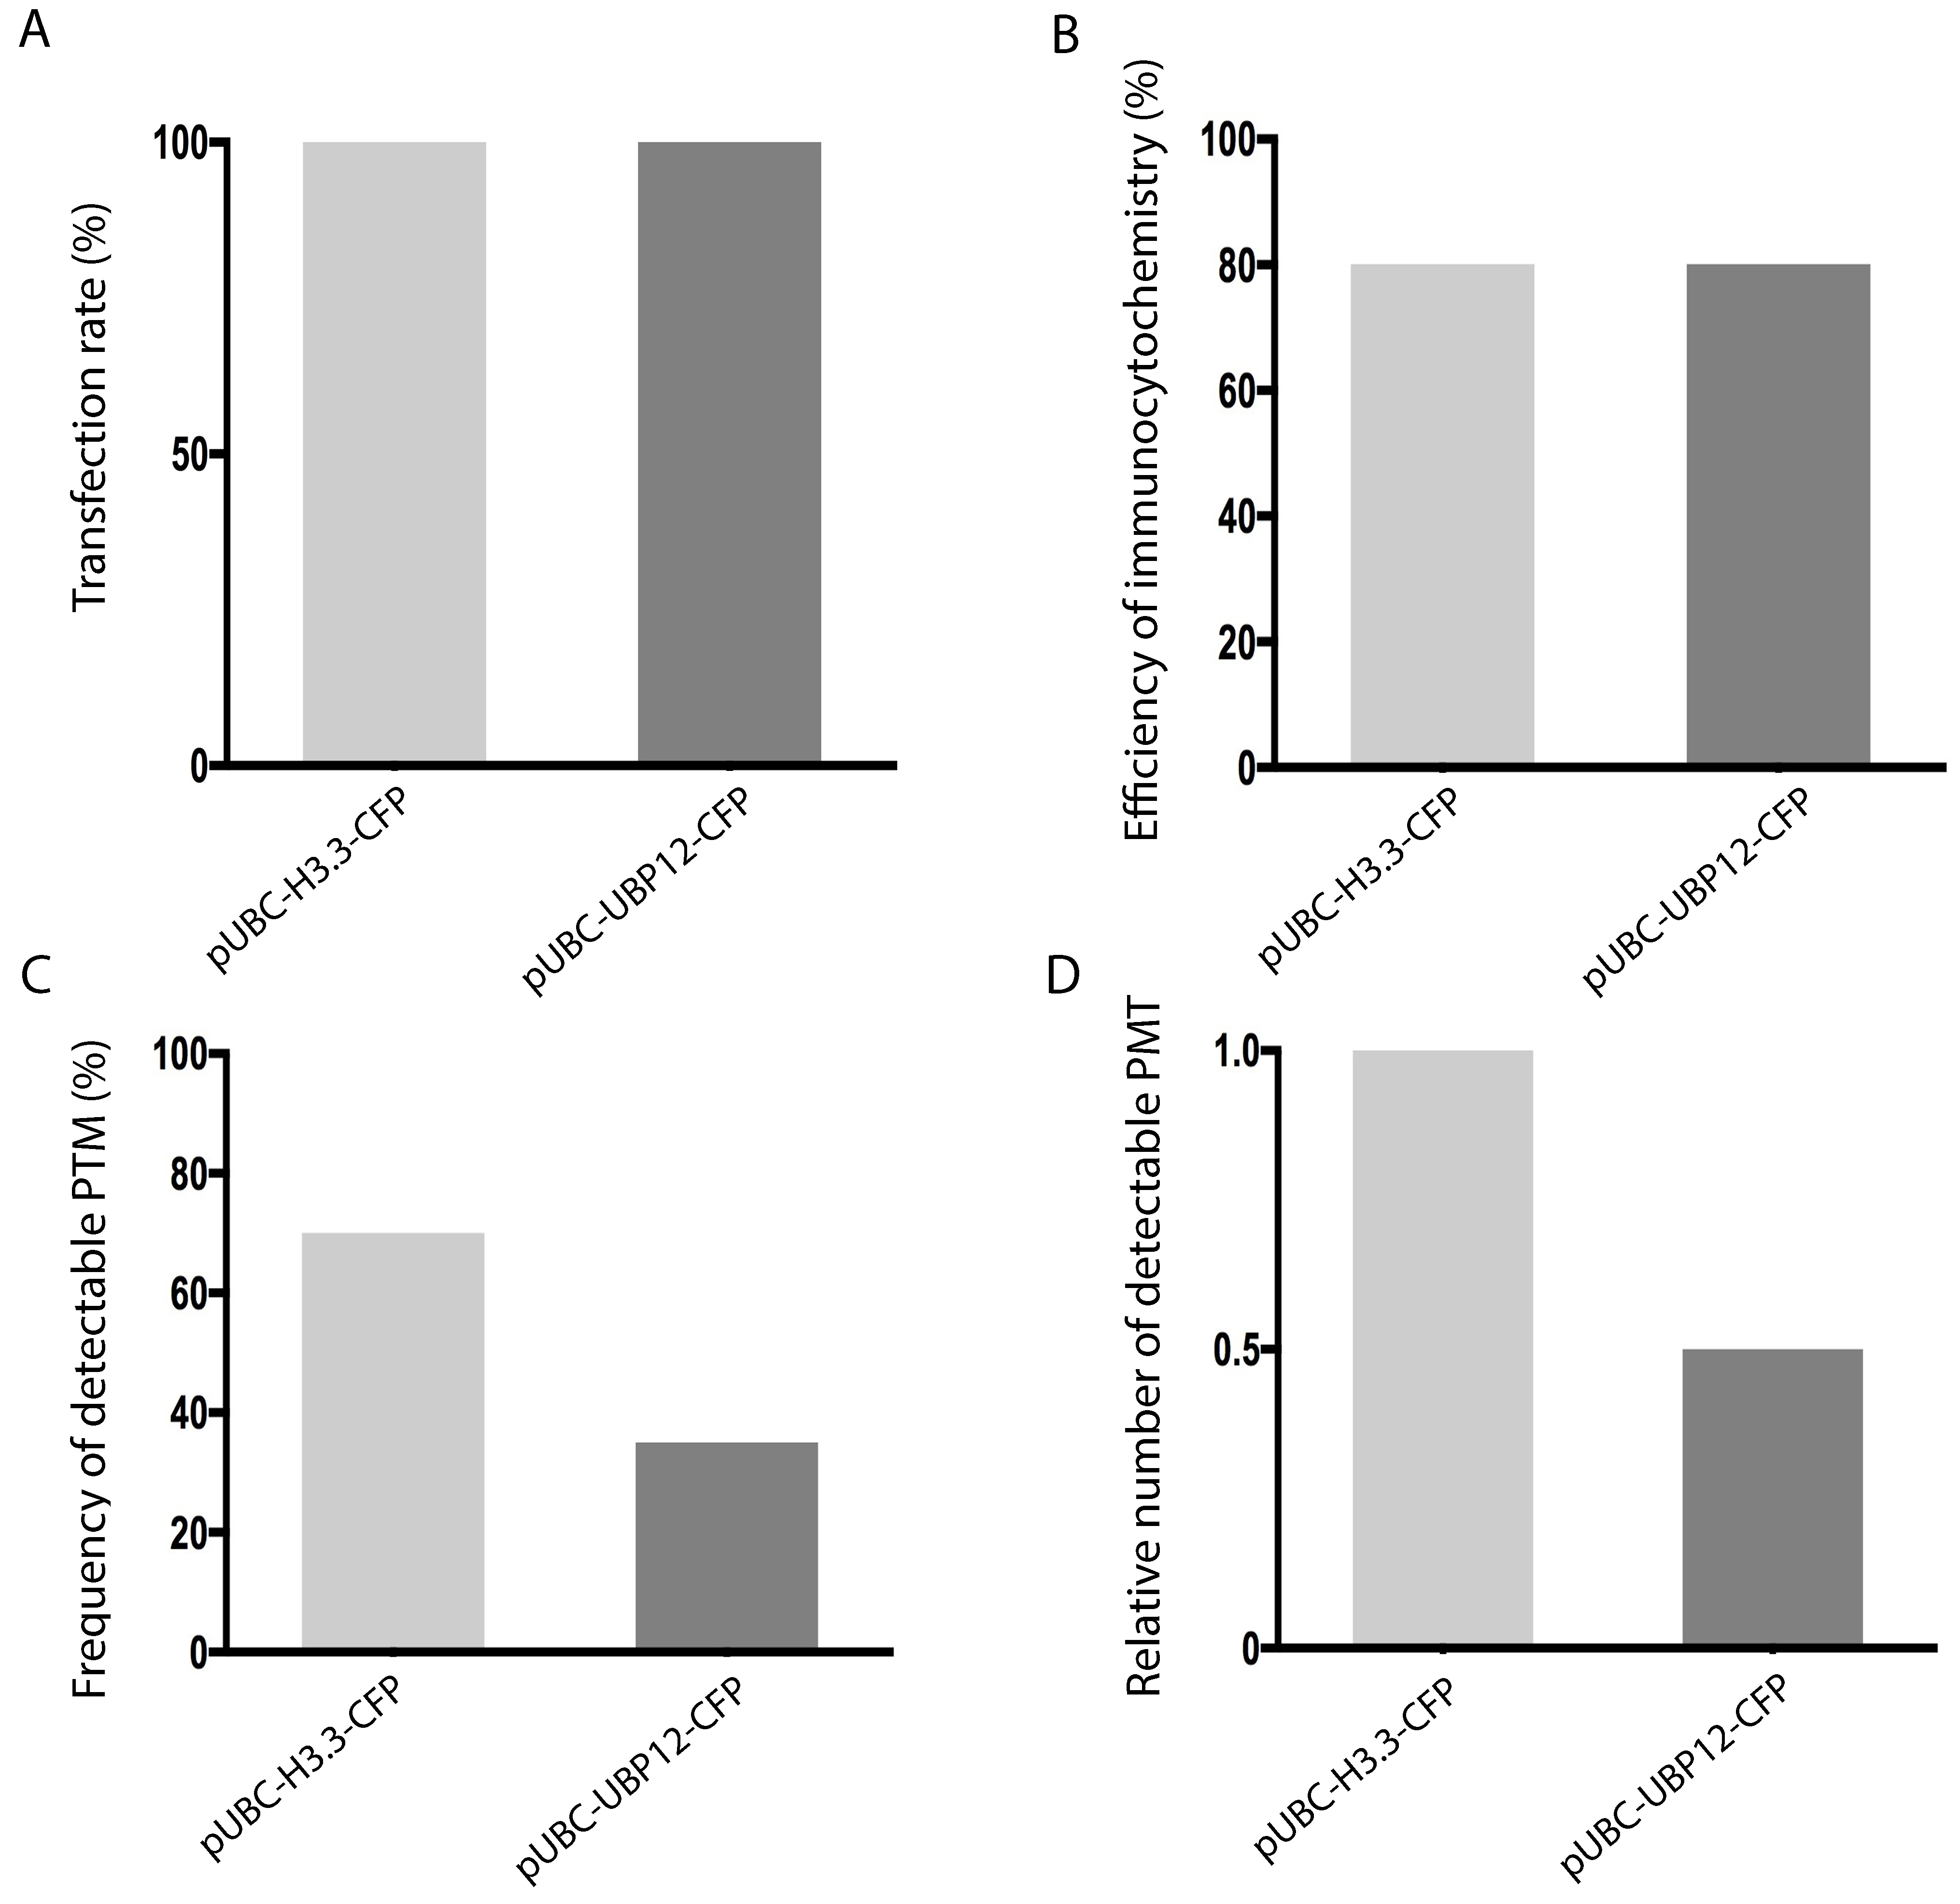
Figure 2. Strategy for quantitative analysis of assay results for a histone posttranslational modification (PTM; here: H2Aub). Control and test constructs (here: pUBC-H3.3-CFP and pUBC-UBP12-CFP) are represented by light grey and dark grey bars, respectively. A. Transfection rate, i.e., number of CFP-positive nuclei as percentage of all detected nuclei. Similar bar heights indicate similar transfection rates for control and test constructs. B. Detection efficiency of immunocytochemistry, i.e., number of H4-positive nuclei as percentage of all transfected nuclei. Similar bar heights indicate that the detection process (fixing, staining, washing etc.) was similar for control and test constructs. C. Effect of control and test construct on target PTM, i.e., number of PTM-positive nuclei as percentage of all transfected nuclei. Smaller values for the test than for the control construct indicate that the test construct specifically reduced the target PTM. D. Alternative display of the effect of control and test constructs on target PTM using relative frequencies. The frequency of PTM-positive nuclei transfected with the pUBC-H3.3-CFP control construct was set to 1 and the frequency of PTM-positive nuclei transfected with the pUBC-UBP12-CFP test construct expressed relative to this. A well-working test construct (here: pUBC-UBP12-CFP) should affect the target PTM and thus result in a relative intensity < 1.
Notes
- After air dry, white contents can be seen on the slides. The following steps are all performed on the slides. Make sure the liquid covers the white contents.
- Slides can be put in an empty pipette tip box to keep them moist.
- Image-iTTM FX signal enhancer is in the same kit with Alexa Fluor 555 conjugated goat anti-rabbit antibody. It is not intended for use with live cells.
- An empty pipette tip box with some water is used as a humid incubator.
- Check several times to make sure the antibody solution continuously covers nuclei, if not, add more antibody solution.
Recipes
- Infiltration medium (freshly prepared)
10 mM MES (pH 5.7)
10 mM MgCl2
150 μM acetosyringone - Tris buffer
10 mM Tris-HCl (pH 7.5) (see Recipe 3)
10 mM Na2-EDTA
100 mM NaCl - 1 M Tris-HCl (pH 7.5)
121 g Tris base in 1 L H2O
Adjust pH with 37% HCl - LB01 lysis buffer
15 mM Tris-HCl (pH 7.5)
2 mM Na2-EDTA
0.5 mM spermine
80 mM KCl
20 mM NaCl
0.1% Triton X-100 - PBS buffer
10 mM sodium phosphate (pH 7.0) (see Recipe 6)
143 mM NaCl - 1 M sodium phosphate (pH 7.0)
5.77 ml 1 M NaH2PO4
4.23 ml 1 M Na2HPO4
Acknowledgments
Seeds of N. benthamiana and the construct harboring viral RNA silencing suppressor p19 were kindly provided by E. Savenkov (SLU, Uppsala). This protocol was developed from the following published paper: Derkacheva et al. (2016). This work was supported by a grant from the Knut-and-Alice-Wallenberg Foundation. The authors declare no conflicts of interest or competing interests.
References
- Derkacheva, M., Liu, S., Figueiredo, D. D., Gentry, M., Mozgova, I., Nanni, P., Tang, M., Mannervik, M., Kohler, C. and Hennig, L. (2016). H2A deubiquitinases UBP12/13 are part of the Arabidopsis Polycomb group protein system. Nat Plants 2: 16126.
Article Information
Copyright
© 2018 The Authors; exclusive licensee Bio-protocol LLC.
How to cite
Liu, S. and Hennig, L. (2018). Histone Deubiquitination Assay in Nicotiana benthamiana. Bio-protocol 8(5): e2746. DOI: 10.21769/BioProtoc.2746.
Category
Plant Science > Plant biochemistry > Protein > Modification
Biochemistry > Protein > Modification
Do you have any questions about this protocol?
Post your question to gather feedback from the community. We will also invite the authors of this article to respond.