- Protocols

- Articles and Issues
- For Authors
- About
- Become a Reviewer

Chase Assay of Protein Stability in Haloferax volcanii


Published: Vol 7, Iss 6, Mar 20, 2017 DOI: 10.21769/BioProtoc.2186 Views: 7830
Reviewed by: Yanjie LiLyu XiaomeiHonghong Wu
Original research article
The authors used this protocol in:
May/Jun 2016
Advertisement


Protocol Collections
Comprehensive collections of detailed, peer-reviewed protocols focusing on specific topics


Related protocols
Abstract
Highly regulated and targeted protein degradation plays a fundamental role in almost all cellular processes. Determination of the protein half-life by the chase assay serves as a powerful and popular strategy to compare the protein stability and study proteolysis pathways in cells. Here, we describe a chase assay in Haloferax volcanii, a halophilic archaeon as the model organism.
Keywords: ArchaeaBackground
In eukaryotes, the ubiquitin proteasome system plays a major role in highly selective and targeted proteolysis (Glickman and Ciechanover, 2002). Recent evidence shows that small archaeal ubiquitin-like modifier proteins or SAMPs also function in targeting proteins for destruction by proteasomes (Maupin-Furlow, 2014; Anjum et al., 2015; Fu et al., 2016). Measurement of the protein half-life in vivo provides a direct way to study the proteolysis pathway. Cycloheximide chase and pulse-chase assays are commonly used to monitor the degradation of the targeted protein in eukaryotes (Zhou, 2004). The former method is utilized to determine the half-life of all cellular proteins after inhibition of translation elongation by cycloheximide; whereas, the pulse-chase assay measures the turnover of newly synthesized (pulse-labeled) proteins without interfering the normal cell growth. Compared with the eukaryotic system, a rapid and simple method to determine the half-life of a given protein in archaea is not well established. Therefore, we developed a protocol to measure the protein stability in vivo for the salt-loving archaeon Haloferax volcanii. Inhibitors of translation (anisomycin) and transcription (actinomycin D) are utilized to minimize the synthesis of new protein in this archaeon. TBP2, a TATA-binding protein (TBP) modified by ubiquitin-like isopeptide bonds in Haloferax volcanii, serves as the model protein substrate in this study.
Materials and Reagents
- Sterilized wooden stick
- Parafilm
- Zip-lock plastic bags
- 13 x 100 mm2 culture tubes (Fisher Scientific, catalog number: 14-961-27 )
- 1.5 ml microcentrifuge tube (Fisher Scientific, catalog number: 02-681-320 )
- Polyvinylidene difluoride (PVDF) membrane (GE Healthcare, catalog number: 10600023 )
- X-ray film (RPI, catalog number: 248300 )
- 2.0 ml microcentrifuge tube (Fisher Scientific, catalog number: 02-681-321 )
- Disposable plastic cuvettes (Fisher Scientific, catalog number: 149-551-27 )
- Gloves (Fisher Scientific, catalog number: 19-130-1597C )
- Rack LTS tips
‘P20’ 2-20 µl (Mettler-Toledo, Rainin, catalog number: 17001865 )
‘P200’ 20-200 µl (Mettler-Toledo, Rainin, catalog number: 17001863 )
‘P1000’ 100-1,000 µl (Mettler-Toledo, Rainin, catalog number: 17001864 ) - Sterile polystyrene disposable serological 10 ml pipets with magnifier stripe (Fisher Scientific, catalog number: 13-678-11E )
- Nalgene rapid-flow sterile disposable bottle top 0.2 µm filters with surfactant-free cellulose acetate (SFCA) membrane (Thermo Fisher Scientific, Thermo ScientificTM, catalog number: 290-3320 )
- Haloferax volcanii cells (parent and ubiquitin-like proteasome system mutants) carrying the reporter plasmid pJAM2201 encoding Flag-SAMP2 and TBP2-StrepII under control of the P2rrnA constitutive promoter. Plasmid pJAM202c served as the empty vector control. Please refer to strain and plasmid information published as Table S2 in (Fu et al., 2016)
- Glycerol (Sigma-Aldrich, catalog number: G5516 )
- Agar (Sigma-Aldrich, catalog number: A7002 )
- Novobiocin (Sigma-Aldrich, catalog number: N1628 )
- Actinomycin D (Sigma-Aldrich, catalog number: A1410 )
- Anisomycin (Sigma-Aldrich, catalog number: A9789 )
- Acetone (Sigma-Aldrich, catalog number: 650501 )
- Methanol (Fisher Scientific, catalog number: A413 )
- CDP-Star (Thermo Fisher Scientific, Molecular ProbesTM, catalog number: T2304 )
- Coomassie brilliant blue R-250 staining solution (Bio-Rad Laboratories, catalog number: 1610436 )
- Antibodies
- Anti-StrepII polyclonal antibody (in mouse) (QIAGEN, catalog number: 34850 )
- Goat anti-mouse IgG (whole molecule)-alkaline phosphatase-linked antibody (Sigma-Aldrich, catalog number: A5153 )
- Alkaline phosphatase-linked anti-Flag M2 monoclonal antibody (Sigma-Aldrich, catalog number: A9469 )
- Sodium chloride (NaCl) (Fisher Scientific, catalog number: S642-12 )
- Magnesium chloride hexahydrate (MgCl2·6H2O) (Fisher Scientific, catalog number: M35-12 )
- Potassium sulfate (K2SO4) (Fisher Scientific, catalog number: P304-3 )
- Calcium chloride dihydrate (CaCl2·2H2O) (Fisher Scientific, catalog number: C79-500 )
- Tryptone (BD, BactoTM, catalog number: 211705 )
- Yeast extract (BD, BBL, catalog number: 211929 )
- Deionized H2O
- Sodium hydroxide (NaOH) (Fisher Scientific, catalog number: BP359-212 )
- Magnesium sulfate heptahydrate (MgSO4·7H2O) (Fisher Scientific, catalog number: M63-3 )
- Potassium chloride (KCl) (Fisher Scientific, catalog number: P217-3 )
- Tris-base (Fisher Scientific, catalog number: BP152-1 )
- Sodium dodecyl sulfate (SDS) (Fisher Scientific, catalog number: BP166-500 )
- Glycine (Bio-Rad Laboratories, catalog number: 1610718 )
- β-mercaptoethanol (Sigma-Aldrich, catalog number: M6250 )
- Bromophenol blue (Sigma-Aldrich, catalog number: B5525 )
- Acrylamide (30%) (Fisher Scientific, catalog number: EC890450ML )
- ATCC974 medium (see Recipes)
- Concentrated salt water (SW) stock solution at 30% (w/v) (see Recipes)
- 2x SDS reducing buffer (see Recipes)
Equipment
- Incubator and shaker (42 °C) (Eppendorf, New Brunswick Scientific)
- SmartSpec Plus spectrophotometer (Bio-Rad Laboratories, catalog number: 1702525 )
Note: This product has been discontinued. - Centrifuge (Eppendorf, model: 5418 )
- Basic power supply (Bio-Rad Laboratories, catalog number: 1645050 )
- Refrigerator (4 °C) (Frigidare)
- Ultra-low temperature freezer (-80 °C) (Eppendorf, New BrunswickTM, model: C660-86 )
- Vortex mixer (Thermolyne, model: 37600 )
- Chemical fume hood (Siemens, catalog number: 537-473 )
- Pipettes (2-20 µl, 20-200 µl, 100-1,000 µl) (Rainin type LTS)
- pH meter (Corning, model: 320 )
- Scanner (Epson, model: 3170 Photo )
- Autoclave (Consolidated Sterilizer Systems, model: SR-24C-PB )
- Mini trans-blot module (Bio-Rad Laboratories, catalog number: 1703935EDU )
- Gel electrophoresis chamber (Bio-Rad Laboratories, catalog number: 1658005 )
- Konica X-ray film processor (Konica Minolta, model: QX60A )
- Electrophoresis systems autoradiography cassette (Fisher Scientific, FisherBiotech, model: FBXC810 )
- Siemens Vantage Reverse Osmosis Systems (M21 series, Siemens, model: M21R004EA ) with EVOQUA filters (Siemens, model: C1207098 ) and Atlantic Ultraviolet Germicidal UV Equipment (Siemens, model: MP49 ) (water purification system used for generating deionized water)
Software
- ImageJ (imagej.net/Particle_Analysis)
- Microsoft Excel (Microsoft Office 365 ProPlus)
Procedure
- Grow Haloferax volcanii cells to stationary phase (OD600 2.0-3.0) in ATCC974 medium and sterilely mix 1:1 with 40% (v/v) glycerol. Store the 20% (v/v) glycerol stock of cells at -80 °C (long-term).
- Inoculate the cells by taking a tip of the 20% (v/v) glycerol stock using a sterilized wooden stick and streaking for isolation onto a culture plate that has ATCC974 (described in Recipes section) medium supplemented with 2% (w/v) agar for solid medium and novobiocin (0.2 μg ml-1) to maintain the plasmid DNA. Wrap the plates with Parafilm and transfer to zip-lock plastic bags to prevent loss of moisture.
- Incubate the cells for around 100 h at 42 °C. Store the cells on the plates in the sealed bags at room temperature in the dark for up to 2 weeks.
- Inoculate isolated colonies of the Haloferax volcanii strains carrying plasmid pJAM2201 into 4 ml ATCC974 medium with novobiocin (0.2 μg ml-1). Grow the cells at 42 °C in liquid medium with rotary shaking at 200 rpm in 13 x 100 mm2 culture tubes.
- Monitor the growth of the cells at OD600 using the spectrophotometer. After around 20 h of incubation, the cells will reach log-phase (OD600 of 0.4-0.7). Normalize the log-phase cells by subculturing the cells to an OD600 of 0.06 in 5.1 ml of fresh ATCC974 medium (the added 0.1 ml of medium compensates for loss of culture volume during growth due to evaporation). Grow the cells in the liquid medium for 24 h to again reach log phase with rotary shaking at 200 rpm in 13 x 100 mm2 culture tubes at 42 °C.
- Determine the OD600 of the log-phase cells by using 0.2 ml of the cell culture and the spectrophotometer.
- Harvest the remaining cells by centrifugation (10,000 x g, 6 min, 25 °C) and resuspend the cell pellets by vortexing for 30 sec in 4.2 ml pre-warmed concentrated salt water solution (described in Recipes section) to a final OD600 of 0.7.
- Collect 1 ml of the cells as the 0 min sample. Treat the remaining cells with 20 μg ml-1 actinomycin D and 50 μg ml-1 anisomycin. Actinomycin D is added into the culture right after the addition of anisomycin. Grow cells with rotary shaking at 200 rpm in 13 x 100 mm2 culture tubes at 42 °C.
Note: Actinomycin D is dissolved in acetone to make a stock solution at 10 mg ml-1. Anisomycin is dissolved in methanol to make a stock solution at 20 mg ml-1. Actinomycin D and anisomycin tend to form some precipitants in high-salt buffer, vortex the solution to fully dissolve the antibiotics. - Transfer 1 ml of antibiotic-treated cells from the culture tube to a 1.5 ml microcentrifuge tube at various intervals (20, 40, 60 min). Immediately harvest the cells at each interval by centrifugation (10,000 x g, 6 min, 4 °C). Carefully remove the supernatant by pipetting as shown in Figure 1 without touching the cell pellets. Freeze the cell pellets at -80 °C before lysis.
Note: Vortex the solution in the culture tube for 10 sec right before transferring from the culture tube. The cell pellets are frozen at -80 °C for 1-3 h before further processing of the samples.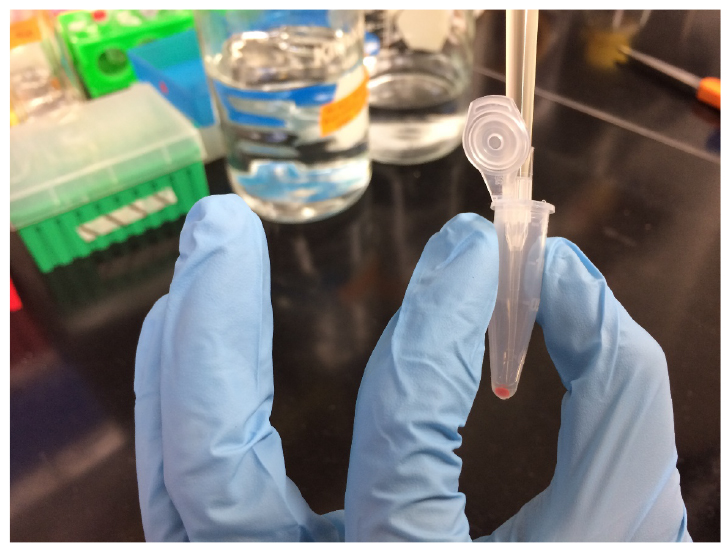
Figure 1. Image showing how to remove the supernatant without touching the cell pellets. Haloferax volcanii cells after centrifugation appear as red pellets. The authors recommend to put the small tip on top of the big tip when using a 1,000 μl pipette for pipetting. - Resuspend the harvested cells by up and down pipetting in SDS reducing buffer (described in the Recipes section). In this experiment, 1 ml cell culture is collected and ~0.07 OD600 units of cells are analyzed in 5 µl of sample by SDS-PAGE. Thus, the volume of the SDS reducing buffer is added at 71.4 (μl) times the OD600 of the cell pellet. Vol (SDS reducing buffer) (μl) = OD600 x Vol (harvested cell culture) (ml) x Vol (sample loaded on gel) (μl)/0.07.
- Boil the cell suspension 3 times (5 min each time with 30 sec vortex between each time).
- Analyze the sample (5 µl per lane) by SDS-PAGE and Western blotting following a regular protocol. Generally, proteins are separated by 12% SDS-PAGE and electroblotted onto PVDF membranes by wet transfer. Equivalent protein loading is determined by OD600 of cell culture (0.08 OD600 units per lane) and confirmed by staining parallel gels with Coomassie blue. Tbp2-StrepII is detected by mouse anti-StrepII polyclonal antibody (1:5,000 dilution) followed by goat anti-mouse IgG (whole molecule)-alkaline phosphatase-linked antibody (1:10,000 dilution). Flag-SAMP is detected by alkaline phosphatase-linked anti-Flag M2 monoclonal antibody (1:10,000 dilution). Targeted proteins on PVDF are visualized by chemiluminescence using CDP-Star with X-ray film according to the user guidelines.
- The X-ray films are scanned and the intensity of protein bands by Western blotting is quantified using ImageJ software.
Data analysis
Scan the region of X-ray film containing protein bands to produce a TIF file. Quantification of protein bands on the image is achieved by ImageJ software according to the user guidelines. Generally, purified TBP2 is used as the standard and a range of 0.5 ng to 50 ng protein serves as a range for the standard curve. Each TBP2 protein band is included in the same rectangle and the signal intensity reflected by the size of a peak is plotted. Details about quantification of protein by using ImageJ software can refer to (http://www.openwetware.org/wiki/Protein_Quantification_Using_ImageJ). Results are expressed as the percent change from time zero, which is set at 1.00. For example, measurement of the stability of TBP-StrepII and Flag-SAMP2 in the wild-type Haloferax volcanii strain by this chase assay has been published in mBio (Fu et al., 2016). Figure 2 for the representative data is originally published as Figure S2 by Fu et al. (2016).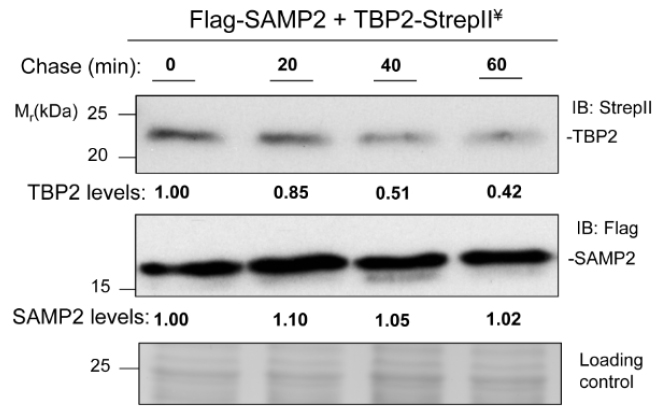
Figure 2. TBP2 degradation in wild-type strain. Chase assays were performed in the wild-type strain expressing Flag-SAMP2 and TBP2-StrepII. Log-phase cells were treated with 20 µg ml-1 actinomycin D and 50 µg ml-1 anisomycin for the indicated times and collected. TBP2 and SAMP2 protein levels were determined by anti-StrepII antibody and anti-Flag antibody, respectively. Equal loading was confirmed by CB staining. Experiments were performed in at least biological duplicates, and representative images are shown. ¥, coexpressed in trans. The dataset used in this figure was originally published in Fu et al. (2016).
Notes
Please note that the measure of TBP2 stability in this study was conducted when cells were grown in the standard culture condition. Knowing the environmental factors that trigger the turnover of targeted proteins and conducting the experiment in conditions where the targeted proteins are degraded will be highly recommended when other protein substrates are tested by this chase assay.
Recipes
- ATCC974 medium
- Dissolve 125 g NaCl, 50 g MgCl2·6H2O, 5 g K2SO4, 0.132 g CaCl2·2H2O, 5 g tryptone, and 5 g yeast extract in 750 ml deionized H2O. The medium will appear as a clear solution when all the chemicals are fully dissolved
- Adjust the pH of the solution to 6.8 by adding 0.5 N NaOH drop by drop
- Adjust the volume of the solution to 1 L final. Transfer the solution to 2 x 1 L glass media bottles (500 ml medium per bottle) and autoclave on the liquid cycle for 25 min
- Store medium at room temperature for up to 6 months.
- For growth of Haloferax volcanii strains carrying plasmid pJAM2201 (and the empty vector control pJAM202c), the ATCC974 medium is supplemented with novobiocin to a final concentration of 0.2 μg ml-1. The medium is cooled to room temperature prior to addition of the antibiotic and used immediately, as the antibiotic is sensitive to high temperature and light
- Dissolve 125 g NaCl, 50 g MgCl2·6H2O, 5 g K2SO4, 0.132 g CaCl2·2H2O, 5 g tryptone, and 5 g yeast extract in 750 ml deionized H2O. The medium will appear as a clear solution when all the chemicals are fully dissolved
- Concentrated salt water (SW) stock solution at 30% (w/v)
- Dissolve 240 g NaCl, 30 g MgCl2·6H2O, 35 g MgSO4·7H2O, and 7 g KCl in 650 ml deionized H2O
- Add 10 ml Tris-Cl (1 M, pH 7.5) to the solution to adjust the pH to 7.4
- Transfer the pH adjusted solution to a large, graduated cylinder, then top up with deionized H2O to a final volume of 1 L
- Filter-sterilize the solution using a sterile disposable 0.2 µm filter.
- Store the SW stock for up to 6 months at room temperature
- Dissolve 240 g NaCl, 30 g MgCl2·6H2O, 35 g MgSO4·7H2O, and 7 g KCl in 650 ml deionized H2O
- 2x SDS reducing buffer
100 mM Tris-Cl buffer at pH 6.8, 4% (w/v) SDS, 20% (v/v) glycerol, 0.6 mg ml-1 bromophenol blue, and 5% (v/v) β-mercaptoethanol
Acknowledgments
This work was funded by US Department of Energy, Office of Basic Energy Sciences, Division of Chemical Sciences, Geosciences and Biosciences, Physical Biosciences Program (DE-FG02-05ER15650), USDA National Institute of Food and Agriculture (Hatch 1005900), and NIH | National Institute of General Medical Sciences (NIGMS) (NIH R01 GM57498-15).
References
- Anjum, R. S., Bray, S. M., Blackwood, J. K., Kilkenny, M. L., Coelho, M. A., Foster, B. M., Li, S., Howard, J. A., Pellegrini, L., Albers, S. V., Deery, M. J. and Robinson, N. P. (2015). Involvement of a eukaryotic-like ubiquitin-related modifier in the proteasome pathway of the archaeon Sulfolobus acidocaldarius. Nat Commun 6: 8163.
- Fu, X., Liu, R., Sanchez, I., Silva-Sanchez, C., Hepowit, N. L., Cao, S., Chen, S. and Maupin-Furlow, J. (2016). Ubiquitin-like proteasome system represents a eukaryotic-like pathway for targeted proteolysis in archaea. MBio 7(3).
- Glickman, M. H. and Ciechanover, A. (2002). The ubiquitin-proteasome proteolytic pathway: destruction for the sake of construction. Physiol Rev 82(2): 373-428.
- Maupin-Furlow, J. A. (2014). Prokaryotic ubiquitin-like protein modification. Annu Rev Microbiol 68: 155-175.
- Zhou, P. (2004). Determining protein half-lives. Methods Mol Biol 284: 67-77.
Article Information
Copyright
© 2017 The Authors; exclusive licensee Bio-protocol LLC.
How to cite
Fu, X. and Maupin-Furlow, J. A. (2017). Chase Assay of Protein Stability in Haloferax volcanii. Bio-protocol 7(6): e2186. DOI: 10.21769/BioProtoc.2186.
Category
Microbiology > Microbial biochemistry > Protein > Immunodetection
Biochemistry > Protein > Degradation
Do you have any questions about this protocol?
Post your question to gather feedback from the community. We will also invite the authors of this article to respond.