- Protocols

- Articles and Issues
- For Authors
- About
- Become a Reviewer

Olfactory Habituation-dishabituation Test (Mouse)
Published: Vol 7, Iss 5, Mar 5, 2017 DOI: 10.21769/BioProtoc.2154 Views: 10537
Reviewed by: Soyun KimEhsan KheradpezhouhEdgar Soria-Gomez
Original research article
The authors used this protocol in:
Aug 2016

Protocol Collections
Comprehensive collections of detailed, peer-reviewed protocols focusing on specific topics


Abstract
Olfaction plays a fundamental role in the various behaviors such as feeding, mating, nursing, and avoidance in mice. Behavioral tests that characterize abilities of odor detection and recognition using genetically modified mice reveal the contribution of target genes to the olfactory processing. Here, we describe the olfactory habituation-dishabituation test for investigating the odor detection threshold in mice.
Keywords: OlfactionBackground
Olfactory system is a good model for studying the sensory processing in the brain. To characterize abilities of odor detection in genetically modified mice, the olfactory habituation-dishabituation test was performed using either filter paper or cotton scented with a test odor (Kobayakawa et al., 2007; Ferquson et al., 2000). There is a natural tendency of mice preferentially exploring novelty such as a novel odor and a novel object (Bevins and Besheer, 2006). Therefore, there is no training in advance before starting these tests. However, it is difficult to constantly supply the test odor especially at lower concentrations (around the detection threshold), because the odor is diluted by diffusion during the test. Here, we describe a method for the olfactory habituation-dishabituation test using an olfactometer. This method has an advantage in the point that mice are exposed to the odor at a constant concentration during the test, compared with that using the filter paper (Takahashi et al., 2016).
Materials and Reagents
- Latex gloves (NIPPON Genetics, catalog number: SLPF-M )
- Paper towels (KCWW, Kimberly-Clark, catalog number: 47000 )
- Filter tips
10 μl (FUKAEKASEI and WATSON, catalog number: 1252-207CS )
200 μl (FUKAEKASEI and WATSON, catalog number: 1252-703CS )
1,000 μl (FUKAEKASEI and WATSON, catalog number: 124-1000S ) - Laboratory-bred mice
Note: Mice are housed in groups 3-5 per cage, kept in a room with controlled temperature (~23 °C) and humidity under 12 h light/dark cycle (lights on at 8:30 AM) with ad libitum access to food and water. - Eugenol (6.3 M) (Nacalai Tesque, catalog number: 15806-42 )
- 70% ethanol
Equipment
- Olfactometer with two channels (Matsumi Kagaku Keisoku)
- Gas cylinder (normal air)
- Test cage (25 x 37 x 24 cm, polypropylene)
- Clear acrylic board (which can cover the roof of the test cage)
- Video camera (Sony, catalog number: HDR-CX560V )
Note: The mouse behavior is recorded under the weak-light condition. This model (Sony Nightshot Camcorder) is equipped with infrared-mode. - Tripod for camera
Note: The gas cylinder containing clean air is connected to the olfactometer. The olfactometer regulates the gas flow (0.5 L/min), and switches flow between clean air and air with an odor by passing the air through a bottle containing eugenol. The olfactometer, connected to the test cage (25 x 37 x 24 cm), can supply either the clean air or the odor through the gas port (0.5-mm diameter hole) on the wall (2-cm height). The roof of test cage is covered with clear acrylic board (Figure 1).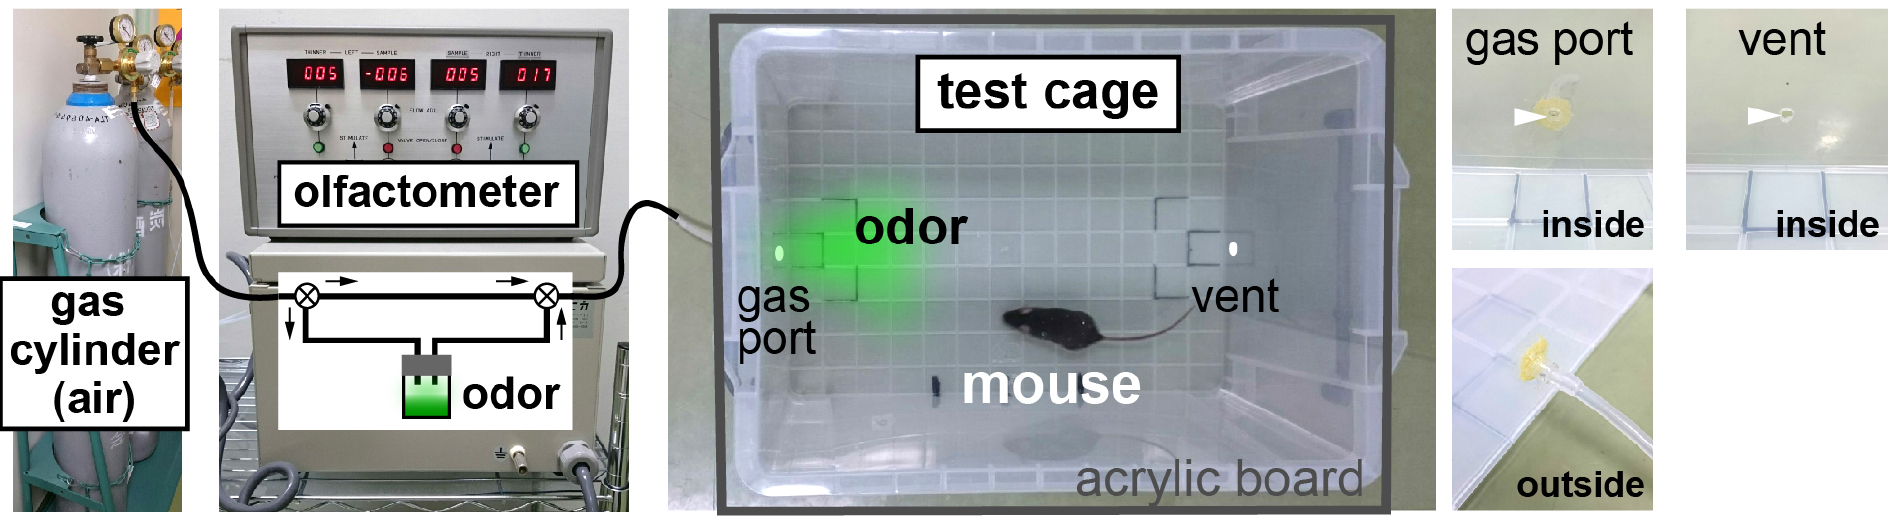
Figure 1. Apparatus of the olfactory habituation-dishabituation test
Software
- Microsoft Excel (Microsoft)
Procedure
- Before the test day
- For this test, mice should be used only once to avoid confounding of data, based on the learning and memory. During five days before the test, mice are habituated to the experimental condition. The same experimenter gently handles each mouse with latex gloves on for 10 min per day during the five consecutive days in the experimental room.
- For this test, mice should be used only once to avoid confounding of data, based on the learning and memory. During five days before the test, mice are habituated to the experimental condition. The same experimenter gently handles each mouse with latex gloves on for 10 min per day during the five consecutive days in the experimental room.
- On the test day
- Tests are done during the light phase of 12 h light/dark cycle in the test room, in which, the weak light (< 5 lux) is used for indirect lighting. Prepare a series of odor solutions diluted with deionized water (e.g., 10-4, 10-5, 10-6 and 10-7 in the case of eugenol), and set up the apparatus described in Equipment section in the test room (Figure 1).
- The mouse is transferred from their home cage to the test cage.
- Supply the clean air to the test cage, to which have been habituated for 15 min (Figure 2A; habituation). Because the mice often excrete their feces and urine several times in the test cage, especially in the beginning of habituation phase, clean the floor using paper towels every 5 min (three times) to prevent such odors from diffusion in the test cage.
- Continuously supply the clean air to the test cage for 3 min (Figure 2A; 1st trial). Record the mouse behavior with a digital video camera during the 1st and 2nd trials.
- Switch the air flow and the mice are exposed to the odor for 3 min (Figure 2A; 2nd trial).
- The tested mouse is returned to their home cage. Carefully clean the test cage using paper towels with 70% ethanol. Supply the clean air for 5 min to the test cage to clear the odor from the connecting tube between the olfactometer and test cage. Start the next test using another mouse.
- The recorded videos are analyzed, as described below.
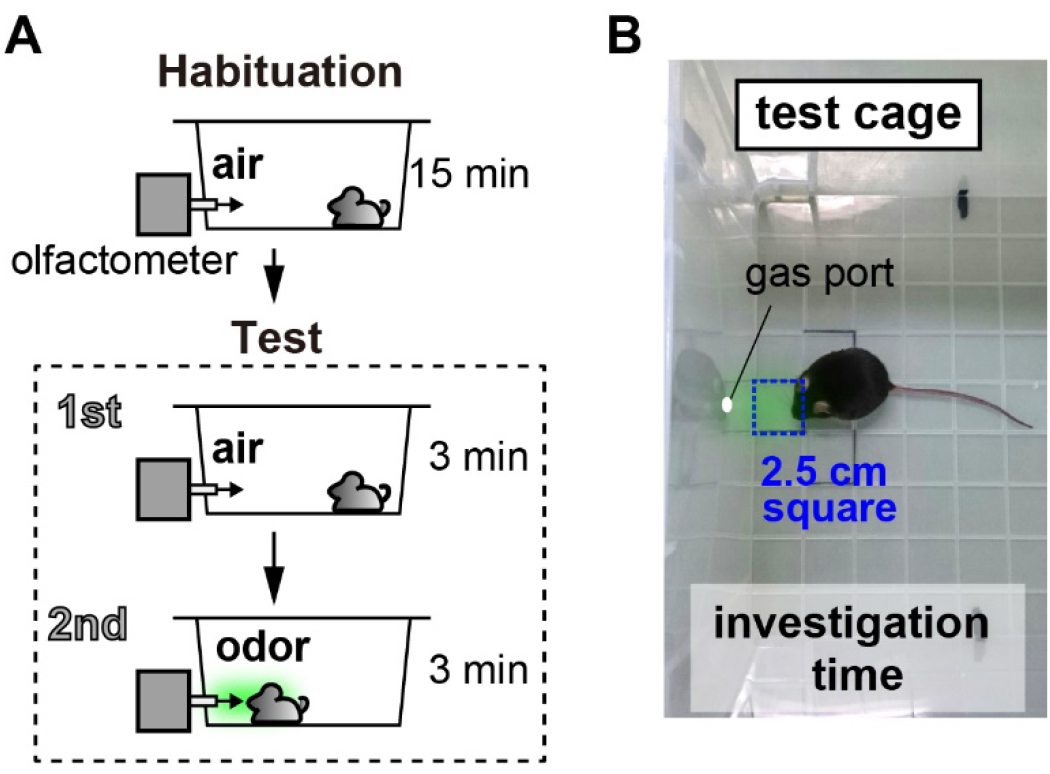
Figure 2. Schema of the experimental procedure. A. Schema of the experimental procedure; B. Investigation time is defined as the time when the nose entered the 2.5-cm square area near the gas port (blue dotted line).
- Tests are done during the light phase of 12 h light/dark cycle in the test room, in which, the weak light (< 5 lux) is used for indirect lighting. Prepare a series of odor solutions diluted with deionized water (e.g., 10-4, 10-5, 10-6 and 10-7 in the case of eugenol), and set up the apparatus described in Equipment section in the test room (Figure 1).
Data analysis
Investigation times in the 1st and 2nd trials are measured manually during the 3-min test using the recorded videos. ‘Investigation time’ is defined as the time when the nose enters the 2.5-cm square area near the gas port (Figure 2B and Video 1). We recommend that the investigation times are measured by blinded analysis. Differences in investigation times between the 1st trial and 2nd trial are calculated as the mean ± SEM (Figures 3A and 3B).
P-values are calculated by Welch t-test using Microsoft Excel, in which you click Data Analysis and perform t-test: Two-Sample Assuming Unequal Variances. For multiple pairwise comparisons, P-values are then sequentially evaluated according to the Holm-Bonferroni method (Holm, 1979) to keep an experiment-wise α ≤ 0.05, manually.
The formula to evaluate the Holm-Bonferroni method is as follows:
α/(n - k + 1)
Where,
n: number of tests,
k: rank number of pair.
Example for the Holm-Bonferroni correction:
Consider four null hypotheses (H1-4) with unadjusted P-values (p1-4), to be tested at significance level α = 0.05. H1: p1 = 0.01, H2: p2 = 0.005, H3: p3 = 0.03, H4: p4 = 0.04
- Order the P-values from smallest to largest.
p2 (= 0.005) < p1 (= 0.01) < p3 (= 0.03) < p4 (= 0.04) - To calculate the adjusted alpha level, work the Holm-Bonferroni formula for the first rank, and compare it with the first-ranked P-value (p2). If the P-value is smaller, reject the first-ranked null hypothesis (H2).
α/(n - k + 1) = 0.05/(4 - 1 + 1) = 0.0125
0.0125 > p2 (= 0.005). H2 is rejected. - Repeat the Holm-Bonferroni formula for the second rank, and compare it with the second-ranked P-value (p1).
α/(n - k + 1) = 0.05/(4 - 2 + 1) = 0.0167
0.0167 > p1 (= 0.01). H1 is rejected. - Repeat the Holm-Bonferroni formula for the third rank, and compare it with the third-ranked P-value (p3).
α/(n - k + 1) = 0.05/(4 - 3 + 1) = 0.0250
0.0250 < p3 (= 0.03). H3 is not rejected. - The testing stops when you reach the first non-rejected hypothesis. All subsequent hypotheses are non-significant. We conclude that H1 and H2 are rejected and H3 and H4 are not rejected.
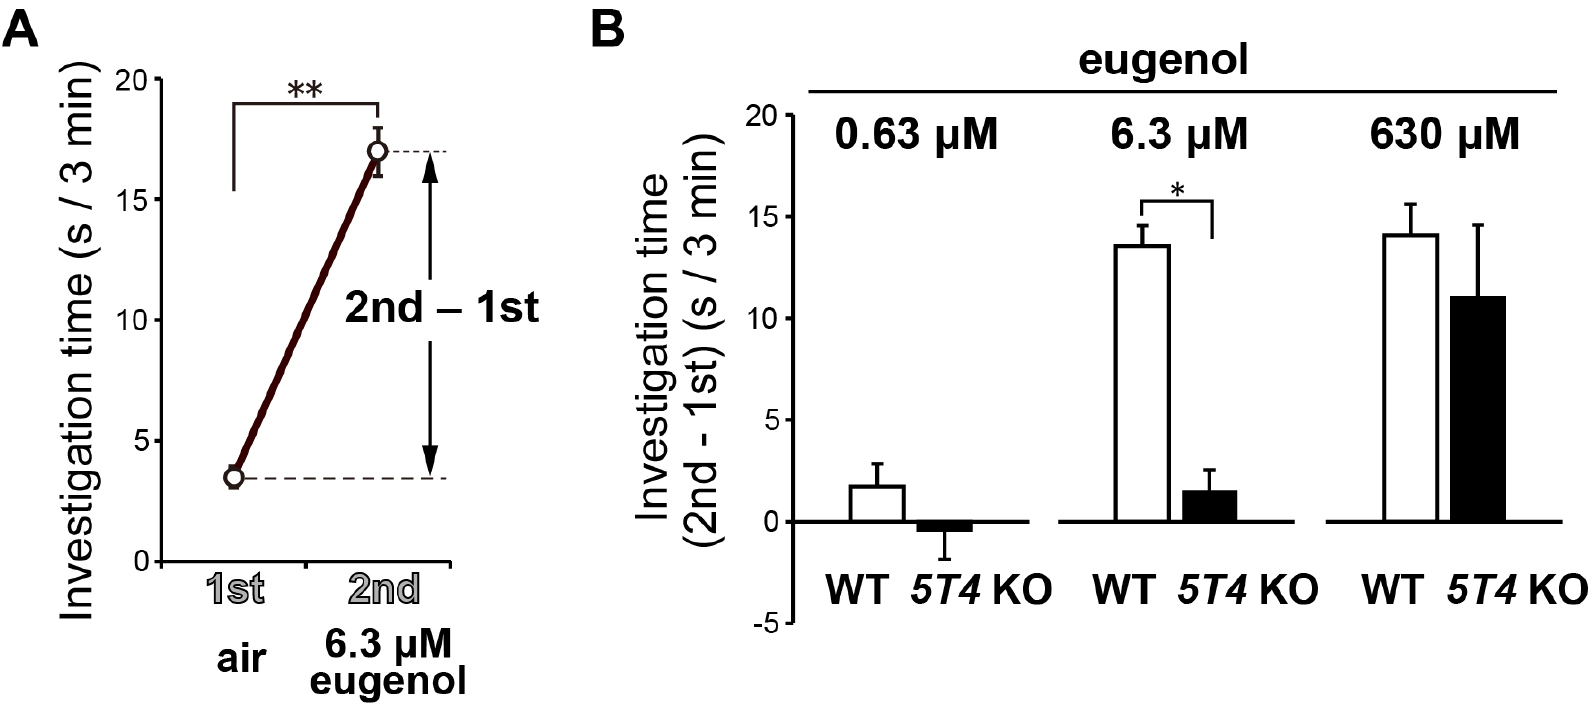
Figure 3. Sample data of the habituation-dishabituation test. A. Investigation time in the 1st and 2nd trials using 6.3 μM eugenol in wild-type mice. B. Differences in investigation times between the 1st and 2nd trials using different concentrations of eugenol in wild-type mice and 5T4 knockout (KO) mice, in which the 5T4 coding region was replaced by LacZ (Southgate et al., 2010). A single-pass transmembrane glycoprotein, 5T4, is known to regulate the dendritic development of olfactory bulb interneurons. At 6.3 μM, the investigation time of 5T4 KO mice was remarkably shorter than that of wild-type mice. These results suggest that a subset of olfactory bulb interneurons is required for the odor detection behavior (see the detail in Takahashi et al., 2016).
 Video 1. Response of wild-type mice to 6.3 μM eugenol
Notes
- For the test, male mice should be used to avoid the effect of the estrous cycle.
- The experimenter must restrict from wearing odorant products with strong smell and from making any excessive noise during the test. Because it is difficult to completely remove the personal smell from the experimenter, we recommend that the same experimenter, who handles the mice for the habituation before the test, performs all the processes throughout the test.
- It is important to prevent the odor diffusion in the test room, because the undiluted odor is used in this test. Prepare a series of odor solutions with dilutions outside the test room using filter tips (Procedure, step B1). In the test, a low concentration of eugenol should be used first, compared with the high concentration.
- The existence of experimenter affects the mouse behaviors in no small way. The experimenter must depart enough from the test cage. We recommend that when the test phase starts in the dedicated test room, the experimenter gets out there.
Acknowledgments
This protocol was modified from a previous study (Kobayakawa et al., 2007). This work was supported by Grants-in-Aid for Scientific Research on (B) (A.T.), (C) (H.T.), and Innovative Areas (Adaptive circuit shift) (A.T.), and for Challenging Exploratory Research (A.T.) from the Ministry of Education, Culture, Sports, Science and Technology (MEXT), Japan.
References
- Bevins, R. A. and Besheer, J. (2006). Object recognition in rats and mice: a one-trial non-matching-to-sample learning task to study ‘recognition memory’. Nat Protoc 1(3): 1306-1311.
- Ferguson, J. N., Young, L. J., Hearn, E. F., Matzuk, M. M., Insel, T. R. and Winslow, J. T. (2000). Social amnesia in mice lacking the oxytocin gene. Nat Genet 25(3): 284-288.
- Holm, S. (1979). A simple sequentially rejective multiple test procedure. Scand J Statist 6(2): 65–70.
- Kobayakawa, K., Kobayakawa, R., Matsumoto, H., Oka, Y., Imai, T., Ikawa, M., Okabe, M., Ikeda, T., Itohara, S., Kikusui, T., Mori, K. and Sakano, H. (2007). Innate versus learned odour processing in the mouse olfactory bulb. Nature 450(7169): 503–508.
- Southgate, T. D., McGinn, O. J., Castro, F. V., Rutkowski, A. J., Al-Muftah, M., Marinov, G., Smethurst, G. J., Shaw, D., Ward, C. M., Miller, C. J. and Stern, P. L. (2010). CXCR4 mediated chemotaxis is regulated by 5T4 oncofetal glycoprotein in mouse embryonic cells. PLoS One 5(4): e9982.
- Takahashi, H., Ogawa, Y., Yoshihara, S., Asahina, R., Kinoshita, M., Kitano, T., Kitsuki, M., Tatsumi, K., Okuda, M., Tatsumi, K., Wanaka, A., Hirai, H., Stern, P. L. and Tsuboi, A. (2016). A subtype of olfactory bulb interneurons is required for odor detection and discrimination behaviors. J Neurosci 36(31): 8210–8227.
Article Information
Copyright
© 2017 The Authors; exclusive licensee Bio-protocol LLC.
How to cite
Readers should cite both the Bio-protocol article and the original research article where this protocol was used:
- Takahashi, H. and Tsuboi, A. (2017). Olfactory Habituation-dishabituation Test (Mouse). Bio-protocol 7(5): e2154. DOI: 10.21769/BioProtoc.2154.
-
Takahashi, H., Ogawa, Y., Yoshihara, S., Asahina, R., Kinoshita, M., Kitano, T., Kitsuki, M., Tatsumi, K., Okuda, M., Tatsumi, K., Wanaka, A., Hirai, H., Stern, P. L. and Tsuboi, A. (2016). A subtype of olfactory bulb interneurons is required for odor detection and discrimination behaviors. J Neurosci 36(31): 8210–8227.
Category
Neuroscience > Behavioral neuroscience > Cognition
Do you have any questions about this protocol?
Post your question to gather feedback from the community. We will also invite the authors of this article to respond.