- Protocols

- Articles and Issues
- For Authors
- About
- Become a Reviewer

Visualising Differential Growth of Arabidopsis Epidermal Pavement Cells Using Thin Plate Spline Analysis


Published: Vol 6, Iss 22, Nov 20, 2016 DOI: 10.21769/BioProtoc.2022 Views: 8736
Reviewed by: Renate WeizbauerHarrie van ErpPengpeng Li
Original research article
The authors used this protocol in:

Sep 2015
Advertisement


Protocol Collections
Comprehensive collections of detailed, peer-reviewed protocols focusing on specific topics


Related protocols
Abstract
Epidermal pavement cells in Arabidopsis leaves and cotyledons develop from relatively simple shapes to form complex cells that have multiple undulations of varying sizes. Analyzing the growth of individual parts of the cell wall boundaries over time is essential to understanding how pavement cells develop their complex shapes. Thin plate spline analysis is a method for visualizing the change of size and shape of objects through warping or deformation of a regular mesh and can be applied to understand cell wall growth. This protocol describes the application of thin plate spline analysis to visualize the development of individual pavement cells over time.
Background
Understanding the spatial pattern of growth of a cell provides insight into how plant cells form different shapes. Epidermal pavement cells of Arabidopsis thaliana cotyledons and leaves are a good model system for investigating how complex cells grow as their cell wall boundaries develop multiple undulations of different size from boundaries that were initially simple arcs (Armour et al., 2015; Fu et al., 2005). Growth of plant cells has been measured by fixing externally applied markers to cells such as algal Nitella internodes (Green et al., 1970), root cells (Shaw et al., 2000), and trichomes (Schwab et al., 2003). However measurement of cell growth from externally applied landmarks is sometimes not feasible such as when the strong fluorescence of externally applied fluorescent markers would obscure fluorescently labeled cytoskeletal elements within cells (Armour et al., 2015). Thin plate spline analysis which visualizes the changing positions of a defined number of homologous landmarks over time or between different objects has previously been used to analyze changes in the three dimensional size and shape of objects such as hominid skulls (Rosas and Bastir, 2002; Gunz et al., 2009), or the two dimensional shapes of insect wings (Börstler et al., 2014) and leaves (Polder et al., 2007). This protocol describes how to use thin plate spline analysis to visualize size and shape changes of individual cells. This technique is relatively easy to utilize on a range of cell images as it uses the input of the outline of a cell at sequential times to approximate the relative growth rate and growth direction of different areas of the cell wall.
Materials and Reagents
- Petri dish (35 x 10 mm) (SARSTEDT, catalog number: 82.1135.500 )
- 3M Micropore surgical tape 1.25 cm (3M, catalog number: 1530-0 )
- Wildtype Arabidopsis thaliana (Col-0) seeds
- Sodium hypochlorite solution (White King Premium Bleach, Woolworths, catalog number: 10006062A )
- Sterile distilled water
- Murashige and Skoog salts (Sigma-Aldrich, catalog number: M5519 )
- Sucrose (Sigma-Aldrich, catalog number: S8501 )
- OxoidTM bacteriological agar (Thermo Fisher Scientific, Thermo ScientificTM, catalog number: LP0011 )
- 1 µM solution of 3 kDa fluorescein conjugated dextran (Thermo Fisher Scientific, Molecular ProbesTM, catalog number: D3305 )
Equipment
- Sterile laminar flow hood
- Zeiss Axiophot photomicroscope (D-7082) with filter set (BP 450-490 FT 510 BP 515-565, Carl Zeiss, catalog number: 487910 )
- A 20x LD Achroplan lens with a N.A. of 0.4 (Carl Zeiss, catalog number: 421350-9970-000 [current version]; 440845-0000-000 [old version])
- an Olympus microscope digital camera (OLYMPUS, model: DP71 )
- Plant growth chamber, set at 22 °C, on a 16-h-day:8-h-night cycle
- P10, 0.5-10 μl pipette (Eppendorf, catalog number: 4920000024 )
Software
- ImageJ (available at http://imagej.nih.gov.ij)
- ImageJ macros and lookup tables (https://en-cdn.bio-protocol.org/attached/file/20161017/20161017210148_3943.rar)
- 0WillRainbow.lut
- Add-Points-From-TPSlist-To-ROImanager_.ijm
- BranchInfo-to-ROI-lines-overlay_.ijm
- Formatted-Points-List-To-ROImanager_.ijm
- TPS-rel-expansion-prepare_.ijm
- TPS-rel-expansion-format_.ijm
- ImageJ plugins
- Stack Focuser (available at http://imagej.nih.gov/ij/plugins/stack-focuser.html)
- ImageJ macros and lookup tables (https://en-cdn.bio-protocol.org/attached/file/20161017/20161017210148_3943.rar)
- tpsDig2 (available at http://life.bio.sunysb.edu/morph/)
- PAST (available at http://folk.uio.no/ohammer/past/)
- Plaintext editor (e.g., Notepad++ on Windows, TextEdit on Mac OSX or gedit on Linux)
Procedure
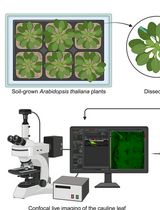
- Growing and imaging Arabidopsis seedlings
- Germinate wild-type Arabidopsis thaliana Col-0 seeds in vitro on 35 mm diameter Petri dishes
- Sterilize seeds in 1% sodium hypochlorite for 10 min and then rinse with sterile distilled water three times.
- Three seeds are then placed in a single line onto Petri dishes prepared using 1x Murashige and Skoog salts, 1% sucrose and 0.8% bacteriological agar, sealed with surgical tape, then kept at 4 °C for 24 h to stratify the seeds.
- Transfer Petri dishes into a plant growth room at 22 °C, on a 16-h-day:8-h-night cycle. Petri dishes should sit flat so that the roots grow downwards into the agar, rather than be positioned vertically. Monitor seeds for signs of germination.
- Sterilize seeds in 1% sodium hypochlorite for 10 min and then rinse with sterile distilled water three times.
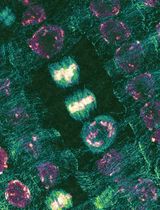
- At 1 day after germination, check that a cotyledon from one of the three seeds has unfurled and, in a sterile laminar flow hood, gently place about 0.5 μl of a 1 µM 3 kDa fluorescein conjugated dextran onto the adaxial cotyledon surface using a pipette. Wait 5 min for the dextran to dry.
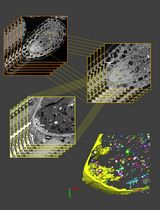
- Image epidermal pavement cells on a Zeiss Axiophot photomicroscope and collect a series of images at different focal planes to convert into 2D cell projections.
- Place Petri dish directly on the stage of a Zeiss Axiophot photomicroscope with the lid removed.
- Capture images of the epidermal pavement cells using a series of incremental focal planes with a blue fluorescent light filter and a 20x LD Achroplan objective lens. It is recommended to capture between 5-15 slices per cell at an interval spacing of 0.5-1 µm.
- After imaging, rinse cotyledons using a pipette and sterile distilled water then return seedlings to the plant growth room.
- Open the saved image series in ImageJ and create a 2D projection of the epidermal pavement cells using the Stack Focuser plugin. Save 2D projection as a TIFF.
- Place Petri dish directly on the stage of a Zeiss Axiophot photomicroscope with the lid removed.
- Repeat steps A2-A3 at 24 and 48 h after initial imaging.
- Germinate wild-type Arabidopsis thaliana Col-0 seeds in vitro on 35 mm diameter Petri dishes
- Extracting coordinates from cell outlines
- Using a program such as ImageJ or Adobe Photoshop, create an outline of the cell at one time point by tracing the anticlinal walls of the cell using a black pencil tool. Make sure to include a small region of walls of neighboring cells (branches). Copy this black outline onto on a new TIFF image with a white background (Figure 1A).
- Open a cell outline image in ImageJ ensuring it appears as a white outline on a black background and the scale is set on the image so it is calibrated. Skeletonize the outline using the Skeletonize command to produce a one pixel wide outline of the cell (Figure 1B).
- Perform a skeleton analysis using the command ‘Analyze Skeleton 2D/3D’ with options ‘Prune ends’ and ‘Show detailed info’ selected to calculate the individual anticlinal wall lengths between the wall junctions (Figures1B-1D). Save the ‘Branch Information’ table, invert the image that has the branches pruned to get a black outline on white background (Figure 1C) and save this image as a TIFF.
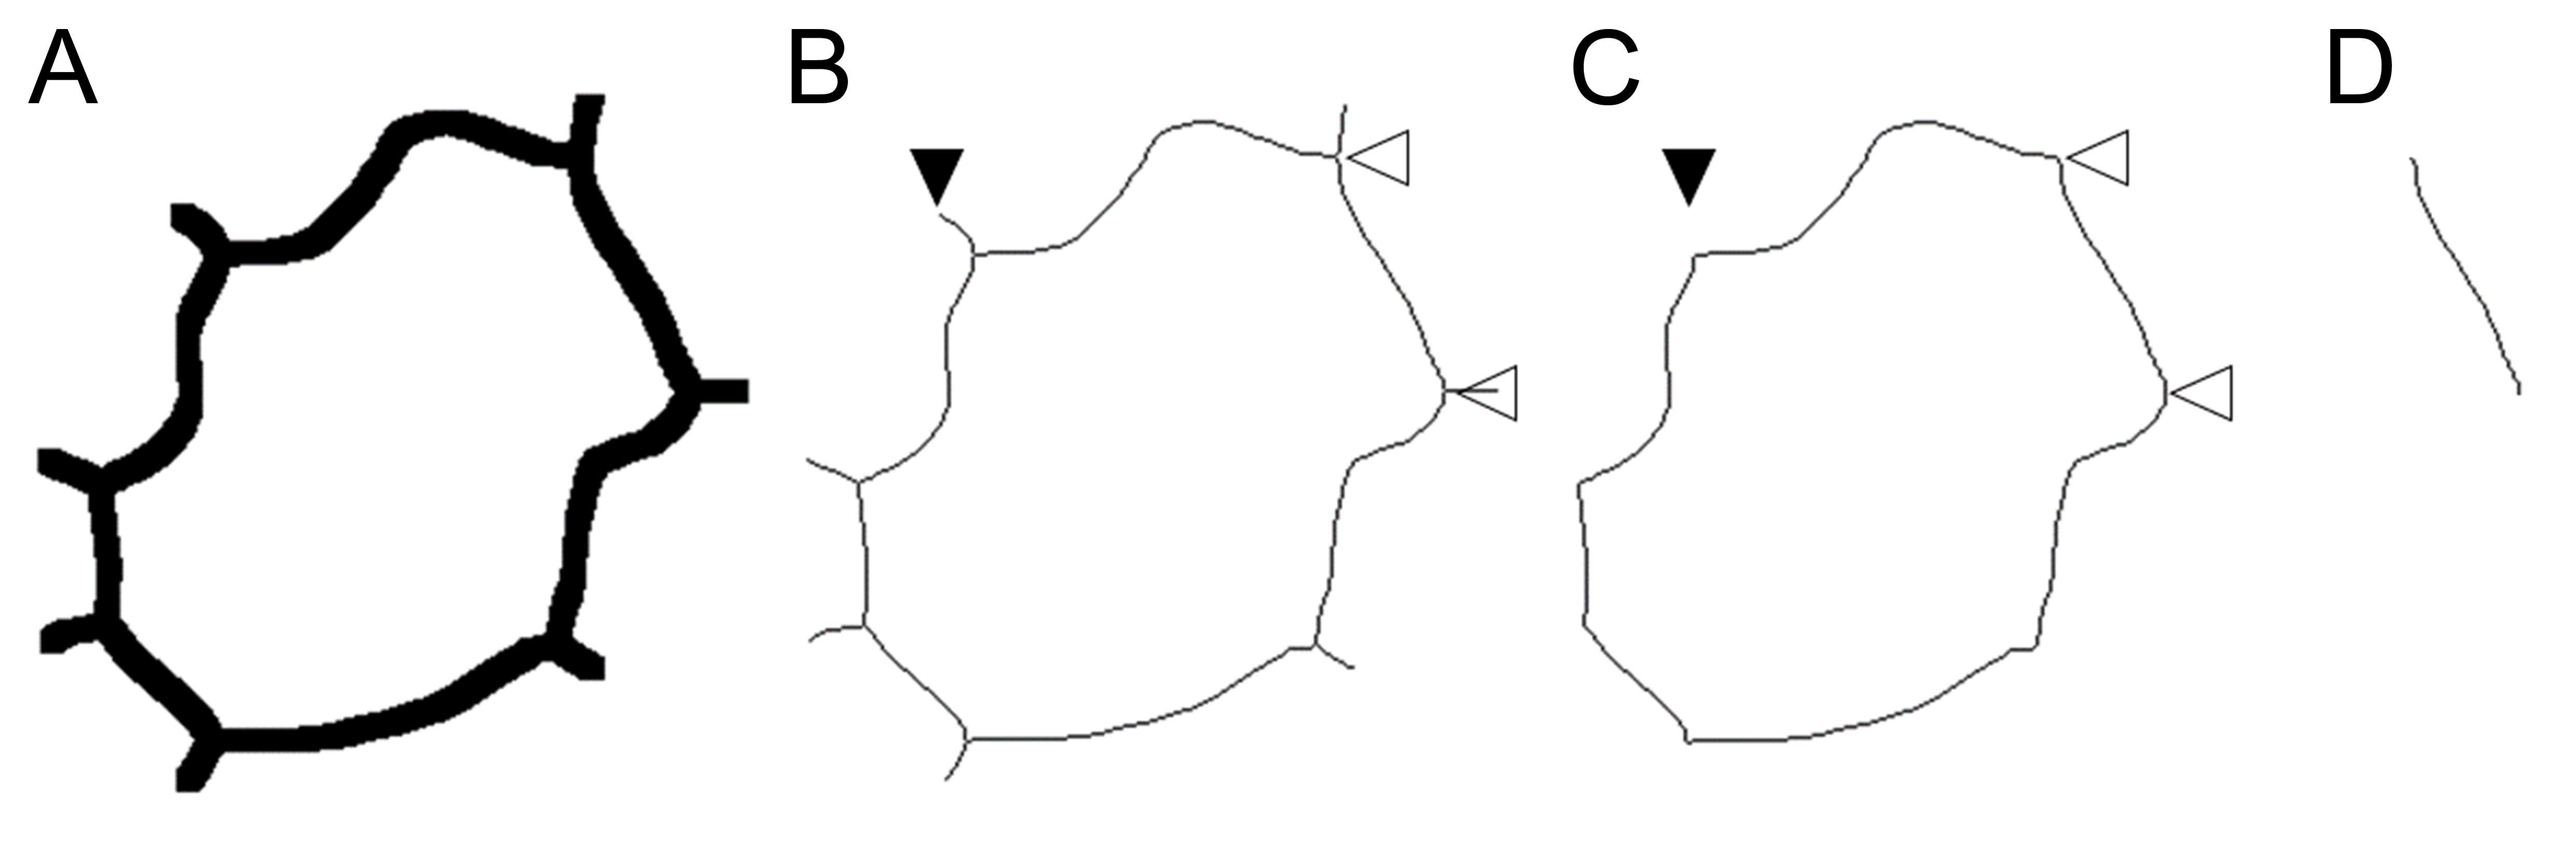
Figure 1. A cell outline of a single Arabidopsis epidermal pavement cell. A. A tracing of the anticlinal walls of a cell. B. The skeletonized outline of the cell has branches extending away from the cell, representing the sites of walls in neighboring cells (black arrowhead) and junctions where anticlinal walls of the cell met (white arrowheads). C. After the cell has been analyzed by skeleton analysis, the branches are removed (pruned, black arrowhead) and the length along the anticlinal wall is calculated as the branch length between wall junctions (white arrowheads). D. An individual wall from the cell between the two white arrowheads in (C). - Using the skeleton outline of the cell run the macro ‘BranchInfo-to-ROI-lines-overlay_.ijm’. It will prompt for the height of the image in pixels and µm and ask for the ‘Branch information’ table to be opened. This macro will put labelled overlay lines on the cell outline so that each wall can be matched to its row number in the Branch information table.
- Repeat steps B1-B4 for every image of the cell captured at sequential time points.
- In the same folder as the skeletonized outline images, create a plaintext file with the file extension ‘.tps’ that contains the following two lines for each image, where X is the specific time point that the cell was originally imaged.
LM = 0
IMAGE = imageNameTimeX.tif - Open the ‘.tps’ file in the tpsDig2 program, outline the cell using the ‘outline object tool’ and then right click the image for more options and select ‘Save as XY coords.’. Repeat for each time point then save the resulting data of the cell outline coordinates.
- Open this ‘.tps’ data in a plain-text editor and save the list of X and Y coordinates as a separate file for each time point using the ‘.txt’ file format.
- Open a cell outline image in ImageJ and then run the macro ‘Add-Points-From-TPSlist-To-ROIManager_.ijm’. This will prompt to open up the X and Y coordinates ‘.txt’ file made in step B8. A results table of the X and Y coordinates in a format suitable for ImageJ and calibrated to the image dimensions is then created. Save the results table as a ‘.txt’ file and repeat for each time point.
- Modify the ‘.txt’ files for each time point in a text editor so that the first X and Y coordinates refer to the same corresponding cell wall junction across all time points. Refer to the ROI number of the points generated on the image overlay in step B9.
- Open the cell outline image in ImageJ and then run the macro ‘Formatted-Points-List-To-ROImanager_.ijm’. This will prompt to open up the new paired X and Y coordinates ‘.txt’ file made in step B10 and converts the X and Y coordinates into a format suitable for ImageJ, calibrated to the image dimensions. Save the list of coordinates in the ROI manager as a ‘.zip’ file.
- Repeat steps B9-B11 for each time point.
- Using a program such as ImageJ or Adobe Photoshop, create an outline of the cell at one time point by tracing the anticlinal walls of the cell using a black pencil tool. Make sure to include a small region of walls of neighboring cells (branches). Copy this black outline onto on a new TIFF image with a white background (Figure 1A).
- Generating thin plate splines
- Using the cell outline image and the ROI ‘.zip’ file in ImageJ record the ROI number that corresponds to each wall junction at each time point.
- To conduct a thin plate spline analysis, an equal number of homologous landmarks are needed at each time point. The number of homologous landmarks for an anticlinal wall segment over all time points was calculated by dividing the wall length at the initial time by 0.5 µm as follows:
d = w/0.5 µm
Where,
d is the desired number of loci (homologous landmarks) in an anticlinal wall segment rounded to the nearest integer,
w is the length of each wall segment. - The position of these homologous landmarks is calculated using the slope-intercept formula: f(a) = m x a + (p - [m x d])
m = (p - 1)/(d - 1)
Where,
f(a) is the selected loci from the list of xy coordinate pairs that describe the cell outline on each day,
p is the number of xy coordinate pairs in a section of wall,
m is the gradient of the slope. - An editable example Excel file can be used to organize the data and get the final list of output coordinates as described in steps C2 and C3 (see Data analysis). It consists of a spreadsheet with 6 tabs; an input tab called intervalRaw, a tab with the output x and y coordinates for each time point called intervalSelection and four data tabs labelled t1, t2, t3 and t4 that contain a complete list of x and y coordinate pairs at each time point with the same layout as the file generated in step B10. The input tab can be modified to suit a different number of walls by copying the formula for additional rows. Additional time periods can be added with an example of the layout provided for time point t4 which is left blank for this purpose. For the output tab the cell references of the gradient (m) and constant (b) needs to match with the selected wall and time period. This can be achieved in the formulas of columns B through E by increasing the value of both cell references by 1 the row after the last loci of each wall (row highlighted in red). The formulas in columns B through E in the output tab may need to be modified depending on the number of loci in each wall.
- The selected coordinates should be arranged into labelled columns as follows and saved in a text editor as a ‘.txt’ file for each time period:
no, x, yIJ, yTPS
1, 823, 286, 853
2, 824, 287, 852
3……… - Check all coordinates have been selected correctly for equal spacing by opening a cell outline image in ImageJ, run the macro ‘Formatted-Points-From-TPSlist-To-ROIManager_.ijm’ and open the ‘.txt’ file created for the same time point. This will show all the points in the ‘.txt’ file in the ROI manager as an overlay on an image.
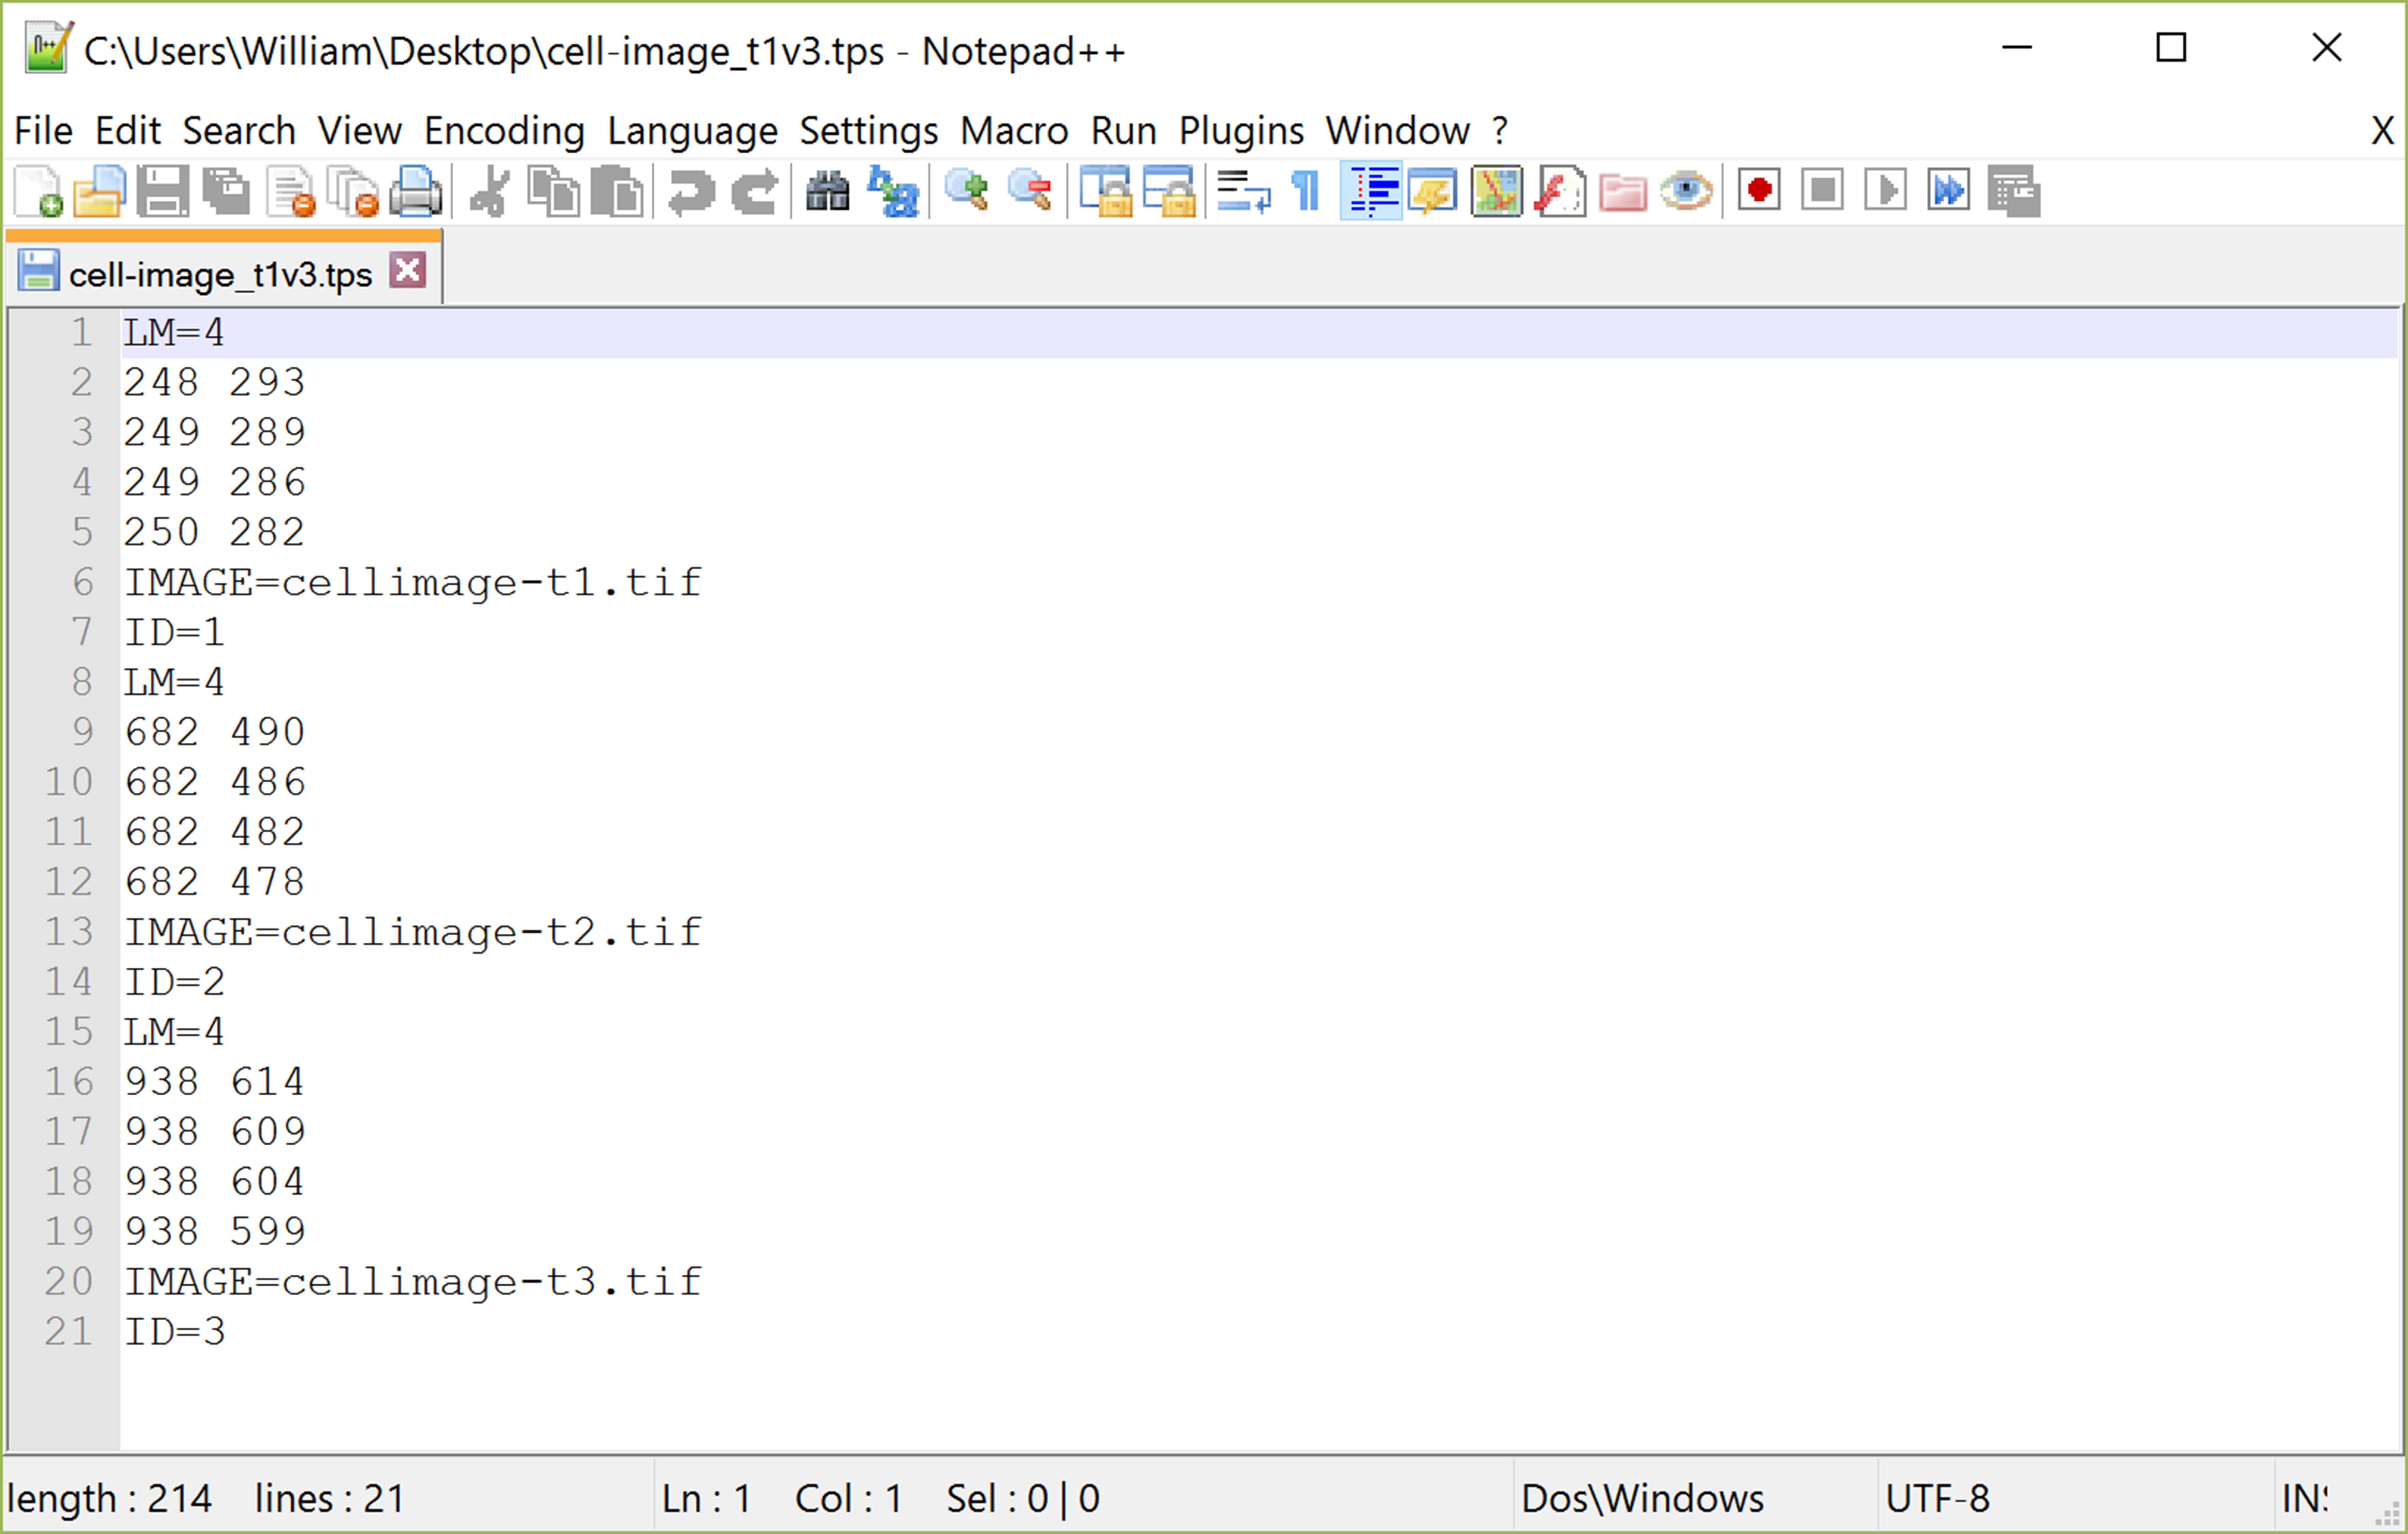
Figure 2. A .tps file open in Notepad++ text editor program showing an example data set with four homologous landmarks at three time periods. This example data set shows how .tps files are arranged as a list beginning with the number of homologous landmarks (LM), followed by the x and y values of those coordinates, the image name (IMAGE) and the number of the time period (ID). Data for additional time periods are entered in this same sequence directly below. - Combine the data for each time point into a new ‘.tps’ file using a text editor with the following lines for each time period (Figure 2):
LM = number of homologous landmarks
x1 = x coordinate 1 y1 = y coordinate 1 (in TPS format)
x2 = x coordinate 2 y2 = y coordinate 2 (in TPS format)
… …
IMAGE = imageNameTimeX.tif
ID = number of the time period - With this ‘.tps’ file for all time points make new tps files for time n + 1 and n + 2, n + 2 and n + 3, etc.
- Open a ‘.tps’ file in PAST, select all data cells and then conduct a Procrustes transformation with options to use 2D, rotate to major axis and keep size (only translate and rotate). Perform a ‘Thin plate splines and warps 2D’ and save bitmap (BMP) images of the thin plate splines for time n versus n + 1, time n + 1 versus n + 2, etc. These should be saved as two different formats; output the images in (1) grayscale format by selecting expansion factors and deselecting color map and (2) plain thin plate spline format with expansion factors deselected.
- Using the cell outline image and the ROI ‘.zip’ file in ImageJ record the ROI number that corresponds to each wall junction at each time point.
- Generating thin plate spline images that show the relative expansion rate
- Using the fold-growth scale on the grayscale thin plate spline images generated in step C9 record the maximum and minimum fold expansion values for each time interval that are presented as an overlay on the thin plate spline images (Figure 3A).
- Determine the maximum relative expansion rate using the formula ln(maximum fold expansion)/number of hours between time n + 1 and n. This should be the maximum relative expansion across all days. As this will set the highest value of expansion represented on the relative expansion scale it can be adjusted to be the nearest round number above that necessary for the dataset.
- Open the grayscale thin plate spline images at each time interval in ImageJ. Using the point tool place a point in the center of every grid square and add each ROI to the ROI Manager. Save this list of ROI points for each time point as a separate ‘.zip’ file.
- Run the macro ‘TPS-rel-expansion-prepare_.ijm’. This macro will ask for a grayscale thin plate spline image made by PAST and the corresponding ROI ‘.zip’ file made in the previous step. This will automatically extract the grayscale value and XY coordinate for each point and then save this information as ‘xyGrayscaleValues-NAME.txt’. Repeat for each time point.
- Run the macro ‘TPS-rel-expansion-format_.ijm’. It will prompt for the ‘xyGrayscaleValues-NAME.txt’ text file, the blank thin plate spline image for coloring and the ROI ‘.zip’ file made in step D3. In addition, the following values need to be put in to the dialog box: (1) The maximum expansion (fold growth) across all time periods, (2) minimum expansion (fold growth) across all time periods, and (3) maximum log ratio expansion (this will be what the final scale will be in so if you have multiple cells make sure this value is large enough to cover all use cases, see step D2). This will generate a color PNG image of the relative expansion rate for the thin plate spline appended with the label ‘-output’ (Figure 3B). Repeat for each time point.
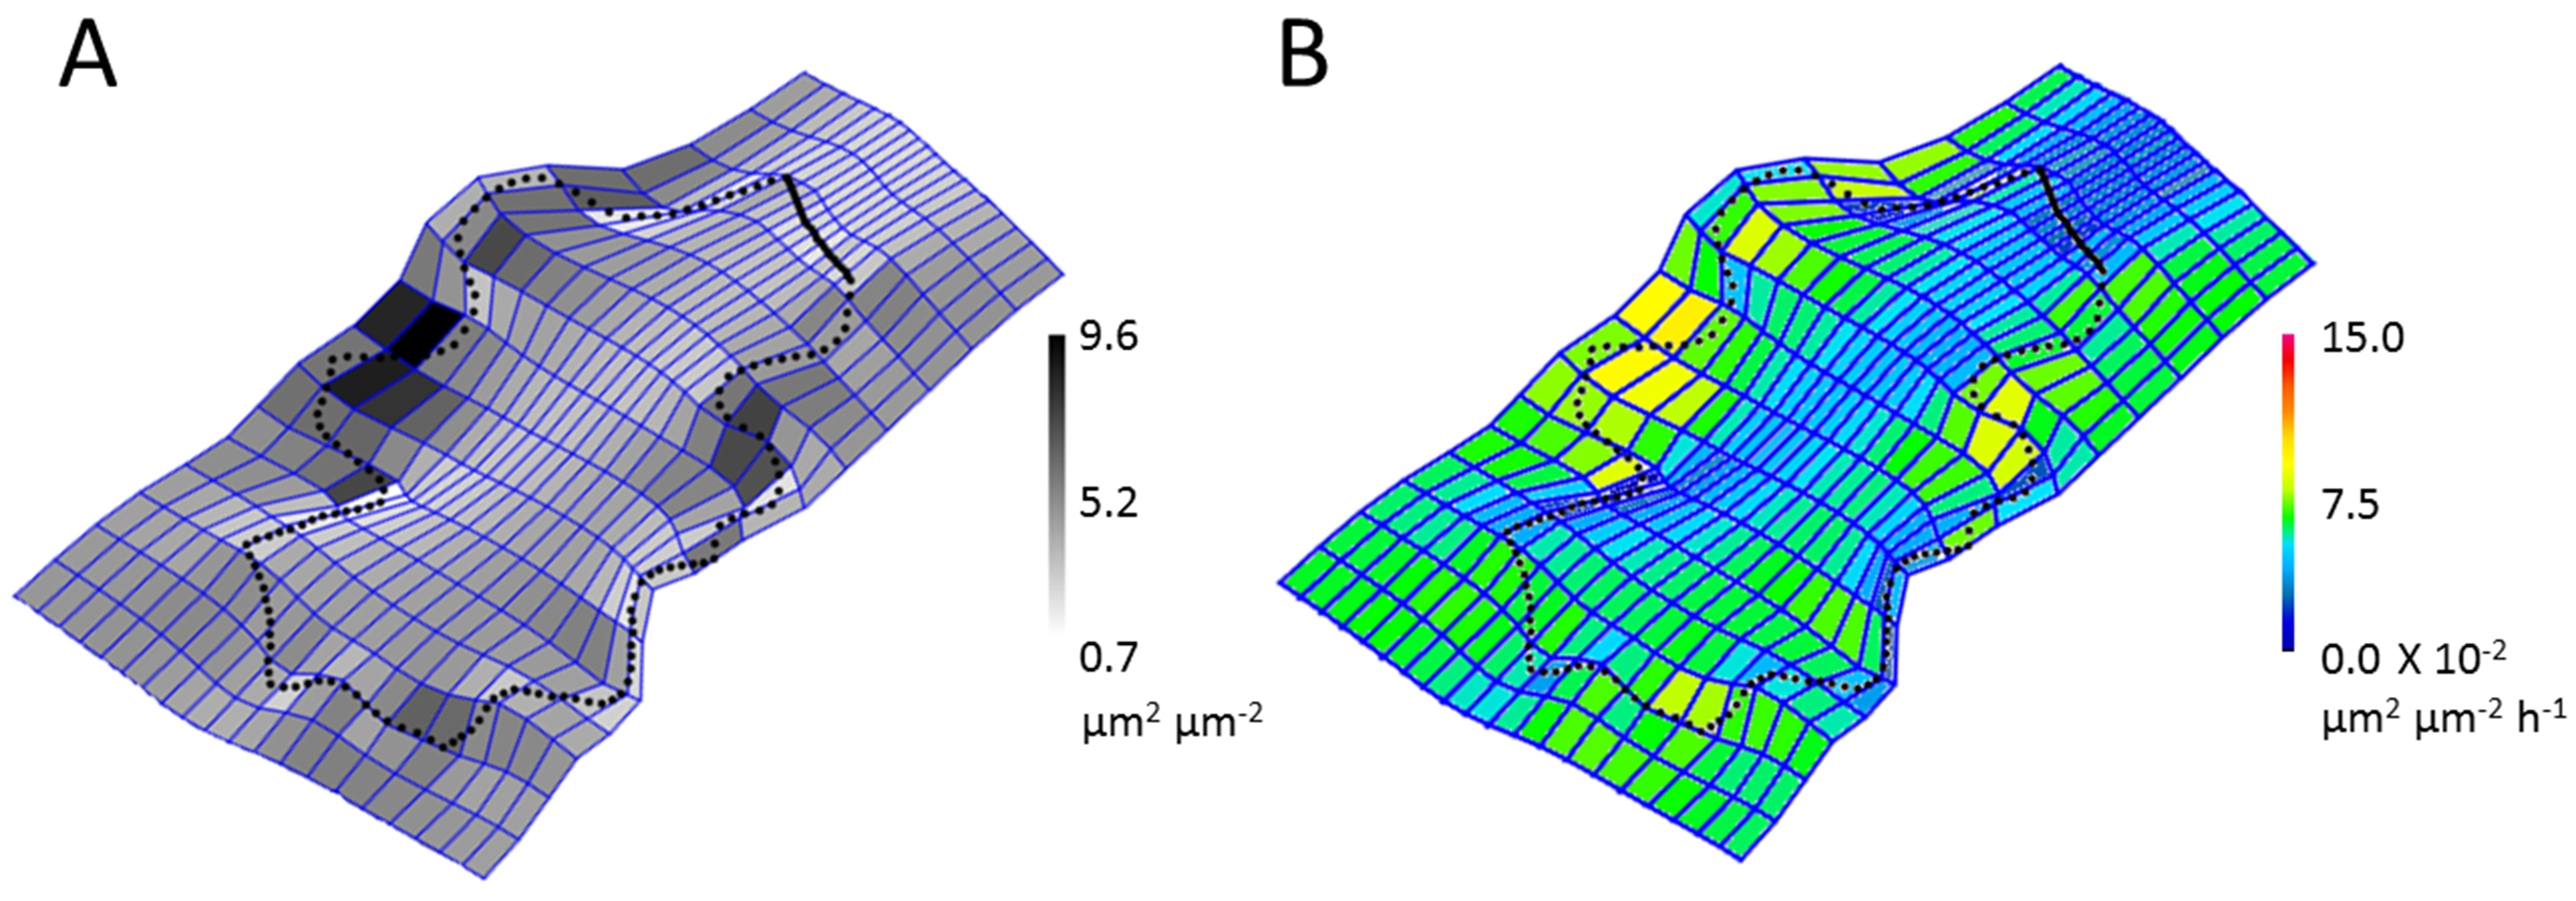
Figure 3. Thin plate splines of the growth of a single Arabidopsis epidermal pavement cell from time n to time n + 1. A. The thin plate spline made by PAST is a grayscale fold-growth measurement. B. After processing to extract the grayscale values and recoloring the grid squares, the relative expansion rates of the thin plate spline of a cell over time can be determined.
- Using the fold-growth scale on the grayscale thin plate spline images generated in step C9 record the maximum and minimum fold expansion values for each time interval that are presented as an overlay on the thin plate spline images (Figure 3A).
Data analysis
Thin plate spline analysis is used to visualize changes in the size and shape of objects. Comparing the thin plate spline of a cell from day to day reveals areas where the relative growth rate is higher as indicated by warmer colors and directions of growth are indicated by changes in the shape of the mesh. This protocol uses the outline of a cell over time to make an approximation of the growth of different regions of the cell wall. This allows different regions of growth rates to be identified rather than generating absolute values of expansion suitable for further statistical analysis.
A spreadsheet with representative data that shows how to sort the data outlined in steps C2-C4 is given in the file Intervals-calculation.xls (https://en-cdn.bio-protocol.org/attached/file/20161017/20161017210209_7507.xls)
Notes
This method is designed for visualizing the changes in growth of single cells but it can be adapted to different spatial scales. Growing conditions, such as the concentration or variety of nutrients used, or light intensities might vary between experiments. Altering the percentage of bacteriological agar used could affect the root growth of the seedlings. The agar needs to be soft enough for the roots to penetrate through it but firm enough that the roots are firmly embedded and can provide a firm anchor for the growth of seedlings. Macro running times will depend on the size of the images and data. For a single cell such as in Figure 3B the running time of the macros is typically 2-15 sec on an Intel Core i5 processor with the slowest macro being TPS-rel-expansion_format.ijm at 15 sec. Additional text files of the raw values of the expansion rate and the RGB values of the each individual grid of the thin plate spline are automatically saved in the same folder as the output images of step D5 (ExpansionValues-NAME.txt and xyColourValuesNAME.txt).
Acknowledgments
This protocol is adapted from Armour et al., 2015. This research was supported by an Australian Postgraduate Award to WJA.
References
- Armour, W. J., Barton, D. A., Law, A. M. and Overall, R. L. (2015). Differential growth in periclinal and anticlinal walls during lobe formation in Arabidopsis cotyledon pavement cells. Plant Cell 27(9): 2484-2500.
- Börstler, J., Lühken, R., Rudolf, M., Steinke, S., Melaun, C., Becker, S., Garms, R. and Krüger, A. (2014). The use of morphometric wing characters to discriminate female Culex pipiens and Culex torrentium. J Vector Ecol 39(1): 204-212.
- Fu, Y., Gu, Y., Zheng, Z., Wasteneys, G. and Yang, Z. (2005). Arabidopsis interdigitating cell growth requires two antagonistic pathways with opposing action on cell morphogenesis. Cell 120(5): 687-700.
- Green, P. B., Erickson, R. O. and Richmond, P. A. (1970). On the physical basis of cell morphogenesis. Ann NY Acad Sci 175(1): 712-731.
- Gunz, P., Mitteroecker, P., Neubauer, S., Weber, G. W. and Bookstein, F. L. (2009). Principles for the virtual reconstruction of hominin crania. J Hum Evol 57(1): 48-62.
- Polder, G., van der Heijden, G. W. A. M., Jalink, H. and Snel, J. F. H. (2007). Correcting and matching time sequence images of plant leaves using penalized likelihood warping and robust point matching. Comput electron agr 55(1): 1-15.
- Rosas, A. and Bastir, M. (2002). Thin-plate spline analysis of allometry and sexual dimorphism in the human craniofacial complex. Am J Phys Anthropol 117(3): 236-245.
- Schwab, B., Mathur, J., Saedler, R., Schwarz, H., Frey, B., Scheidegger, C. and Hulskamp, M. (2003). Regulation of cell expansion by the DISTORTED genes in Arabidopsis thaliana: actin controls the spatial organization of microtubules. Mol Genet Genomics 269(3): 350-360.
- Shaw, S. L., Dumais, J. and Long, S. R. (2000). Cell surface expansion in polarly growing root hairs of Medicago truncatula. Plant Physiol 124(3): 959-970.
Article Information
Copyright
© 2016 The Authors; exclusive licensee Bio-protocol LLC.
How to cite
Armour, W. J., Barton, D. A. and Overall, R. L. (2016). Visualising Differential Growth of Arabidopsis Epidermal Pavement Cells Using Thin Plate Spline Analysis. Bio-protocol 6(22): e2022. DOI: 10.21769/BioProtoc.2022.
Category
Plant Science > Plant cell biology > Cell imaging
Developmental Biology > Cell growth and fate
Cell Biology > Cell imaging
Do you have any questions about this protocol?
Post your question to gather feedback from the community. We will also invite the authors of this article to respond.