- Protocols

- Articles and Issues
- For Authors
- About
- Become a Reviewer

Detection of Anaphase Bridge Formation by Immunofluorescence Microscopy in Mammalian Cells


Published: Vol 6, Iss 20, Oct 20, 2016 DOI: 10.21769/BioProtoc.1977 Views: 12945
Reviewed by: HongLok LungAnonymous reviewer(s)
Original research article
The authors used this protocol in:

Jan 2016
Advertisement


Protocol Collections
Comprehensive collections of detailed, peer-reviewed protocols focusing on specific topics


Related protocols
Abstract
The aim of this protocol is to provide a comprehensive description of the materials, equipment and reproducible methods to detect and analyze anaphase bridges in immunofluorescence microscopy using DAPI to detect cells that failed to completely segregate during mitosis. It describes the process of cell preparation, staining and microscopic settings for detection of anaphase bridges. The protocol has been adapted from our previous publication (Aschacher et al., 2016).
Keywords: Anaphase bridgesBackground
During cell division it is vital for the maintenance of genome integrity that the genetic material is fully separated. For various reasons this process can be dysfunctional and as a result the sister chromatids are connected by DNA bridges, which most frequently happens during anaphase. Especially chromosomal fragile sites are associated with anaphase bridges (e.g., unprotected and unstable telomeres). Breakage, deletion, translocation non-disjunction and changes in chromosome number at these sites are often linked with cancer and other genetic diseases. Two types of anaphase bridges are described, the ultrafine DNA bridges, that cannot be detected by DAPI staining and the chromatin bridges, which are visualized by DAPI (Germann et al., 2014). The latter is described subsequently.
This protocol describes a fast and simple method for the detection and calculation of anaphase bridges to provide an additional assay for telomere attrition in any publications.
Materials and Reagents
- 8-chamber slides (e.g., NuncTM Lab-TekTM II chamber SlideTM system, Thermo Fisher Scientific, Thermo ScientificTM, catalog number: 154534 )
- Nail polish (colourless, commercial available)
- Coverslips (Thermo Fisher Scientific, Thermo ScientificTM, catalog number: Q10143263NR1 )
- Tumour cell line
Note: HCT-116 p53/wt was used in this protocol (ATCC, Germany). - Fetal bovine serum (FBS) (Thermo Fisher Scientific, GibcoTM, catalog number: 26140079 )
- Dulbecco’s phosphate-buffered saline (PBS) (Sigma-Aldrich, catalog number: D8662 )
- Trypsin-EDTA solution, 0.25%, sterile-filtered (Sigma-Aldrich, catalog number: T4049 )
- McCoy’s 5A medium modified with sodium bicarbonate, without L-glutamine (Sigma-Aldrich, catalog number: M8403 )
- Formaldehyde solution (37%) (Sigma-Aldrich, catalog number: 252549 )
- Nuclear staining reagent (colour depends on secondary staining)
- 4’,6-diamidino-2-phenylindole (DAPI), colour blue (Thermo Fisher Scientific, Thermo ScientificTM, catalog number: 62247 )
- Hoechst 33342, trihydrochloride, trihydrate, colour blue (Thermo Fisher Scientific, Thermo ScientificTM, catalog number: H3570 )
- DRAQ5TM fluorescent probe solution (5 mM), colour red (Thermo Fisher Scientific, Thermo ScientificTM, catalog number: 62251 )
- Propidium iodide (PI), colour red (Thermo Fisher Scientific, Molecular ProbesTM, catalog number: P21493 )
- Vectashield mounting medium (Vector Laboratories, USA)
- Triton X-100 (Sigma-Aldrich, catalog number: X100 )
- Growth medium (see Recipes)
- 3.7% formaldehyde solution (see Recipes)
- Permeabilization solution (see Recipes)
Equipment
- Cell culture microscope (e.g., Carl Zeiss, Vienna, Austria)
- Pipettes
- Hemocytometer (e.g., Bürker-Türk) (BRAND, catalog number: 719505 )
- Centrifuge (e.g., Eppendorf, Germany)
- 37 °C, 5% CO2 incubator
- Confocal laser scanning microscope (Carl Zeiss, model: LSM 800 )
Software
- Software for LSM800: ZEN lite (for free download find 'www.zeiss.com/microscopy/en_de/products/microscope-software/zen-lite.html')
Procedure
- Maintain cells in McCoy’s 5A medium supplemented with 10% fetal bovine serum in a cell culture plate until cells are 70-80% confluent.
- Wash cells once with PBS and trypsinize cells by adding 1 ml trypsin solution and incubate for 3-5 min until cells are floating under microscopy.
- Add 5-10 ml growth medium, mix them with a pipette, and count cells with a hemocytometer.
- Seed cells on chamber slides with appropriate seeding density. The number of cells for a confluent chamber slide will vary with cell type. For this experiment, we use HCT-116 with a seeding density of 2 x 10⁴ cells/well in a 4-chamber slide.
- Allow to rest for 24 h or treat the cells as required for 24-72 h in an incubator 37 °C 5% CO2.
- Prepare formaldehyde solution with 1 ml 37% formaldehyde in 9 ml 1x PBS, giving a final concentration of formaldehyde of 3.7%. This solution should be prepared immediately before use.
Note: Formaldehyde is toxic. Please read the MSDS before working with this chemical. Gloves and safety glasses should be worn and solutions made inside a fume hood. - Next day, or after treatment, wash cells twice with ice-cold PBS and fix them with 200-300 µl 3.7% formaldehyde solution for 10 min on ice.
- Afterwards, wash the cells twice with PBS for 5 min each at RT (room temperature).
- Permeabilize cells by covering cells with permeabilization solution for 10 min at RT.
- Wash cells twice with PBS.
- Optional: subsequently, proceed to block cells with blocking reagent and stain cells with antibodies.
- Afterwards, remove supernatant and stain cells with either DAPI, PI, Hoechst 33342 or DRAQ5 with a final concentration of 1 µg/ml for 15-30 min, respectively in the dark at RT.
Notes: - Blue spectral properties make it ideal for use with green (Alexa Fluor® 488, FITC, GFP) and red (Alexa Fluor® 594, rhodamine, Texas Red®, mCherry, mKate-2) fluorophores in multicolor experiments. For live-cell staining, Hoechst® 33342 dye is a popular cell-permeant nuclear counterstain.
- Optional: Use vectashield mounting medium including 0.5 µg/ml DAPI (Vector Laboratories, USA) the nuclear staining step is not required. Proceed with step 15.
- Rinse with PBS and carefully remove the chambers from slides.
- Allow the slides to dry for 2-3 min.
- Mount coverslip with a drop of mounting medium.
- Seal coverslip with nail polish to prevent drying and movement under microscope.
- Use a Zeiss LSM (Laser Scanning Microscope) 700 META microscopy laser system, and a ZEN 2010 microscopy system equipped with a 63x and/or 100x objective.
- Allow the microscope and lasers to warm up for 15-20 min before use.
- The setting used for stain depends on nuclear staining:
- DAPI (Laserline: 405) excitation/emission 350/470 (nm);
- Propidium iodide excitation/emission 535/617 (nm);
- Hoechst 33342 excitation/emission 350/461 (nm);
- DRAQ5 excitation/emission 647/681 (nm).
- First use 63x magnification objective to find nuclei and capture a minimum of 500 nuclei. For better resolution of anaphase bridges a 100x objective could be used.
- For statistical analyses count cell nuclei in a) mitosis (M), b) anaphases (A), and c) anaphases with bridges (AB) separately (Figures 1a and 1b).
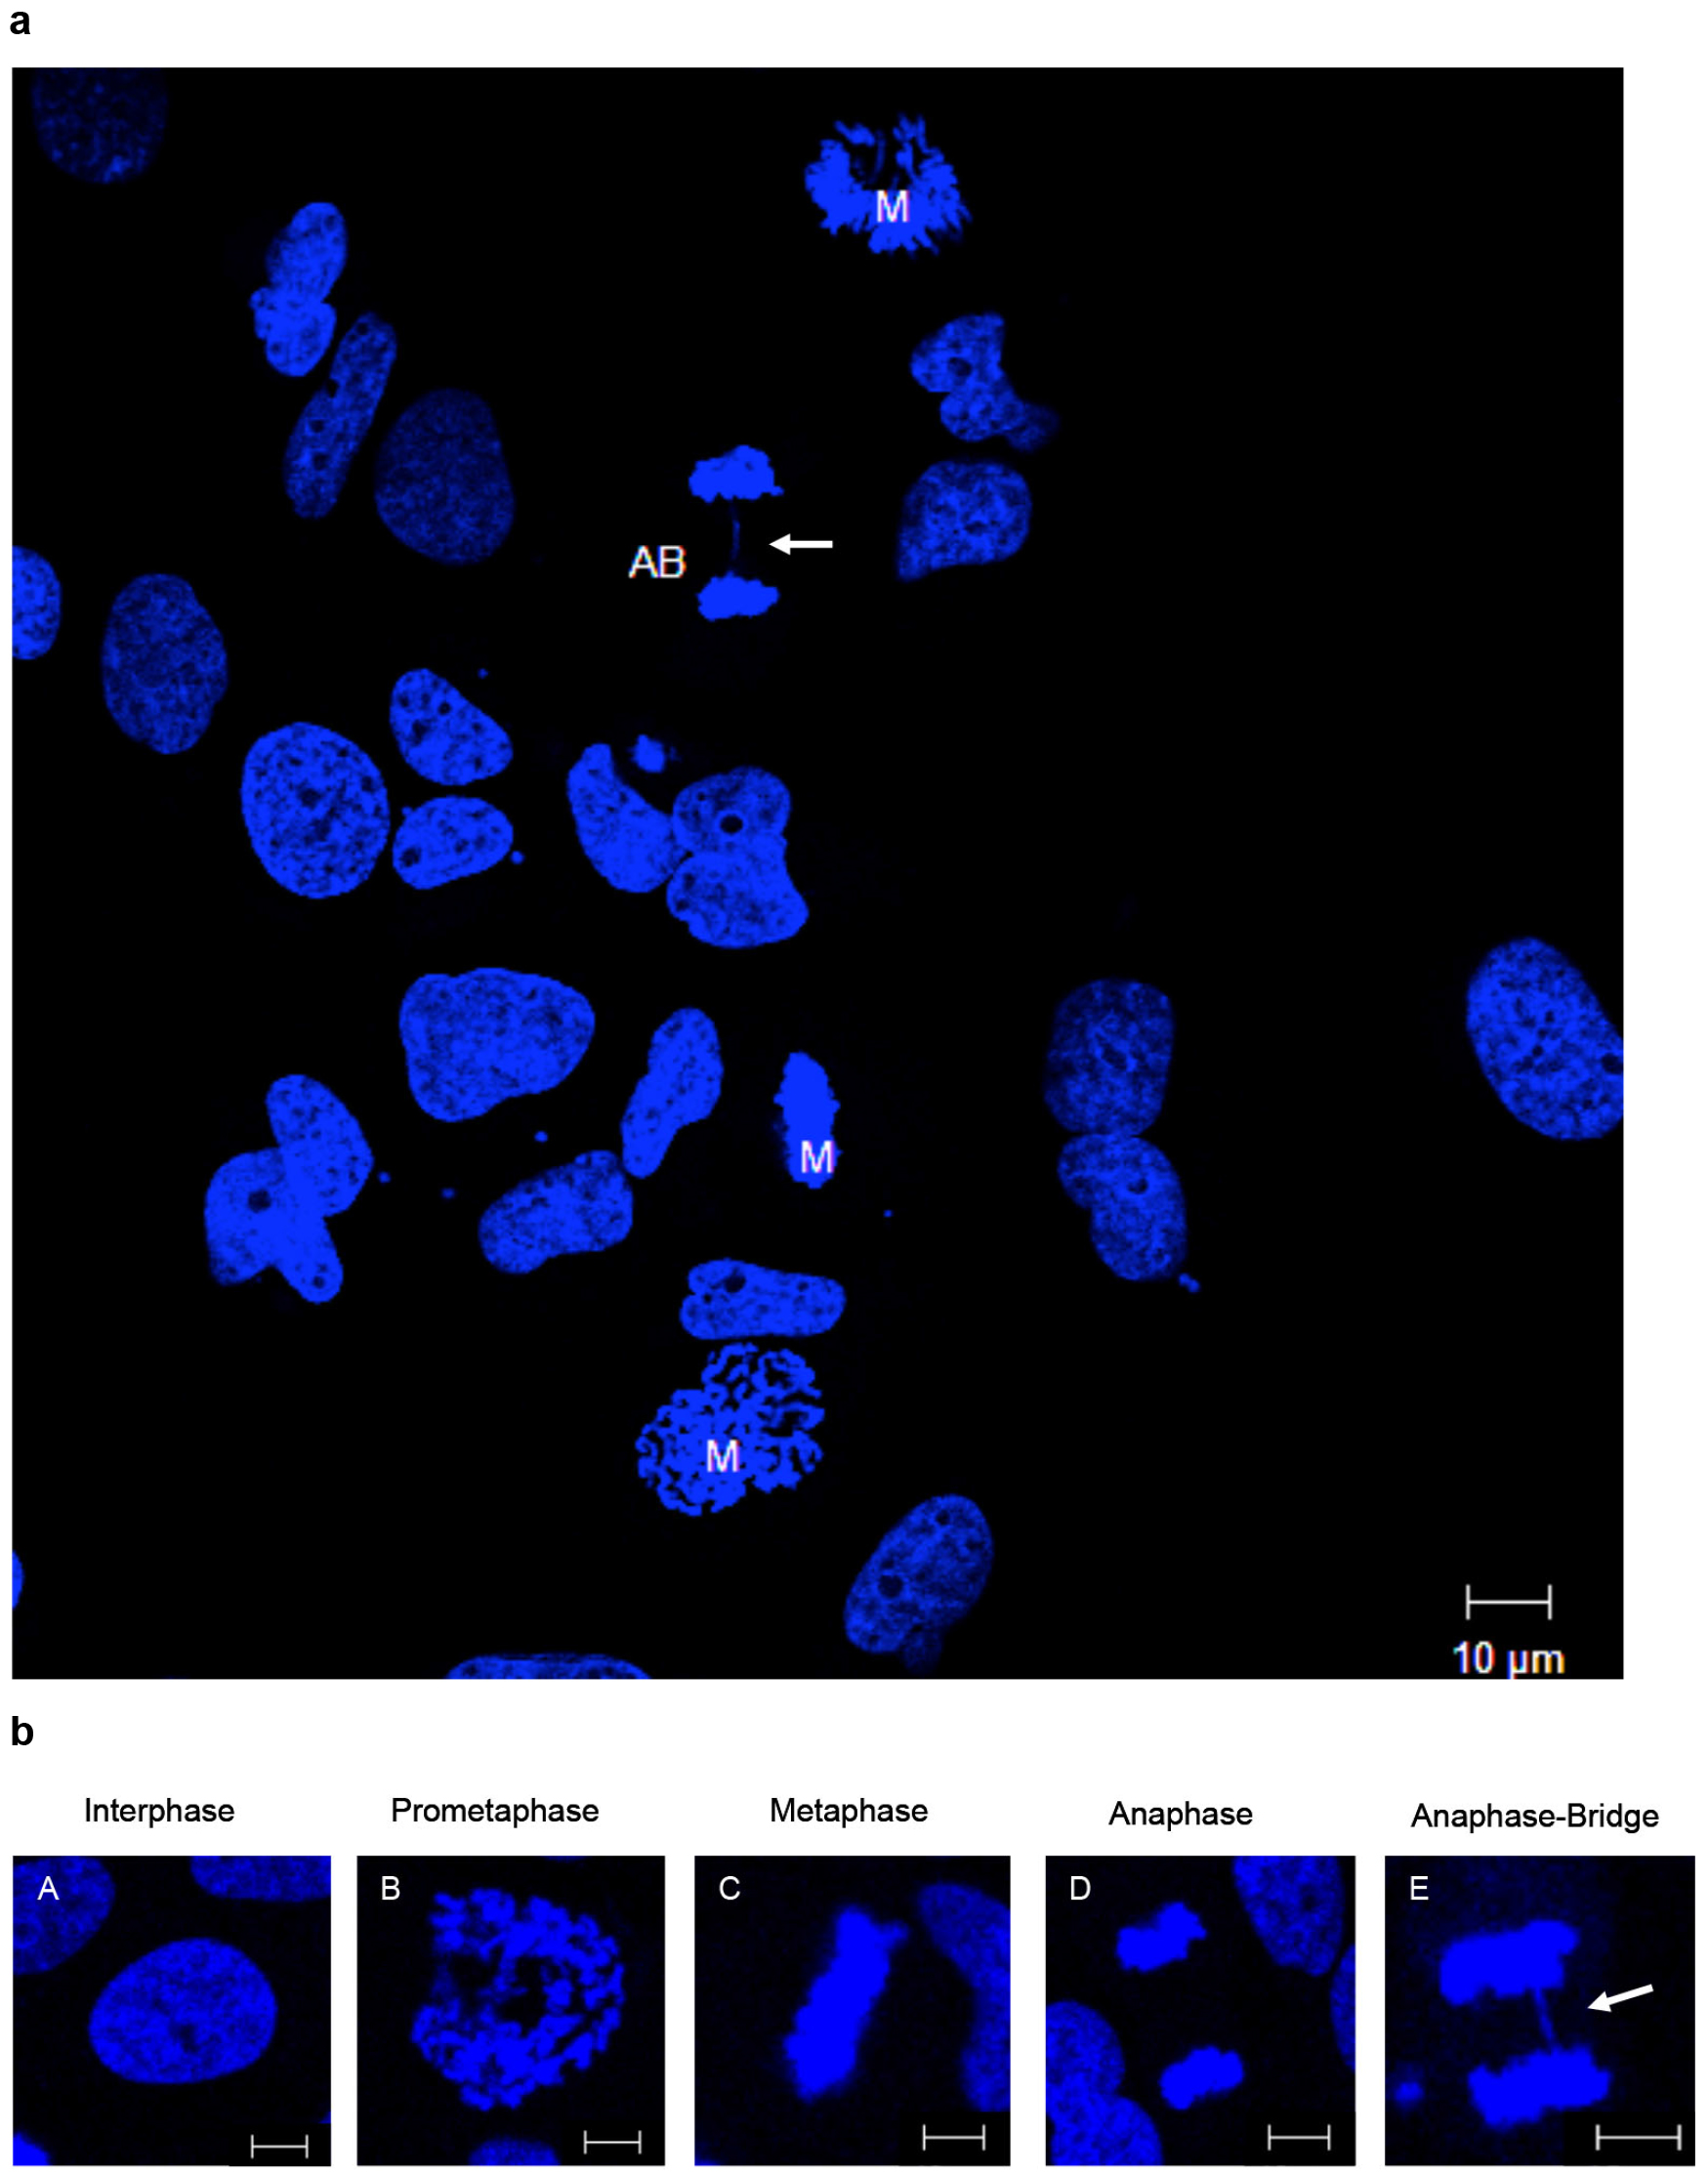 Figure 1. Fluorescence determination of tumor cells with anaphase-bridges. a. Cells in mitosis (M) and specific anaphase with anaphase-bridge (AB) are shown. Scale bar = 10 µm. b. A clear difference could be identified by enlargement of these nuclei in specific cell cycle phase. Representative images of cell nuclei in different cell cycle phase are shown. A. Interphase, B. Prometaphase, C. Metaphase, D. Anaphase, and E. Anaphase with bridge. Scale bars = 5 µm. All cells were stained with DAPI staining. The 'bridge' of anaphase bridges is marked (white arrow).
Data analysis
The frequency of anaphase bridges is calculated as the ratio between cells exhibiting anaphase bridges and the total number of anaphase cells counting at least 100 anaphases. For example we distinguish for calculation i) all nuclei in all phases, ii) all cells in mitosis, iii) cells in anaphases, and iv) anaphase with bridges (also please find Figure 1b). For statistical significance Student's t-test values are calculated.
Note: For this protocol, we treated tumour cell lines with scrambled siRNA or effective siRNA against LINE-1 mRNA as described previously (Aschacher et al., 2016). An effective LINE-1 siRNA treatment causes telomere attrition within three days and leads to anaphase bridges (Table 1 and Figure 2).
Table 1. Statistical calculation for anaphase bridges. Representative table for counting of anaphase bridges is given. A minimum of three independent experiments should be done.
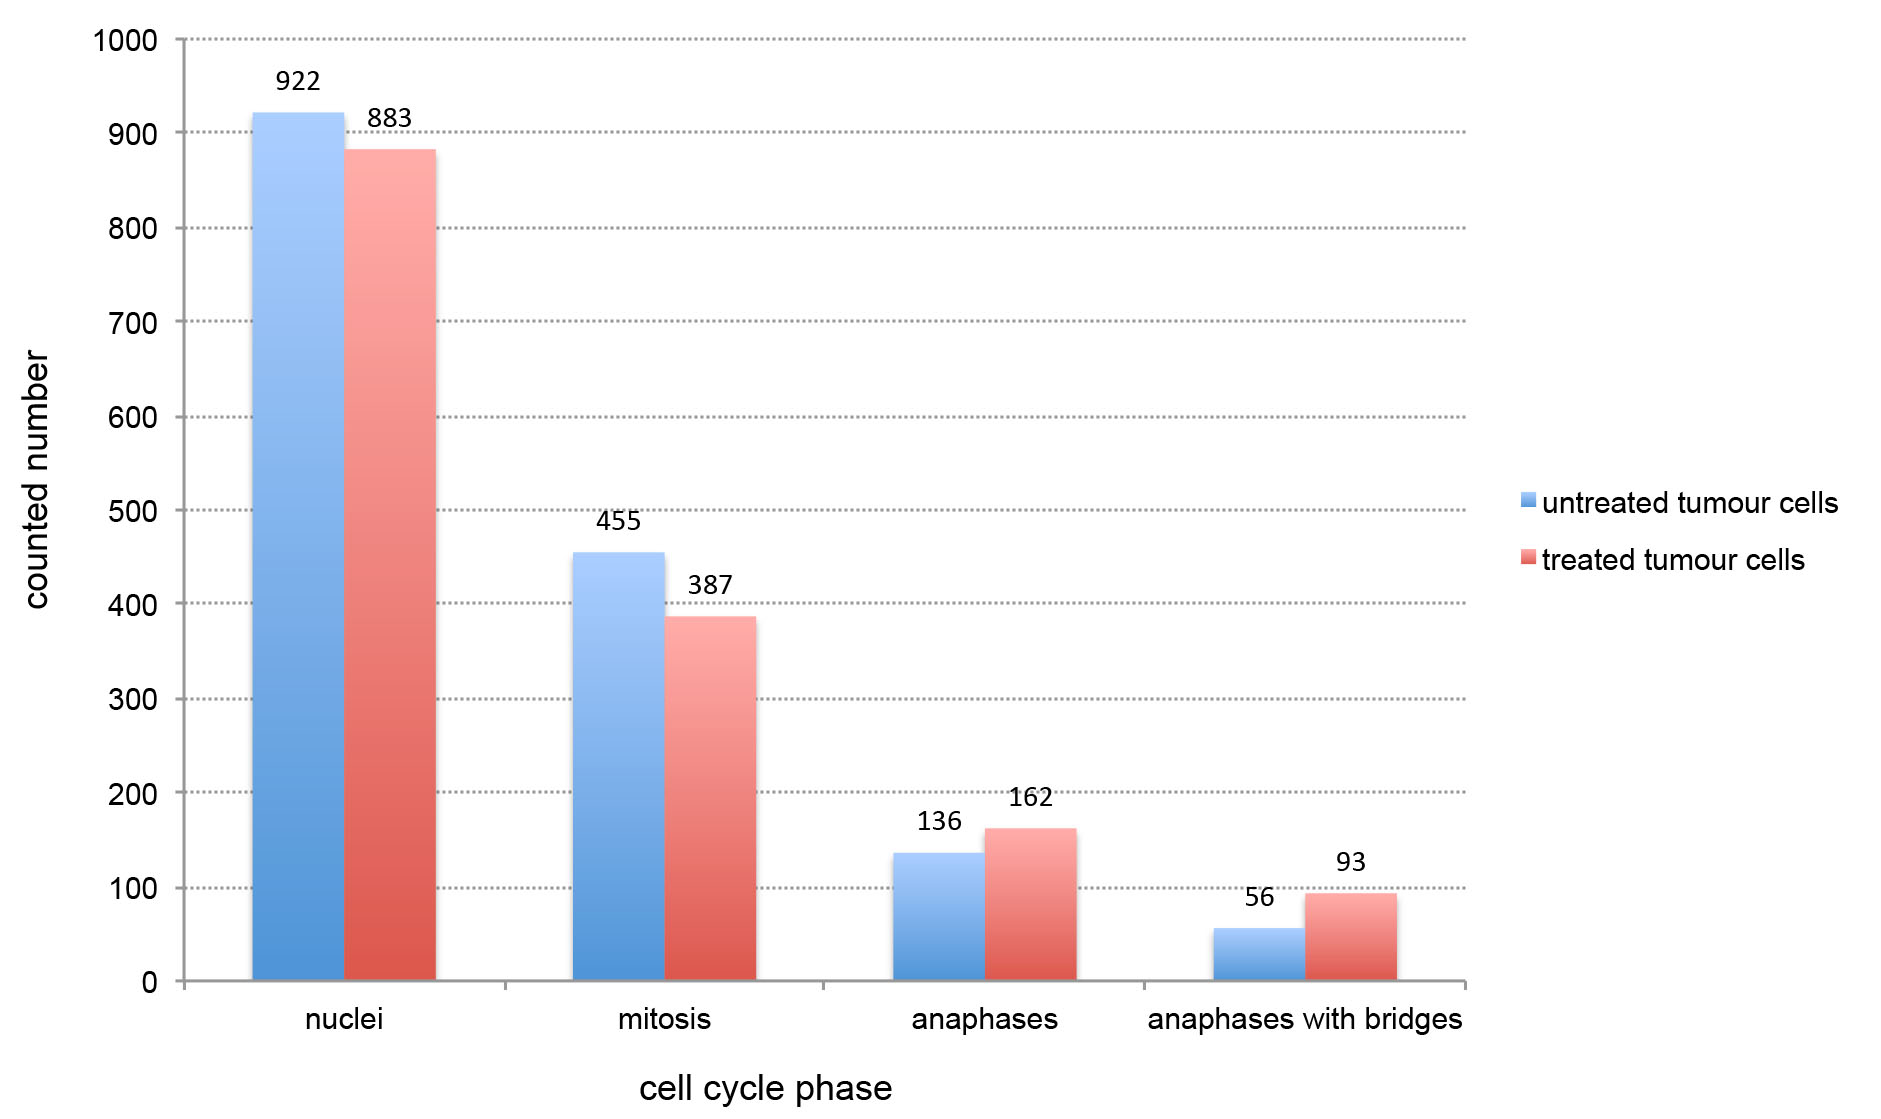
Figure 2. Graphic example for statistical visualization of anaphase bridges. Counted nuclei (including interphase and mitosis), mitosis, anaphases and cells with anaphase bridges are given separately. Numbers of each count are given on the top of bars.
Recipes
- Growth medium
500 ml McCoy’s 5A medium
50 ml FBS, heat inactivated - 3.7% formaldehyde solution
1 ml 37% formaldehyde
9 ml 1x PBS - Permeabilization solution
1x PBS containing 0.25% Triton X-100
Acknowledgments
This protocol was mainly adapted from the publication Aschacher et al. (2016). The work was supported by the Medical University of Vienna in the laboratories for surgical research.
References
- Aschacher, T., Wolf, B., Enzmann, F., Kienzl, P., Messner, B., Sampl, S., Svoboda, M., Mechtcheriakova, D., Holzmann, K. and Bergmann, M. (2016). LINE-1 induces hTERT and ensures telomere maintenance in tumour cell lines. Oncogene 35(1): 94-104.
- Germann, S. M., Schramke, V., Pedersen, R. T., Gallina, I., Eckert-Boulet, N., Oestergaard, V. H. and Lisby, M. (2014). TopBP1/Dpb11 binds DNA anaphase bridges to prevent genome instability. J Cell Biol 204(1): 45-59.
Article Information
Copyright
© 2016 The Authors; exclusive licensee Bio-protocol LLC.
How to cite
Aschacher, T. and Enzmann, F. (2016). Detection of Anaphase Bridge Formation by Immunofluorescence Microscopy in Mammalian Cells. Bio-protocol 6(20): e1977. DOI: 10.21769/BioProtoc.1977.
Category
Cancer Biology > Genome instability & mutation > Cell biology assays > DNA structure and alterations
Cell Biology > Cell imaging > Fluorescence
Do you have any questions about this protocol?
Post your question to gather feedback from the community. We will also invite the authors of this article to respond.