- Protocols

- Articles and Issues
- For Authors
- About
- Become a Reviewer

Determination of Recombinant Mannitol-1-phosphatase Activity from Ectocarpus sp.


Published: Vol 6, Iss 16, Aug 20, 2016 DOI: 10.21769/BioProtoc.1896 Views: 9088
Reviewed by: Valentine V TrotterYanjie LiAnonymous reviewer(s)
Original research article
The authors used this protocol in:
Feb 2014
Advertisement


Protocol Collections
Comprehensive collections of detailed, peer-reviewed protocols focusing on specific topics


Abstract
Brown algae belong to a phylogenetic lineage distantly related to green plants and animals, and are found predominantly, but not exclusively, in the intertidal zone, a harsh and frequently changing environment. Because of their unique evolutionary history and of their habitat, brown algae feature several peculiarities in their metabolism. One of these is the mannitol cycle, which plays a central role in their physiology, as mannitol acts as carbon storage, osmoprotectant, and antioxidant. This polyol is derived directly from the photoassimilate fructose-6-phosphate via the action of a mannitol-1-phosphate dehydrogenase (M1PDH, EC 1.1.1.17) and a mannitol-1-phosphatase (M1Pase, EC 3.1.3.22). This protocol describes the biochemical characterization of a recombinant M1Pase of Ectocarpus sp. The M1Pase enzyme catalyzes the conversion of mannitol-1-phosphate to mannitol (Figure 1).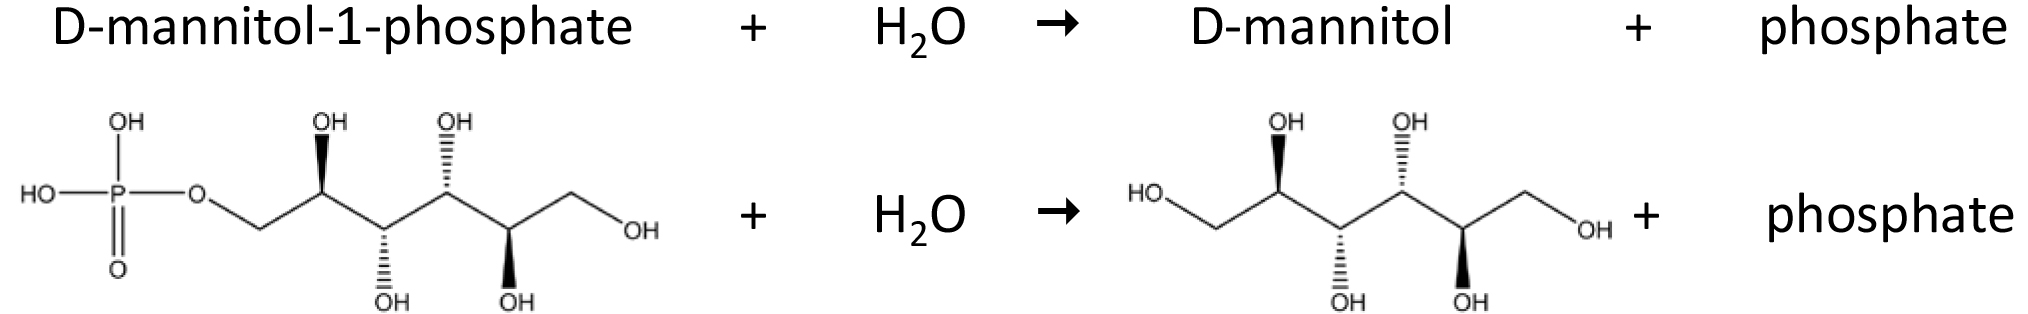
Figure 1. Reaction catalyzed by a mannitol-1-phosphatase
Materials and Reagents
- UV-Star® PS microplate (96 well) (Greiner Bio-One GmbH, catalog number: 655801 )
- 0.22 µm filter
- Escherichia coli BL21 (DE3)
- Trizma® base (Sigma-Aldrich, catalog number: T1503 )
- Purified recombinant His-tagged M1Pase
Note: This protein was produced in Escherichia coli BL21 (DE3) containing the recombinant pFO4_ M1Pase vector, as described by Groisillier et al. (2010). This recombinant protein was purified by affinity chromatography using a HisPrep FF 16/10 column (GE Healthcare) onto an Äkta avant system (GE Healthcare). The complete purification protocol is described in details in Groisillier et al. (2014). - MgCl2 (Sigma-Aldrich, catalog number: M8266 )
- MilliQ water
- Malachite green phosphate assay kit (Gentaur, catalog number: POMG-25H )
Note: Malachite green phosphate assay protocol is available at https://www.bioassaysys.com/Datasheet/POMG.pdf. - Examples of chemicals to be tested to assess substrate specificity
- D-mannitol-1-phosphate (Sigma-Aldrich, catalog number: 92416 )
- D-fructose-1-phosphate (Sigma-Aldrich, catalog number: F1127 )
- D-glucose-1-phosphate (Sigma-Aldrich, catalog number: G9380 )
- D-mannose-6-phosphate (Sigma-Aldrich, catalog number: M3655 )
- D-glucose-6-phosphate (Sigma-Aldrich, catalog number: G7879 )
- D-fructose-6-phosphate (Sigma-Aldrich, catalog number: F3627 )
- NaCl (Sigma-Aldrich, catalog number: 71380 )
- 1 M Tris-HCl (pH 7.5) (see Recipes)
- 100 mM MgCl2 (see Recipes)
- 5 M NaCl (see Recipes)
Equipment
- NanoDrop 2000 spectrophotometer (Thermo Fisher Scientific, model: NanoDrop 2000 )
- Safire2 UV spectrophotometer microplate reader (Tecan Trading AG)
Software
- Hyper32 (Informer Technologies, http://hyper32.software.informer.com/)
- Microsoft Excel
Procedure
- The standard reaction mixture contains 100 mM Tris-HCl (pH 7.5), 1 mM M1P, 5 mM MgCl2 and 6 to 78 µg of purified recombinant enzyme quantified by NanoDrop (based on the extinction coefficient of 18,700 M-1 cm-1 calculated for the protein of interest), in a final volume of 450 µl. Inactive boiled purified recombinant enzyme is used as a negative control (Table 1).
Table 1. Composition of negative control and reaction mixture for determination of M1Pase activity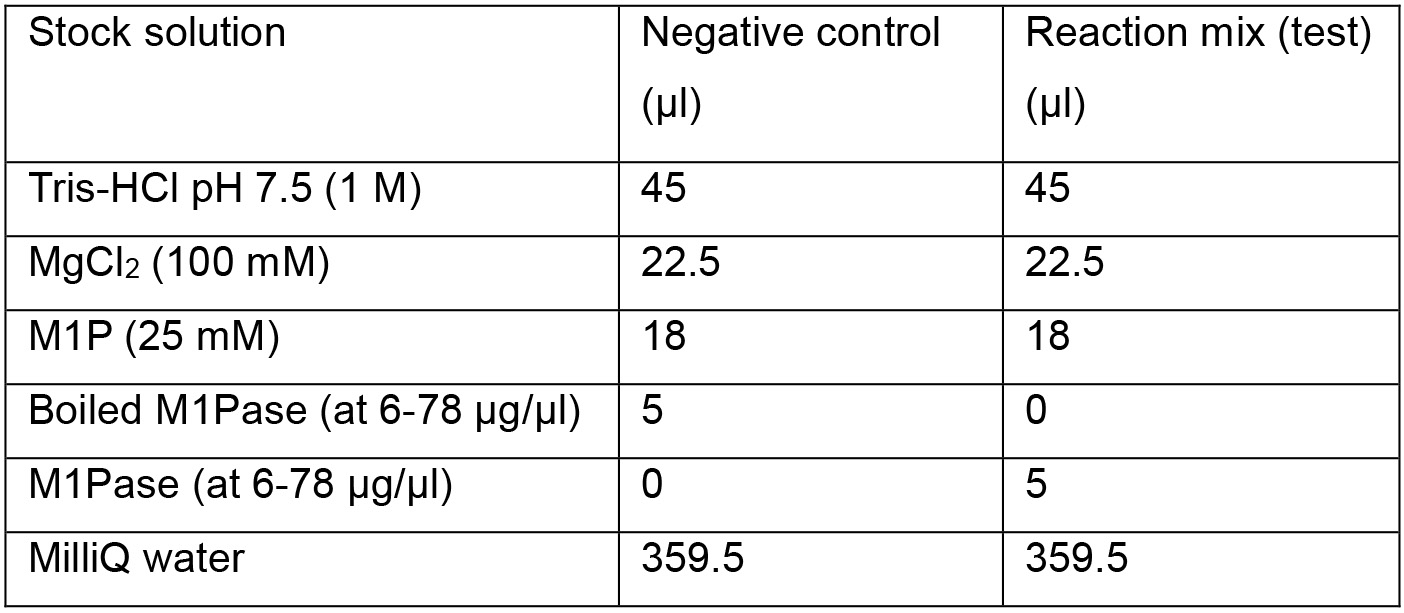
- The mix is prepared with water, Tris-HCl, MgCl2 and enzyme, then the reaction is started by adding the substrate, and incubation is conducted for 12 min, at 30 °C, with sampling every 3 min. For this, the volume of the reaction mixture is 450 μl, and 80 μl reaction mixture is sampled at t0, t3min, t6min, t9min and t12min. Each condition is tested in three replicates (Figure 2A).
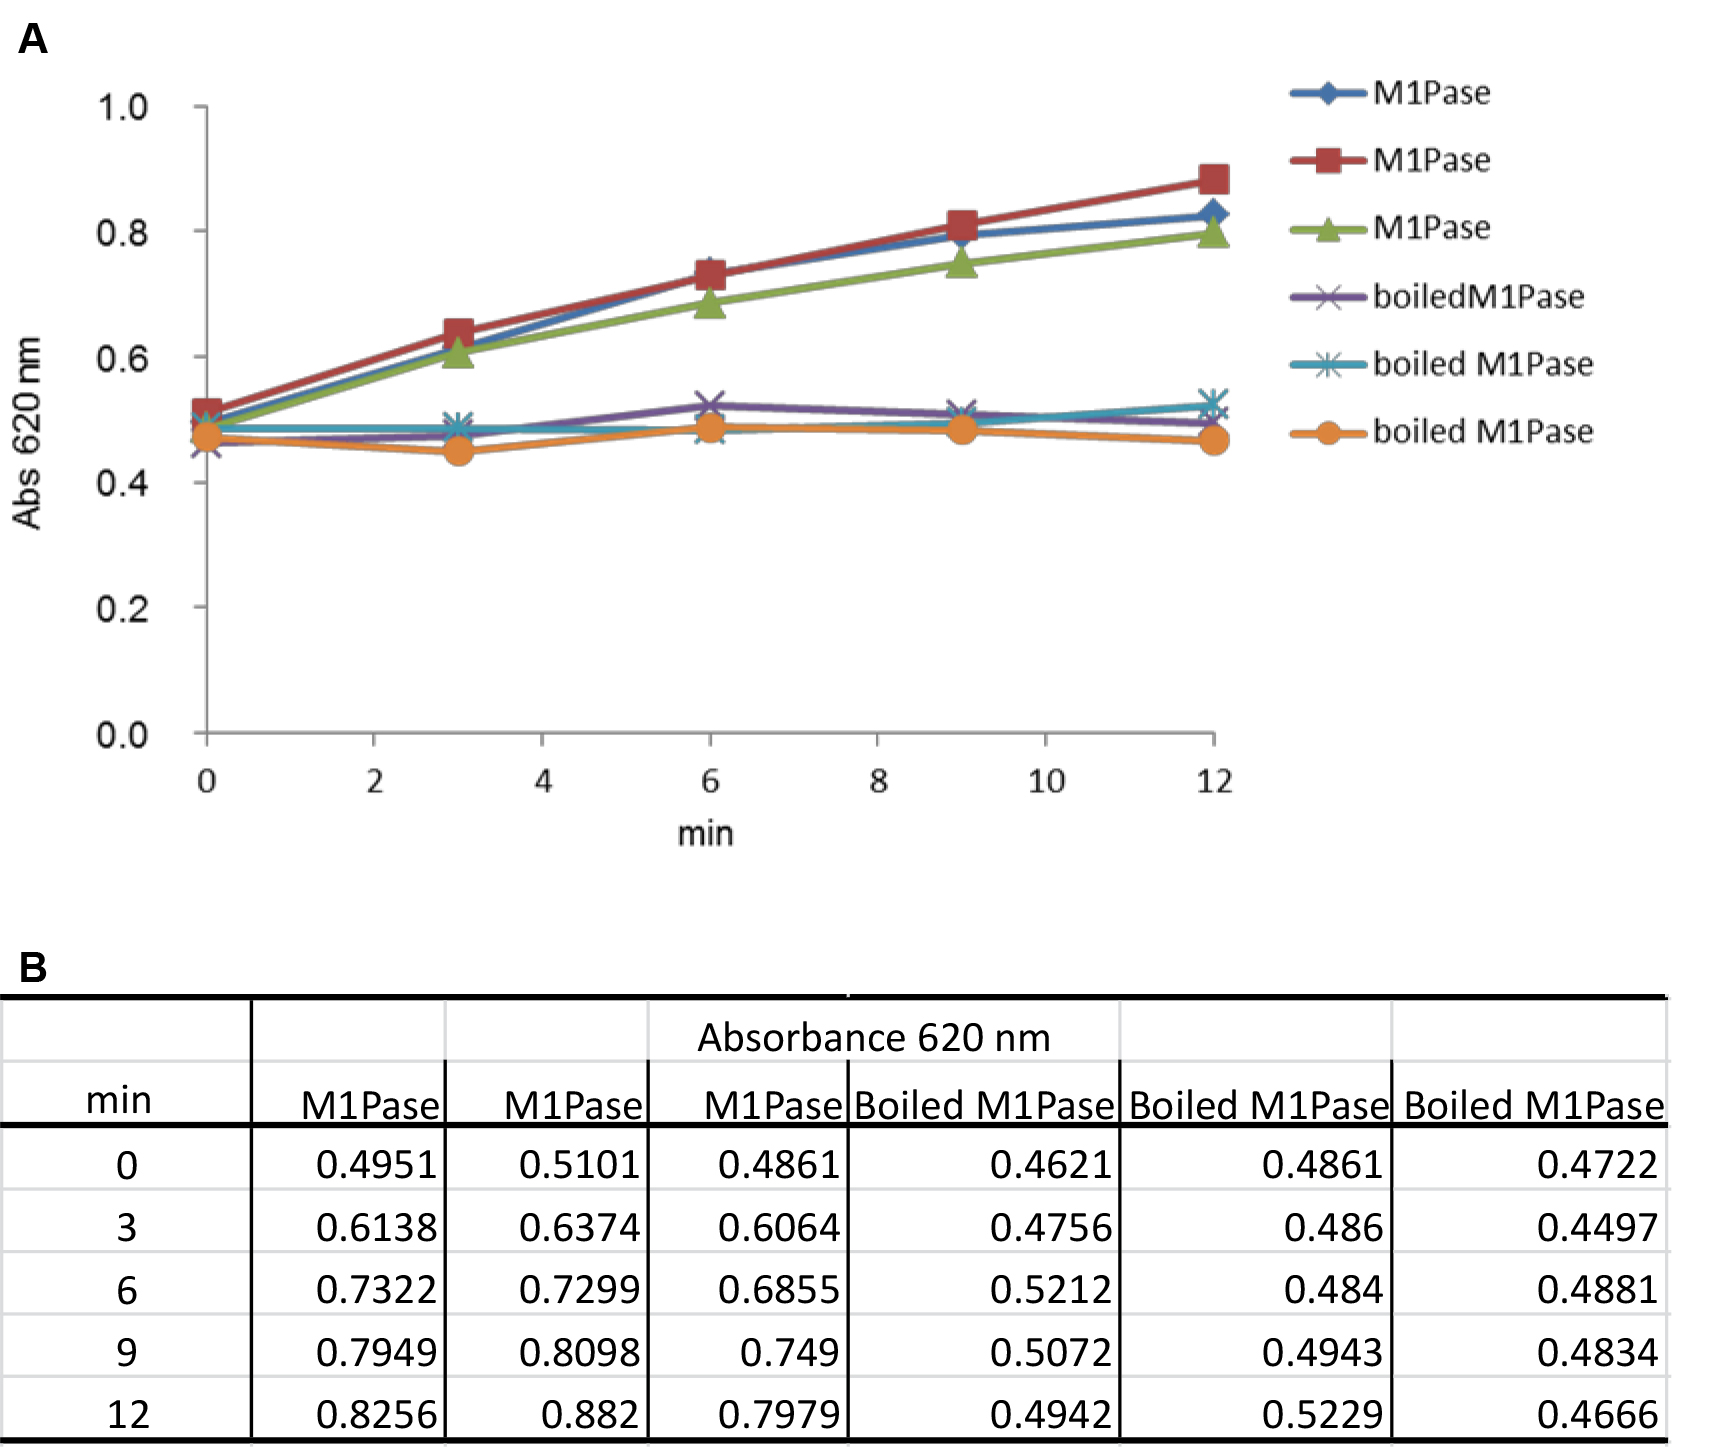
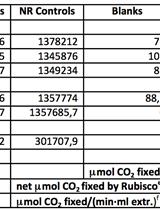
Figure 2. Measurement of absorbance at 620 nm as a function of time (min) in the presence of 1 mM M1P. A. The curves represent two series of triplicates containing 24 µg of purified M1Pase and 24 µg of boiled purified M1Pase, respectively. Abs 620 nm at t0 is taken just after the addition of M1P in the reaction mix. B. The table contains values of absorbance measured under both conditions tested and at different times of experiment.In each sample, reaction is stopped by adding 20 μl of malachite green reagent for subsequent determination of the quantity of phosphate released. To this aim, absorbance in each sample is read at 620 nm in a Safire2 UV spectrophotometer microplate reader after 20 min of incubation at room temperature (Figure 2B). Values are then compared with a standard curve of free phosphate prepared according to the malachite green phosphate assay kit manufacturer’s instructions (Figure 3).
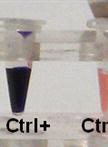
Figure 3. Use of the malachite green phosphate assay kit to determine free phosphate concentrations. A. Color formation was observed after 20 min of incubation at room temperature for different concentrations of phosphate (from well 1 to 8, 2 wells for each concentration): 0 μM, 4 μM, 8 μM, 12 μM, 16 μM, 24 μM, 32 μM and 40 μM (buffer only, 100 mM Tris-HCl pH 7.5, 5 mM MgCl2, final concentrations). B. Standard curve representing absorbance monitored at 620 nm as a function of variable quantities of free phosphate (Pi). In this example, the linear regression curve was Abs 620 nm = [0.0001 x (pmol Pi in 100 μl)] -0.0085, and R2 = 0.9985. C. Table corresponding to values of absorbance measured for different quantities of free phosphate. - Phosphatase activities, based on production of free phosphate, are calculated using the linear regression curve determined as in Figure 3:
[(ΔA620 nm test - ΔA620 nm negative control) + 0.0085]/(0.0001*t)
Where
ΔA620 nm = variation of absorbance during the duration of incubation
t = time of incubation (min)
One unit (U) of activity corresponds to 1 nmol of Pi released per min. - To calculate specific activities, divide the value obtained in the equation above by the quantity of proteins present in the sample. Perform three replicates for each assay, and determine the average ± standard error (S.E.) of these three replicates. From values given in Figure 2, specific activity of M1Pase was 11.30 U/mg in presence of 1 mM M1P.
- To determine substrate specificity, test M1Pase activity in the presence of each substrate listed in the “Materials and Reagents” section, using concentration ranging from 0.05 mM to 1 mM, at room temperature.
- To determine the optimal temperature, incubate the reaction mixtures used in step 1 at temperatures ranging, for instance, from 10 °C to 50 °C, with incremental of 5 or 10 °C. The experiments described below were performed at the optimal temperature of 30 °C.
- The effect of pH on the enzymatic activity of purified M1Pase is determined by using 100 mM Tris/HCl buffer whose pH ranged from 5.8 to 9, in presence of 5 mM MgCl2.
- To examine the influence of NaCl, add NaCl in the reaction mixture described in step 1 to obtain final concentrations ranging from 0 to 1 M.
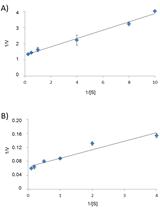
- To estimate the kinetic parameters of the enzyme for a selected substrate S, run individual enzyme reactions in the presence of at least five different concentrations of this substrate (for example: 0.08 mM, 0.12 mM, 0.18 mM, 0.27 mM, 0.4 mM, and 0.6 mM). Determine the initial reaction rate for each reaction and plot 1/V versus 1/[S] to obtain a Lineweaver-Burk plot, from which Km and Vm for S can be calculated (Figure 4). This calculation can be done using the Hyper32 software.
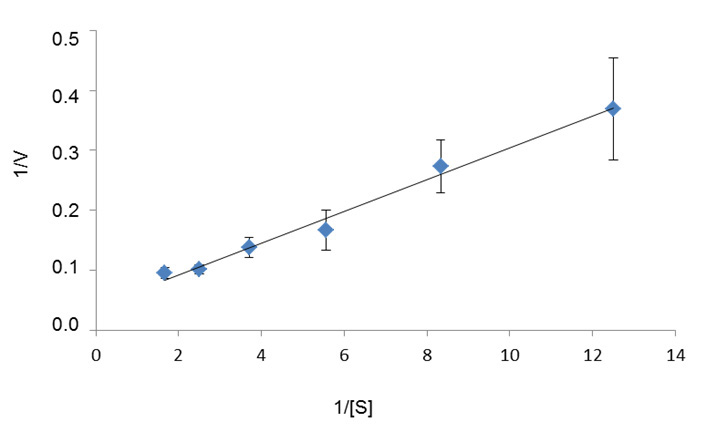
Figure 4. Lineweaver-Burk plot used to determine the Km (0.67 mM) and Vm (25.25 U/mg) of M1Pase for M1P. [S] is the M1P concentration (in mM) and V is the reaction rate (in U/mg of protein). Three replicates were performed for each assay.
Notes
- Respect the incubation time for each reaction. Samples taken from the reaction mixture at different times of incubations are kept on the ice until the end of the experiment. Then malachite is added for 20 min, before reading absorbance at 620 nm.
- Respect a time of 20 min at room temperature between the addition of malachite green and the reading of absorbance at 620 nm.
- Perform a standard curve for each change in the composition of the reaction mix, e.g., buffer, pH.
- This protocol can be used to detect M1Pase activity in a whole cell extract. However, it is necessary to be cautious when using the malachite green kit to quantify phosphate released by enzymes contained in cellular extracts because of possible interference caused by chemicals present in these extracts. It is also important to consider that cellular extracts may contain free phosphate that will be quantified by the malachite green kit.
Recipes
- 1 M Tris-HCl (pH 7.5)
- Dissolve 121.14 g of Trizma® base in around 800 ml of MilliQ water
- Adjust to pH 7.5 with HCl
- Complete to 1 liter with MilliQ water
- Filter through a 0.22 µm filter and store at room temperature
- 100 mM MgCl2
- Dissolve 95.21 mg of MgCl2 in 10 ml of MilliQ water
- Filter through a 0.22 µm filter and store at room temperature
- 5 M NaCl
- Dissolve 95.21 mg of NaCl in 10 ml of MilliQ water
- Filter through a 0.22 µm filter and store at room temperature
Acknowledgments
This work was supported by the French National Research Agency via the investment expenditure program IDEALG (ANR-10-BTBR-02). The authors also acknowledge funding from the Émergence-UPMC-2011 research program.
References
- Groisillier, A., Herve, C., Jeudy, A., Rebuffet, E., Pluchon, P. F., Chevolot, Y., Flament, D., Geslin, C., Morgado, I. M., Power, D., Branno, M., Moreau, H., Michel, G., Boyen, C. and Czjzek, M. (2010). MARINE-EXPRESS: taking advantage of high throughput cloning and expression strategies for the post-genomic analysis of marine organisms. Microb Cell Fact 9: 45.
- Groisillier, A., Shao, Z., Michel, G., Goulitquer, S., Bonin, P., Krahulec, S., Nidetzky, B., Duan, D., Boyen, C. and Tonon, T. (2014). Mannitol metabolism in brown algae involves a new phosphatase family. J Exp Bot 65(2): 559-570.
Article Information
Copyright
© 2016 The Authors; exclusive licensee Bio-protocol LLC.
How to cite
Groisillier, A. and Tonon, T. (2016). Determination of Recombinant Mannitol-1-phosphatase Activity from Ectocarpus sp.. Bio-protocol 6(16): e1896. DOI: 10.21769/BioProtoc.1896.
Category
Plant Science > Phycology > Protein > Activity
Biochemistry > Protein > Activity
Do you have any questions about this protocol?
Post your question to gather feedback from the community. We will also invite the authors of this article to respond.