- Protocols

- Articles and Issues
- For Authors
- About
- Become a Reviewer

Separation of Free and Bound cAMP in Mycobacteria


Published: Vol 6, Iss 14, Jul 20, 2016 DOI: 10.21769/BioProtoc.1879 Views: 8796
Reviewed by: Valentine V TrotterDarrell CockburnJoana Antunes
Original research article
The authors used this protocol in:
May 2015
Advertisement


Protocol Collections
Comprehensive collections of detailed, peer-reviewed protocols focusing on specific topics


Related protocols
Abstract
Mycobacterial genomes encode a plethora of genes that are involved in the synthesis, utilization and degradation of cAMP. The genome of M. tuberculosis H37Rv, for example, encodes 16 adenylyl cyclases and 10 genes harbouring the cyclic nucleotide-binding (CNB) domain (Shenoy and Visweswariah, 2006). Cyclic AMP is efficiently secreted by mycobacteria, and cytosolic as well as extracellular levels of cAMP can reach hundreds of micromolar. We have recently reported that an abundantly expressed universal stress protein (USP; Rv1636 in M. tuberculosis H37Rv and MSMEG_3811 in M. smegmatis, respectively) binds cAMP (Banerjee et al., 2015). Given the number of cAMP-binding proteins present in mycobacteria, it is expected that a significant fraction of intracellular cAMP may be bound to protein. The methods typically employed to measure cAMP are radioimmunoassay (RIA) and ELISA. However, these procedures include prior acidification of samples that would dissociate cAMP ‘bound’ to protein, and therefore represent the ‘total’ cAMP present in the sample. In this protocol, we describe a method to separate the fraction of cAMP ‘bound’ to protein from what is ‘free’ or not associated with protein. This is performed by subjecting the cytosolic fraction or the culture supernatant to filtration through a membrane with a 3 kDa cut-off. Only ‘free’ cAMP is able to pass through the membrane. Therefore, cAMP concentrations in the filtrate represent the ‘free’ cAMP in the sample. Cyclic AMP levels in the original cytosolic fraction or the culture supernatant represent the ‘total’ cAMP concentration. Subtracting the ‘free’ from the ‘total’ provides the amount of cAMP bound to protein.
Keywords: CAMPMaterials and Reagents
- 15 ml polypropylene centrifuge tubes (Thermo Fisher Scientific, NuncTM, catalog number: 339650 )
- 1.5 ml microcentrifuge tubes (Corning, Axygen®, catalog number: MCT-175-C )
- T25 polystyrene tissue culture treated flasks (Nest Biotechnology, catalog number: 707003 )
- T75 polystyrene tissue culture treated flasks (Nest Biotechnology, catalog number: 708003 )
- Amicon Ultra-0.5 ml 3-kDa centrifugal filter with Ultracel-3 membrane (Merck Millipore Corporation, catalog number: UFC500324 )
- 50 ml polypropylene centrifuge tubes (Thermo Fisher Scientific, NuncTM, catalog number: 339652 )
- Glass test tubes for growing 5 and 10 ml cultures.
- 96 well polystyrene plates (Sigma-Aldrich, product number: M2936 )
- 0.5 mm diameter glass beads (Bio Spec Products Inc, catalog number: 11079105 )
- 2 ml polypropylene bead beating vials (Bio Spec Products Inc, catalog number: 10831 )
- Mycobacterium smegmatis mc2 155 (ATCC, catalog number: 700084 )
- Mycobacterium bovis BCG (ATCC, catalog number: 35734 )
- Middlebrook 7H9 medium (BD Biosciences, catalog number: 271310 )
- Glycerol (Thermo Fisher Scientific, catalog number: 17904 )
- Magnesium sulfate (Merck Millipore Corporation, catalog number: 105886 )
- Tween 80 (Sigma-Aldrich, product number: P 4780 )
- 7H9-Glycerol-Tween 80 medium
- Oleic acid/albumin/dextrose/catalase (OADC) growth supplement (BD Biosciences, catalog number: 211886 )
- Bradford reagent (Sigma-Aldrich, catalog number: B6916 )
- Bovine serum albumin (BSA) (Sigma-Aldrich, catalog number: A2058 )
- Hydrochloric acid (HCl) (Fisher Scientific, catalog number: A144SI-212 )
- cAMP ELISA kit (Enzo Lifesciences, catalog number: ADI-900-067 )
- cAMP Direct Immunoassay Kit (Abcam plc, catalog number: ab65355 )
- Cyclic AMP Competitive ELISA Kit (Thermo Fisher Scientific, catalog number: EMSCAMPL )
- Sodium chloride (Merck Millipore Corporation, catalog number: 1064040500 )
- Potassium chloride (Merck Millipore Corporation, catalog number: 1049360500 )
- Di-Sodium hydrogen phosphate (Merck Millipore Corporation, catalog number: 1065860500 )
- Potassium dihydrogen phosphate (Merck Millipore Corporation, catalog number: 1048730250 )
- Tris(hydroxymethyl)aminomethane (Merck Millipore Corporation, catalog number: 1083820500 )
- 2-Mercaptoethanol (Sigma-Aldrich, product number: M6250 )
- Phenylmethylsulfonyl fluoride (Sigma-Aldrich, product number: PMSF-RO ROCHE)
- Phosphate buffered saline (see Recipes)
- Lysis buffer (see Recipes)
Equipment
Note: Biosafety level 2 (BSL 2) is required for culturing M. bovis BCG
- 37 °C incubator (humidified)/shaker (N-BIOTEK, model: NB-203QR /Eppendorf, New BrunswickTM Innova®, model: 40 )
- Spectrophotometer (Eppendorf, BioPhotometer®, model: D30 )
- Refrigerated centrifuge (Thermo Fisher Scientific, HeraeusTM MegafugeTM, model: 16R ) equipped with TX-400 Swinging Bucket Rotor (Thermo Fisher Scientific, model: TX-400 ) and adapter (number 20 & 23)
- Microcentrifuge (Thermo Fisher Scientific, model: MicroCL 17R )
- Vortexer (Bio-rad, model: BR-2000 )
- Plate reader (reads in the visible spectrum, including 405 and 595 nm) (Tecan, Infinite®, model: m200 PRO )
- Bead beater (BioSpec Products, model: Mini-Beadbeater-16 )
- Heating block (heats to 95 °C) (NeoLab)
- Ultra low temperature freezer (Panasonic, model: MDF-U33V-PE )
Software
- GraphPad Prism 5
Procedure
- Culturing M. smegmatis
- Inoculate 50 μl of M. smegmatis mc2 155 strain from glycerol stock [32.5% glycerol (v/v) and 50 mM MgSO4 in 7H9-Glycerol-Tween 80 medium] in 5 ml Middlebrook 7H9 medium supplemented with 0.2% glycerol and 0.05% Tween 80 and grow at 37 °C with shaking at 200 rpm until the culture reaches saturation (OD600 ~4, usually takes 3-4 days). This culture serves as the primary inoculum.
- Inoculate 10 ml (for log phase, OD600 ~1) and 5 ml (for stationary phase, OD600 ~3) of Middlebrook 7H9 media supplemented with 0.2% glycerol and 0.05% Tween 80 with the primary inoculum such that the starting OD600 is 0.05 and grow at 37 °C with shaking at 200 rpm.
- Once the 10 ml culture reaches OD600 ~1 (usually takes ~14 h), pellet 9 ml of culture by centrifuging at 3,000 x g for 10 min in a 15 ml centrifuge tube at 4 °C. Collect 1 ml of culture supernatant in a 1.5 ml microcentrifuge tube and keep in ice. Keep the cell pellet on ice after carefully and completely removing the rest of the supernatant.
- When the 5 ml culture reaches OD600 ~3 (usually takes ~18-20 h), pellet 3 ml of culture by centrifuging at 3,000 x g for 10 min in a 15 ml centrifuge tube at 4 °C. Collect 1 ml of culture supernatant in a 1.5 ml microcentrifuge tube and keep in ice. Keep the cell pellet on ice after carefully and completely removing the rest of the supernatant.
- Inoculate 50 μl of M. smegmatis mc2 155 strain from glycerol stock [32.5% glycerol (v/v) and 50 mM MgSO4 in 7H9-Glycerol-Tween 80 medium] in 5 ml Middlebrook 7H9 medium supplemented with 0.2% glycerol and 0.05% Tween 80 and grow at 37 °C with shaking at 200 rpm until the culture reaches saturation (OD600 ~4, usually takes 3-4 days). This culture serves as the primary inoculum.
- Culturing M. bovis BCG
- Inoculate 50 μl of M. bovis BCG from glycerol stock [32.5% glycerol (v/v) and 50 mM MgSO4 in 7H9-Glycerol-Tween 80-OADC medium] in 5 ml Middlebrook 7H9 medium supplemented with 0.2% glycerol and 0.05% Tween 80 containing 10% (v/v) OADC in a T25 tissue culture flask and grow at 37 °C in a humidified incubator as static cultures. Once the culture reaches saturation (OD600 ~4, usually takes 12-14 days), use it as the primary inoculum.
- Inoculate 20 ml (for log phase, OD600 ~1) and 10 ml (for stationary phase, OD600 ~3) of Middlebrook 7H9 media supplemented with 0.2% glycerol and 0.05% Tween 80 containing 10% (v/v) OADC with the primary inoculum such that the starting OD600 is 0.1 in T75 and T25 tissue culture flasks, respectively. Grow at 37 °C in a humidified incubator as static cultures.
- Once the 20 ml culture reaches OD600 ~1 (usually takes ~7-8 days), pellet 18 ml of culture by centrifuging at 3,000 x g for 10 min in a 50 ml centrifuge tube at 4 °C. Collect 1 ml of culture supernatant in a 1.5 ml microcentrifuge tube and keep in ice. Keep the cell pellet on ice after carefully and completely removing the rest of the supernatant.
- When the 10 ml culture reaches OD600 ~3 (usually takes ~14-15 days), pellet 6 ml of culture by centrifuging at 3,000 x g for 10 min in a 15 ml centrifuge tube at 4 °C. Collect 1 ml of culture supernatant in a 1.5 ml microcentrifuge tube and keep in ice. Keep the cell pellet on ice after carefully and completely removing the rest of the supernatant.
- Inoculate 50 μl of M. bovis BCG from glycerol stock [32.5% glycerol (v/v) and 50 mM MgSO4 in 7H9-Glycerol-Tween 80-OADC medium] in 5 ml Middlebrook 7H9 medium supplemented with 0.2% glycerol and 0.05% Tween 80 containing 10% (v/v) OADC in a T25 tissue culture flask and grow at 37 °C in a humidified incubator as static cultures. Once the culture reaches saturation (OD600 ~4, usually takes 12-14 days), use it as the primary inoculum.
- Separating free and bound cAMP in the cytosolic fraction (identical for both M. smegmatis and M. bovis BCG)
- Add 400 μl of cold phosphate buffered saline to the cell pellets and resuspend the cells either by vortexing or pipetting up and down several times. Transfer the cell suspension to a new 1.5 ml microcentrifuge tube.
- Pellet the cells by centrifuging at 3,000 x g for 10 min at 4 °C and discard the supernatant.
- Repeat the wash step once more as in steps C1 and C2
- Resuspend the cells in 400 μl lysis buffer.
- Add ~0.3 g glass beads to new bead beating vials and transfer the cell suspensions to the vials, respectively. Keep bead beating vials in ice.
- Lyse cells by bead beating (30 sec pulse with 3,450 oscillations/min, 6 times). Keep vials in ice between each cycle of bead beating.
- Centrifuge bead beating vials at 1,000 x g for 1 min at 4 °C and transfer the lysate to a new 1.5 ml microcentrifuge tube.
- Centrifuge the lysate at 17,000 x g for 20 min at 4 °C. Transfer the supernatant to a new 1.5 ml microcentrifuge tube and keep in ice. This serves as the cytosolic fraction.
- Protein concentration in the cytosolic fraction can be measured using a microplate-based Bradford method (Any other method can also be used.). Bovine serum albumin (BSA) is used as a standard in the Bradford assay.
- Transfer cytosolic fraction corresponding to 400 μg protein to an Amicon 0.5 ml 3 kDa cut-off centrifugal filter and centrifuge at 14,000 x g for 10-15 min at 4 °C. Collect 40 μl of the filtrate and transfer to a new 1.5 ml microcentrifuge tube and add equal volume of 0.2 N HCl (final concentration 0.1 N). Heat the sample for 10 min at 95 °C in a heating block and store at -70 °C until cAMP measurement. This fraction will provide the ‘free’ cAMP concentration in the cytosolic fraction.
Note: The sample can be stored at -70 °C after heating at 95 °C if cAMP measurement is to be performed at a later point of time. Otherwise, the sample can be directly used to measure cAMP post heating. - Collect 40 μl of the neat cytosolic fraction (from step C8) in a new 1.5 ml microcentrifuge tube and add equal volume of 0.2 N HCl (final concentration 0.1 N). Heat the sample for 10 min at 95 °C in a heating block and store at -70 °C until cAMP measurement. This fraction will provide the ‘total’ cAMP concentration in the cytosolic fraction.
- Add 400 μl of cold phosphate buffered saline to the cell pellets and resuspend the cells either by vortexing or pipetting up and down several times. Transfer the cell suspension to a new 1.5 ml microcentrifuge tube.
- Separating free and bound cAMP in the culture supernatant (identical for both M. smegmatis and M. bovis BCG)
- Transfer 400 μl of culture supernatants previously collected (see steps A3 and A4, B4 and B5 in Procedure) to Amicon 0.5 ml 3 kDa cut-off centrifugal filters and centrifuge at 14,000 x g for 10-15 min at 4 °C. Collect 150 μl of the filtrate and transfer to a new 1.5 ml microcentrifuge tube and add equal volume of 0.2 N HCl (final concentration 0.1 N). Heat the sample for 10 min at 95 °C in a heating block and store at -70 °C until cAMP measurement. This fraction will provide the ‘free’ extracellular cAMP concentration in the culture supernatant.
- Transfer 150 μl of culture supernatant (from steps A3 and A4, B4 and B5) to a new 1.5 ml microcentrifuge tube and add equal volume of 0.2 N HCl (final concentration 0.1 N). Heat the sample for 10 min at 95 °C in a heating block and store at -70 °C until cAMP measurement. This fraction will provide the ‘total’ extracellular cAMP concentration in the culture supernatant.
- Transfer 400 μl of culture supernatants previously collected (see steps A3 and A4, B4 and B5 in Procedure) to Amicon 0.5 ml 3 kDa cut-off centrifugal filters and centrifuge at 14,000 x g for 10-15 min at 4 °C. Collect 150 μl of the filtrate and transfer to a new 1.5 ml microcentrifuge tube and add equal volume of 0.2 N HCl (final concentration 0.1 N). Heat the sample for 10 min at 95 °C in a heating block and store at -70 °C until cAMP measurement. This fraction will provide the ‘free’ extracellular cAMP concentration in the culture supernatant.
- Measurement of cAMP
- Take suitable aliquots of the samples and measure cAMP concentrations in each fraction either by radioimmunoassay (Dass et al., 2008) or ELISA procedures [kits can be used from Enzo Lifesciences (ADI-900-067), Abcam (ab65355) or Thermo Fisher Scientific (EMSCAMPL)].
- Express cytosolic ‘total’ (fraction collected in stepC11) and ‘free’ (fraction collected in stepC10) cAMP as ‘pmoles cAMP/100 μg protein’, and calculate the cytosolic ‘bound’ cAMP by subtracting the cAMP concentration in the ‘free’ from the concentration in the ‘total’.
- Express the extracellular ‘total’ (fraction collected in stepD2) and ‘free’ (fraction collected in stepD1) cAMP as ‘pmoles cAMP ml-1’, and calculate the extracellular ‘bound’ cAMP by subtracting the cAMP concentration in the ‘free’ from the concentration in the ‘total’.
- Take suitable aliquots of the samples and measure cAMP concentrations in each fraction either by radioimmunoassay (Dass et al., 2008) or ELISA procedures [kits can be used from Enzo Lifesciences (ADI-900-067), Abcam (ab65355) or Thermo Fisher Scientific (EMSCAMPL)].
Representative data
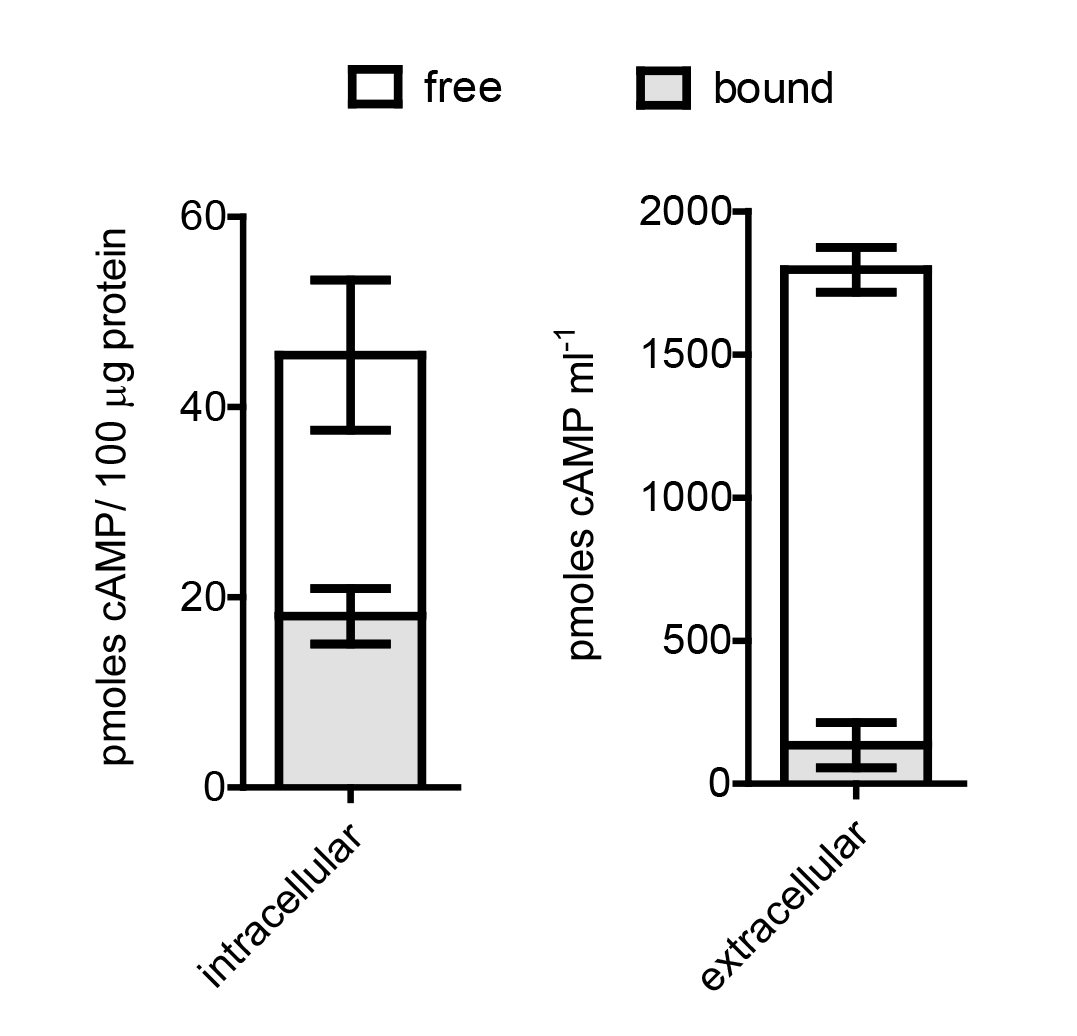
Figure 1. Free and bound cAMP in M. smegmatis. Free (white) and bound (gray) cAMP levels were measured from log phase cultures of M. smegmatis for both intracellular and extracellular fractions. The sum of free and bound levels represent the total cAMP. Mean and Standard Error of the Mean (SEM) were plotted for three biological replicates using GraphPad Prism 5. SEM was calculated by dividing the standard deviation (SD) by the square root of N, where N is the number of independent determinations. SD = ![]() , where
, where ![]() is the sample mean.
is the sample mean.
Notes
- Once cells are lysed, all steps should be carried out at 4 °C and samples kept in ice between all steps.
- As cAMP may dissociate from protein over time, the steps after lysis till the filtration with the Amicon membrane should be performed without delay.
Recipes
- Phosphate buffered saline
0.8% NaCl
0.02% KCl
0.142% Na2HPO4
0.024% KH2PO4 - Lysis buffer
50 mM Tris-Cl (pH 8.2)
100 mM NaCl
10 mM 2-mercaptoethanol (2-ME)
10% (v/v) glycerol
1 mM phenylmethylsulphonyl fluoride (PMSF)
Acknowledgments
This protocol is adapted from the original method described in Banerjee et al. (2015). A.B. is supported by Senior Research Fellowship from the Council of Scientific & Industrial Research, Government of India. S.S.V. is a recipient of a J.C. Bose National Fellowship from the Department of Science & Technology, Government of India. This work was supported by the Department of Biotechnology, Government of India.
References
- Banerjee, A., Adolph, R. S., Gopalakrishnapai, J., Kleinboelting, S., Emmerich, C., Steegborn, C. and Visweswariah, S. S. (2015). A universal stress protein (USP) in mycobacteria binds cAMP. J Biol Chem 290(20): 12731-12743.
- Dass, B. K., Sharma, R., Shenoy, A. R., Mattoo, R. and Visweswariah, S. S. (2008). Cyclic AMP in mycobacteria: characterization and functional role of the Rv1647 ortholog in Mycobacterium smegmatis. J Bacteriol 190(11): 3824-3834.
- Shenoy, A. R. and Visweswariah, S. S. (2006). New messages from old messengers: cAMP and mycobacteria. Trends Microbiol 14(12): 543-550.
Article Information
Copyright
© 2016 The Authors; exclusive licensee Bio-protocol LLC.
How to cite
Readers should cite both the Bio-protocol article and the original research article where this protocol was used:
- Banerjee, A. and Visweswariah, S. S. (2016). Separation of Free and Bound cAMP in Mycobacteria. Bio-protocol 6(14): e1879. DOI: 10.21769/BioProtoc.1879.
- Banerjee, A., Adolph, R. S., Gopalakrishnapai, J., Kleinboelting, S., Emmerich, C., Steegborn, C. and Visweswariah, S. S. (2015). A universal stress protein (USP) in mycobacteria binds cAMP. J Biol Chem 290(20): 12731-12743.
Category
Microbiology > Microbial physiology
Microbiology > Microbial signaling > Secondary messenger
Biochemistry > Other compound > cAMP
Do you have any questions about this protocol?
Post your question to gather feedback from the community. We will also invite the authors of this article to respond.