- Protocols

- Articles and Issues
- For Authors
- About
- Become a Reviewer

Procedure for Rhamnolipids Quantification Using Methylene-blue

Published: Vol 6, Iss 7, Apr 5, 2016 DOI: 10.21769/BioProtoc.1783 Views: 16383
Reviewed by: Valentine V TrotterAlexander B. WestbyeAnonymous reviewer(s)
Original research article
The authors used this protocol in:

Jul 2015
Advertisement

Protocol Collections
Comprehensive collections of detailed, peer-reviewed protocols focusing on specific topics


Related protocols

Abstract
Rhamnolipids produced by Pseudomonas aeruginosa (P. aeruginosa) represent a group of biosurfactants with various applications (e.g., bioremediation of oil spills, cosmetics, detergents and cleaners). The commonly used colorimetric methods for rhamnolipid quantification, including anthrone, phenol−sulfuric acid and orcinol based quantification (Helbert and Brown, 1957; Chandrasekaran and BeMiller, 1980), are laborious and operationally hazardous because of the strong acid/chemical emanation which can cause deterioration of instruments measurements (e.g., spectrophotometer). Therefore, the methylene-blue-based analysis appears as a promising alternative to safely quantify whole rhamnolipid molecules based on chemical complexation reaction (Pinzon and Ju, 2009). Indeed, methylene blue and rhamnolipids form a complex in a water-chloroform phase system. The rhamnolipids-methylene blue complex is partitioned into the chloroform phase which will develop a blue color that can be quantified at 638 nm to deduce rhamnolipids concentration. Here, we describe a variant of methylene-blue-based rhamnolipids quantification procedure that allows spectrophotometric quantification on standard 96-well plastic microplate contrarily to original methylene blue procedure that requires specific and expensive microplate due to chloroform chemical properties.
Keywords: RhamnolipidsMaterials and Reagents
- Borate Buffer Packs BupHTM (Thermo Fisher scientific, catalog number: 28384 )
- Centrifuge round bottom reaction tubes (30 ml) (Krackeler Scientific, COREX®, catalog number: 1-8445-30 )
- Greiner CELLSTAR® 96 well plates (clear polystyrene wells flat bottom) (Sigma-Aldrich, catalog number: M3687-60 EA )
- Microcentrifuge tube [2 ml, transparent polypropylene (PP) with Lid] (Sigma-Aldrich, Brand®, catalog number: Z628034-500 EA )
- Sterile culture tube (PP) (14 ml) (The Lab Depot Inc., catalog number: TLDT8235 )
- Centrifugal Filter (0.1 µm pore size, Non-Sterile) with Durapore® PVDF Membrane UFC40VV25 Ultrafree® (2 ml) (Merck Millipore Corporation, catalog number: UFC40VV25 )
- Aluminium foil
- Micropipettor (10 µl,100 µl and 1,000 µl) tips
- Pseudomonas aeruginosa (P. aeruginosa) PAO1 Wild-type (strain PAO0001) (http://www.pseudomonas.med.ecu.edu/)
- Chloroform (≥ 99% ) (Carl Roth GmbH & Co. KG, catalog number: 3313.1 )
- Ethyl acetate (> 99.5%) (Merck Millipore Corporation, EMSURE®, catalog number: 1096231000 )
- Hydrochloric acid (HCl) standard (1 N solution) (Sigma-Aldrich, Fluka analytical, catalog number: 318949-500 ml )
- HCl standard (0.2 N solution in water) (Sigma-Aldrich, Fluka analytical, catalog number: 343102-500 ml )
- Luria Bertani (LB) Broth (Lennox) Powder microbial growth medium (Sigma-Aldrich, catalog number: L3022-250 G )
- Methylene blue solution [1.4% (w/v) in 95% ethanol] (Sigma-Aldrich, catalog number: 1808-50 ml )
- 3-(N-morpholino) propanesulfonic acid (MOPS) (99.5%) (Sigma-Aldrich, catalog number: M1254-100 G )
- Rhamnolipids (90%, Standard) (Sigma-Aldrich, catalog number: R90 )
- Sodium hydroxide (NaOH) solution
- LB-MOPS broth (see Recipes)
- Borax buffer (50 mM) (see Recipes)
- Methylene blue aqueous solution (see Recipes)
Equipment
- Micropipettor (100 µl-1,000 µl)
- Micropipettor (10 µl-100 µl)
- Autoclave
- Stopwatch
- Measuring Pipette (5 ml) (Jaytec Glass Limited, catalog number: WJ.485 )
- 96-well microplate spectrophotometer (e.g. Molecular Devices, model: SpectraMax M2 device )
- Vacuum concentrator (e.g. Savant SPEEDVAC SVC 200H: 200 x g)
- Tabletop centrifuge
- Vortex mixer
Procedure
- P. aeruginosa PAO1 culture and rhamnolipids extraction
- P. aeruginosa PAO1 was grown with agitation (175 rpm) at 37 °C for 18 h in a sterile culture tube (14 ml) containing 5 ml LB-MOPS medium (initial A600 of the culture was between 0.020 and 0.025).
- After incubation, culture of P. aeruginosa in mid-stationary phase was centrifuged (3,200 x g, 24 °C, 5 min) to obtain supernatant and pellet. 4 ml of supernatant was filtered (0.1 µm filters, 20 x g) to remove cells. Then, pH of cell-free supernatant was adjusted to 2.3 ± 0.2 using 1 N HCl (≈ 80 µl).
- Rhamnolipids were extracted by mixing 4 ml of supernatant with 4 ml of ethyl acetate. The non-miscible mixture was vigorously vortexed (600 rpm) for 20 sec and phase separation was realized by centrifugation in a tabletop centrifuge at speed 100 x g for 1 min.
- The upper, rhamnolipid-containing organic/ethyl acetate phase was transferred to a new reaction tube (30 ml). Ethyl acetate phase should be carefully removed without taking any liquid from the top aqueous layer.
- Extraction procedure was repeated three times and ethyl acetate extracts were combined in the reaction tube and evaporated to dryness in speedvac centrifugal evaporator (generally evaporated in 30 min at 200 x g speed) and immediately quantified.
- P. aeruginosa PAO1 was grown with agitation (175 rpm) at 37 °C for 18 h in a sterile culture tube (14 ml) containing 5 ml LB-MOPS medium (initial A600 of the culture was between 0.020 and 0.025).
- Rhamnolipids quantification
- Formation of chloroform-methylene blue complex
Dry rhamnolipid-extract was dissolved in 4 ml chloroform and mixed with 400 µl methylene blue solution (freshly prepared). Tubes were vigorously mixed by vortexing for 5 min, then incubated at ambient temperature for 15 min to allow for color formation.
Note: The chloroform phase will develop a blue color, proportional to the concentration of rhamnolipids. Cover tubes with aluminum foil to minimize chloroform evaporation during incubation [Figure 1(d)].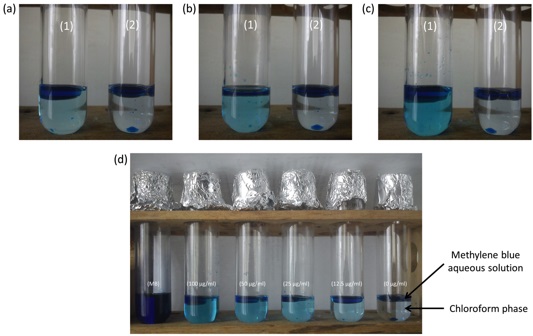
Figure 1. Expected results during chemical complexation reaction step. (a). Methylene blue complexation in chloroform containing 100 µg/ml of rhamnolipids (1) and chloroform without rhamnolipids (2) at T5 min. (b). Methylene blue complexation in chloroform containing 100 µg/ml of rhamnolipids (1) and chloroform without rhamnolipids (2) at T10 min. (c). Methylene blue complexation in chloroform containing 100 µg/ml of rhamnolipids (1) and chloroform without rhamnolipids (2) at T15 min. (d). Methylene blue aqueous solution (MB) and chloroform containing 100 µg/ml, 50 µg/ml, 25 µg/ml, 12.5 µg/ml and 0 µg/ml of rhamnolipids complexed with methylene blue. T represents incubation time for complexation. - Measurements step
One ml of the chloroform (lower) phase was transferred in a clear microcentrifuge tube (2 ml) and mixed by vortexing for 20 sec with 500 µl of HCl 0.2 N. Phase separation was then realized by centrifugation in a tabletop centrifuge at speed 100 x g for 1 min and the solution was left at room temperature for 10 min to optimize methylene blue extraction in HCl. Finally, 200 µl of the upper acidic phase, containing a portion of the complexed methylene blue, was transferred in a 96-well microplate and the absorbance was measured at 638 nm with SpectraMax M2 device against an HCl 0.2 N blank. - Rhamnolipids calibration curve generation
Rhamnolipids standard solution was prepared by dissolving 8 mg of rhamnolipids in 4 ml of chloroform. This solution is used to generate different concentration of rhamnolipids by dilution in chloroform (i.e. 12.5 µg/ml, 25 µg/ml, 50 µg/ml, 100 µg/ml and 200 µg/ml). For each concentration, formation of chloroform-methylene blue complex and measurements steps were carried out to generate calibration curve equation (Figure 2; Table 1).
- Formation of chloroform-methylene blue complex
Representative data
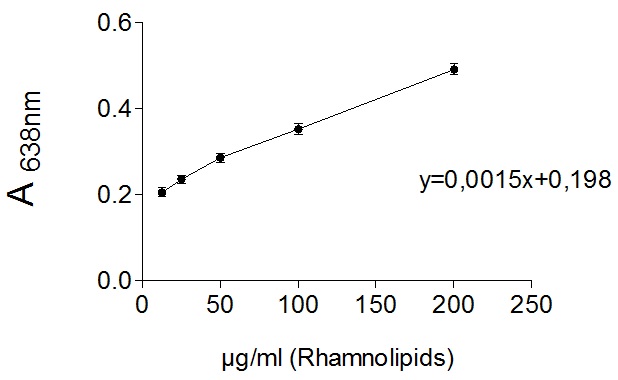
Figure 2. Expected calibration curve of different concentration of rhamnolipid (12.5 µg/ml, 25 µg/ml, 50 µg/ml, 100 µg/ml and 200 µg/ml). Absorbance of complexed methylene blue was measured at 638 nm with SpectraMax M2 device against an HCl (0.2 N) blank. Complexation and measurements were repeated three times and error bars represent the standard error of the mean.
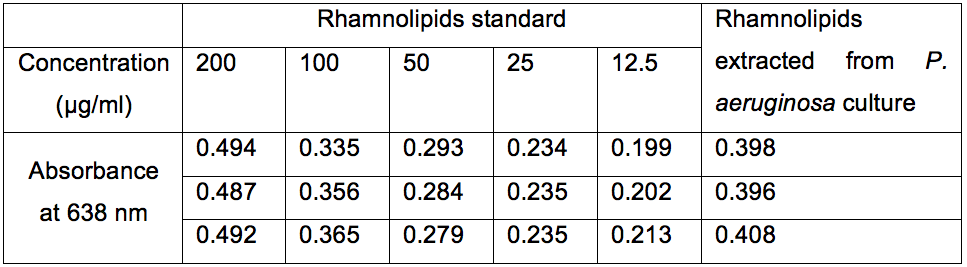
Table 1. Absorbance of complexed methylene blue measured at 638 nm with SpectraMax M2 device against an HCl (0.2 N) blank
The applicability of methylene blue rhamnolipid method was previously verified by comparison of the analysis results with those obtained from the commonly used anthrone reaction technique (Pinzon and Ju, 2009). We show in Table 2 the main difference between both methods that highlighted the advantages of methylene blue rhamnolipid method.
Table 2. Comparative table between methylene blue rhamnolipid and anthrone methods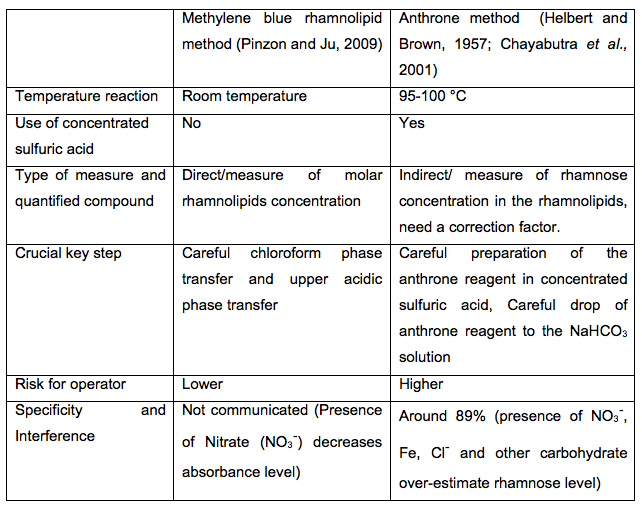
Notes
- Incubation time for blue color development in chloroform phase should be equal for each tested sample.
- During chloroform phase transfer avoid touching the methylene blue solution with tips (Video 1).
 Video 1. Lower chloroform phase transfer and upper acidic phase transfer
 - During upper acidic phase transfer, avoid pipetting chloroform which will attack/dissolve 96-well microplate. For that, prefer a clear microcentrifuge tube or transfer the chloroform/HCl solution into a clear tube for better visualization of the separated phase before pipetting the upper acidic phase. Check that all wells are free of chloroform before absorbance measurement.
- During all transfer phases use new tips for each sample.
Recipes
- LB-MOPS broth
Add 25 g of dry LB powder and 10 g of MOPS to 1,000 ml of deionized water
Adjust pH to 7.2 ± 0.2 by adding NaOH solution
Autoclave for sterilization - Borax buffer solution
Dissolve one borate buffer pack in 500 ml of deionized water (each pack makes 50 mM borate, pH 8.5)
Store at 2-8 °C - Methylene blue aqueous solution
Add 200 µl of methylene blue solution to 4.8 ml of deionized water
Adjust pH to 8.6 ± 0.2 by adding 15 µl of a 50 mM borax buffer
Store at room temperature
Acknowledgments
This protocol was adapted from the previously published studies (Pinzon and Ju, 2009). This work was supported by the project PIC-Madagascar 2009 and the postdoctoral fellowship program “ELAN 2015” of the ARES-CCD (Académie de Recherche et d’Enseignement Supérieur-Commission Coopération au Développement, Belgium). We declare no conflict of interest.
References
- Chayabutra, C., Wu, J. and Ju, L. K. (2001). Rhamnolipid production by Pseudomonas aeruginosa under denitrification: effects of limiting nutrients and carbon substrates. Biotechnol Bioeng 72(1): 25-33.
- Chandrasekaran, E. V. and BeMiller, J. N. (1980). In: Whistler, R. L. (ed). Methods in carbohydrate chemistry. Academic press, p 89.
- Helbert, J. R. and Brown, K. D. (1957). Color reaction of anthrone with monosaccharide mixtures and oligo- and polysaccharides containing hexuronic acids. Anal Chem 29:1464-1466.
- Pinzon, N. M. and Ju, L. K. (2009). Analysis of rhamnolipid biosurfactants by methylene blue complexation. Appl Microbiol Biotechnol 82(5): 975-981.
Article Information
Copyright
© 2016 The Authors; exclusive licensee Bio-protocol LLC.
How to cite
Rasamiravaka, T., Vandeputte, O. M. and Jaziri, M. E. (2016). Procedure for Rhamnolipids Quantification Using Methylene-blue. Bio-protocol 6(7): e1783. DOI: 10.21769/BioProtoc.1783.
Category
Microbiology > Microbial biochemistry > Lipid
Biochemistry > Lipid > Extracellular lipids
Biochemistry > Lipid > Lipid measurement
Do you have any questions about this protocol?
Post your question to gather feedback from the community. We will also invite the authors of this article to respond.