- Protocols

- Articles and Issues
- For Authors
- About
- Become a Reviewer

Measurement of 2-methylthio Modifications in Mitochondrial Transfer RNAs by Reverse-transcription Quantitative PCR

Published: Vol 6, Iss 1, Jan 5, 2016 DOI: 10.21769/BioProtoc.1695 Views: 9550
Reviewed by: Masahiro MoritaYannick DebingAnonymous reviewer(s)
Original research article
The authors used this protocol in:

Mar 2015
Advertisement


Protocol Collections
Comprehensive collections of detailed, peer-reviewed protocols focusing on specific topics


Abstract
2-Methylthio-N6-isopentenyladenosine (ms2i6A) is an evolutionally conserved posttranscriptional modification found at position 37 of four mammalian mitochondrial tRNAs, mt-tRNASer(UCN), mt-tRNATrp, mt-tRNAPhe and mt-tRNATyr. The ms2 modification in ms2i6A strengthens codon-anticodon interaction and contributes to accurate and efficient decoding. Deficiency of ms2 modifications impairs mitochondrial protein synthesis, which ultimately leads to the development of myopathy in mice and patients having mitochondrial diseases. Therefore, the level of ms2 could be utilized as an indicator that reflects the status of mitochondrial protein synthesis. Here, we describe a simple and fast quantitative PCR-based method to measure the ms2 level in total RNA sample.
Keywords: TRNAMaterials and Reagents
- Total RNA (200 ng~1 ng)
Note: We have been using 50~200 ng RNA as the starting materials. To compare the results between experiments, it is recommended to use same amount of RNA in all experiments.
It is recommended to use a method that can purify small RNAs [e.g., TRIzol (Invitrogen, catalog number: 15596-018 ) or miRNeasy Mini Kit (QIAGEN, catalog number: 217004 ). Check the purity of RNA by a spectrophotometer. For consistency of experiments, always use RNA with an A260/A280 ratio > 1.8.
Note: Currently, TRIzol is from “Thermo Fisher Scientific, AmbionTM, catalog number: 15596-018”. - PCR grade distilled water
- Microtubes for PCR and real-time PCR (MicroAmp® Optical 8-Cap Strip) (Thermo Fisher Scientific, Applied Biosystems®, catalog number: 4323032 )
- DNase I (10x buffer is provided along with the enzyme) (Roche Diagnostics, catalog number: 04716728001 )
- Reverse transcription reagent (Transcriptor First Strand cDNA Synthesis kit) (Roche Diagnostics, catalog number: 04897030001 )
Critical Point: It is recommended to use Transcriptor First Strand cDNA Synthesis kit for measurement of ms2 modification. Compared with other reverse transcription kits, this kit gives the highest dynamic range. - Real-time PCR reagent (SYBR Premix Ex Taq II) (TAKARA BIO INC., catalog number: RR820S )
Note: SYBR green based PCR reagents from other companies work equally well. - Primers for detecting mitochondrial ms2 modifications in human RNA samples
- Hu_tRNAPhe primer f1: CTCCTCAAAGCAATACACTG
- Hu_tRNAPhe primer r1: AGCCCGTCTAAACATTTTCA
- Hu_tRNAPhe primer r2: GGGTGATGTGAGCCCGTCTA
- Hu_tRNASerUCN primer f1: GAGGCCATGGGGTTGG
- Hu_tRNASerUCN primer r1: CCCAAAGCTGGTTTCAAGC
- Hu_tRNASerUCN primer r2: AATCGAACCCCCCAAAGC
- Hu_tRNATrp primer f1: GGTTAAATACAGACCAAGAGC
- Hu_tRNATrp primer r1: CAACTTACTGAGGGCTTTGAA
- Hu_tRNATrp primer r2: TTAAGTATTGCAACTTACTGAGG
- Hu_tRNATyr primer f1: GCTGAGTGAAGCATTGGACT
- Hu_tRNATyr primer r1: AACCCCTGTCTTTAGATTTACA
- Hu_tRNATyr primer r2: AGAGGCCTAACCCCTGTCTT
- Hu_tRNAPhe primer f1: CTCCTCAAAGCAATACACTG
- Primers for detecting mitochondrial ms2 modification in mouse RNA samples
- Ms_tRNAPhe primer f1: GCTTAATAACAAAGCAAAGCA
- Ms_tRNAPhe primer r1: TATCCATCTAAGCATTTTCA
- Ms_tRNAPhe primer r2: TGGGATACAATTATCCATCT
- Ms_tRNASerUCN primer f1: CATATAGGATATGAGATTGGC
- Ms_tRNASerUCN primer r1: AACCCCCTAAAATTGGTTTCA
- Ms_tRNASerUCN primer r2: GAAGGAATCGAACCCCCTAA
- Ms_tRNATrp primer f1: GGATATACTAGTCCGCGAGC
- Ms_tRNATrp primer r1: GTGTTTTCTTAGGGCTTTGA
- Ms_tRNATrp primer r2: GTTAAACTTGTGTGTTTTCTTAG
- Ms_tRNATyr primer f1: ATGGCTGAGTAAGCATTAGA
- Ms_tRNATyr primer r1: ACCTCTGTGTTTAGATTTAC
- Ms_tRNATyr primer r2: GAGGATTTAAACCTCTGTGT
Notes:- Standard PCR grade primers are sufficient for this protocol.
- The r1 primer is used for the measurement of total tRNA level, and the r2 primer is
used for the measurement of ms2-modification level in individual tRNA.
- Ms_tRNAPhe primer f1: GCTTAATAACAAAGCAAAGCA
Equipment
- Conventional PCR apparatus (Thermo Fisher Scientific, Applied Biosystems®, model: Veriti 96 Well Thermal Cycler )
- Real-time PCR apparatus (Life Technologies, Applied Biosystems®, model: 7300 Real Time PCR System )
Note: Currently, it is “Thermo Fisher Scientific, model: 7300 Real Time PCR System ”.
Procedure
Part I. DNase treatment
- Prepare total RNA from cell and tissue samples of human or animals by TRIzol reagent or miRNeasy kit according to the manufacturer’s instructions.
- Mix following reagents in microtubes for DNase treatment on ice.
Note: For measurement of ms2 modification in multiple samples, it is recommended to prepare a master mixture of all reagents except RNA to reduce variability. When preparing a master mixture, it is usually desirable to prepare a slight excess to compensate for pipetting inaccuracies.Component Volume (µl/reaction) RNA (100 ng/µl) 2 DNase I 0.5 10x DNase I buffer 2 PCR grade water 15.5 Total volume 20 - Put microtubes in PCR apparatus and use the following program.
Time and temperature Digestion Inactivation Hold 37 °C for 20 min 75 °C for 10 min 4 °C - Use DNase I-treated sample for subsequent reverse transcription or store at -80 °C.
Part II. Reverse transcription 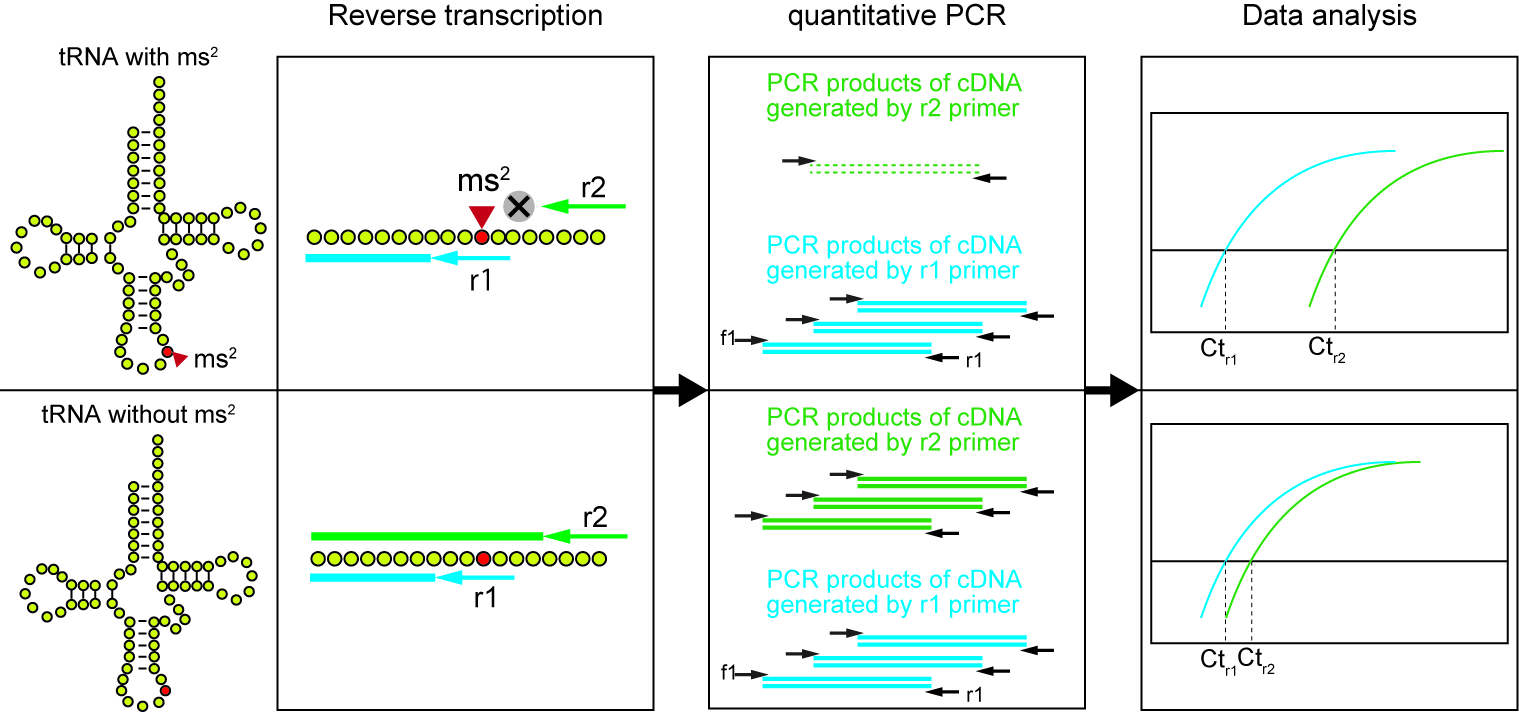
Figure 1. Workflow of the method to detect ms2 modification. The mitochondrial tRNA is reversely transcribed by r1 primer and r2 primer, respectively. Because of the inhibitory effect of ms2-modification to the reverse transcription, the amount of cDNA generated by r2 primer (Green lines) highly depends on the ms2 levels in a given RNA sample. On the other hand, the cDNA generated by r1 primer (Blue lines) is independent of ms2 level, and could be utilized as an internal control. The amount of each cDNA is quantified by a subsequent quantitative PCR (qPCR) using f1 and r1 primers.
- For each tRNA species, mix DNase I-digested RNA with primer r1 or primer r2 on ice.Note: It is recommended to prepare a master mixture of all reagents except RNA to reduce variability. When preparing a master mixture, it is usually desirable to prepare a slight excess to compensate for pipetting inaccuracies.
Component Volume (µl/reaction) Sample (r1) Sample (r2) DNase-digested RNA 2.5 2.5 Primer r1 (10 µM) 1 ― Primer r2 (10 µM) ― 1 Water 3 3 Total volume 6.5 6.5 - Denature RNA at 65 °C for 10 min and immediately put samples on ice for 1 min.
- Add RT enzyme and buffer included in the Transcriptor First Strand cDNA Synthesis kit as follows on ice.Note: It is recommended to prepare a master mixture of all reagents except RNA to reduce variability. When preparing a master mixture, it is usually desirable to prepare a slight excess to compensate for pipetting inaccuracies.
Component Volume (µl/reaction) Sample (r1) Sample (r2) Denatured RNA 6.5 6.5 5x buffer 2 2 RNase inhibitor 0.25 0.25 dNTP Mix 1 1 Enzyme 0.25 0.25 Total volume 10 10 - Perform reverse transcription according to the following program.
Time and Temperature Reaction Inactivation Hold 55 °C for 30 min 85 °C for 5 min 4 °C - Samples are ready for quantitative PCR. Otherwise, samples can be stored at -20 °C.
Part III. Quantitative PCR
- Mix reagents as follows. In case other SYBR green-based PCR kits are used, follow the manufacturer' instructions as recommended.Note: It is recommended to prepare a master mixture of all reagents except cDNA to reduce variability. When preparing a master mixture, it is usually desirable to prepare a slight excess to compensate for pipetting inaccuracies.
Component Volume (µl/reaction) Sample (r1) Sample (r2) SYBR Premix Ex Taq 10 10 Primer f1 (10 µM) 0.4 0.4 Primer r1 (10 µM) 0.4 0.4 ROX reference dye 0.4 0.4 cDNA 2 2 Water 6.8 6.8 Total volume 20 20 - Set the program as follows and run real-time PCR. Add dissociation stage if required.
Time and temperature First step PCR (40 cycles) Heat-activation Denaturing Annealing/Elongation Hold Cycle 95 °C for 30 sec 95 °C for 5 sec 60 °C for 31 sec
Part IV. Data analysis
Analyze data from Samples (r1) and (r2) to obtain Ct values. The results obtained Samples (r1) and (r2) represents the total tRNA level and ms2-modification level in individual tRNA, respectively.
The normalized modification level in any given RNA sample is calculated as dCt = Ct (r2) – Ct (r1). Because the dCt value precisely reflects the modification level (Xie et al., 2013), the dCt value could be directly used for comparison of modification levels between multiple samples (see below for the representative data).
Representative data
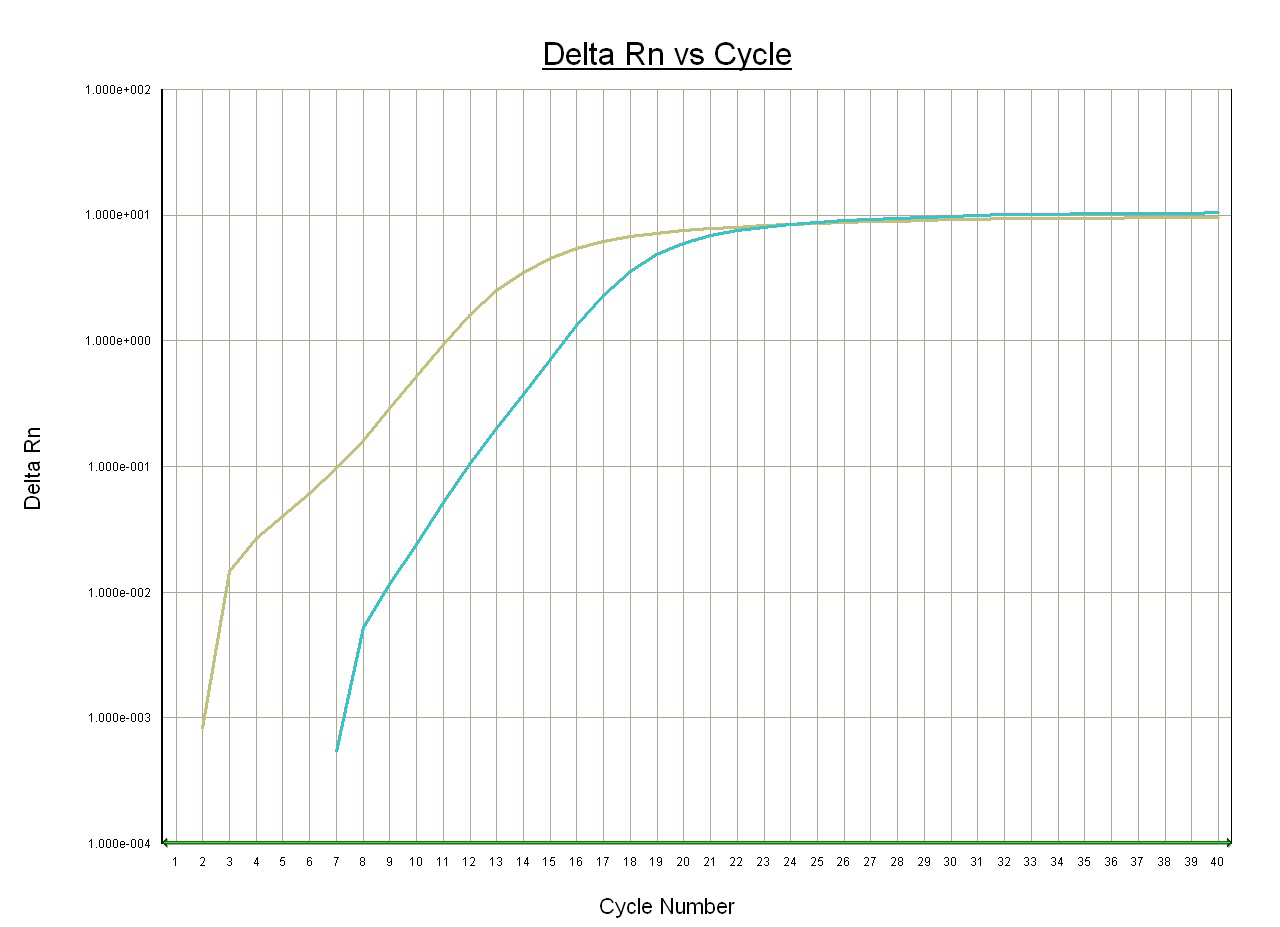
Figure 2. Measurement of ms2 level of mt-tRNATyr in wild-type mouse heart tissue. Total RNA was purified from mouse heart tissue using TRIzol followed by 2-propanol precipitation. RNA sample was adjusted to 100 ng/µl and subjected to analysis as described above. The representative amplification curves using r1 primer (green) and r2 primer (blue) are shown. Ct (r2) = 14.8, Ct (r1) = 10.7. Modification level (dCt) in wild-type mouse heart = 14.8-10.7 = 4.1. 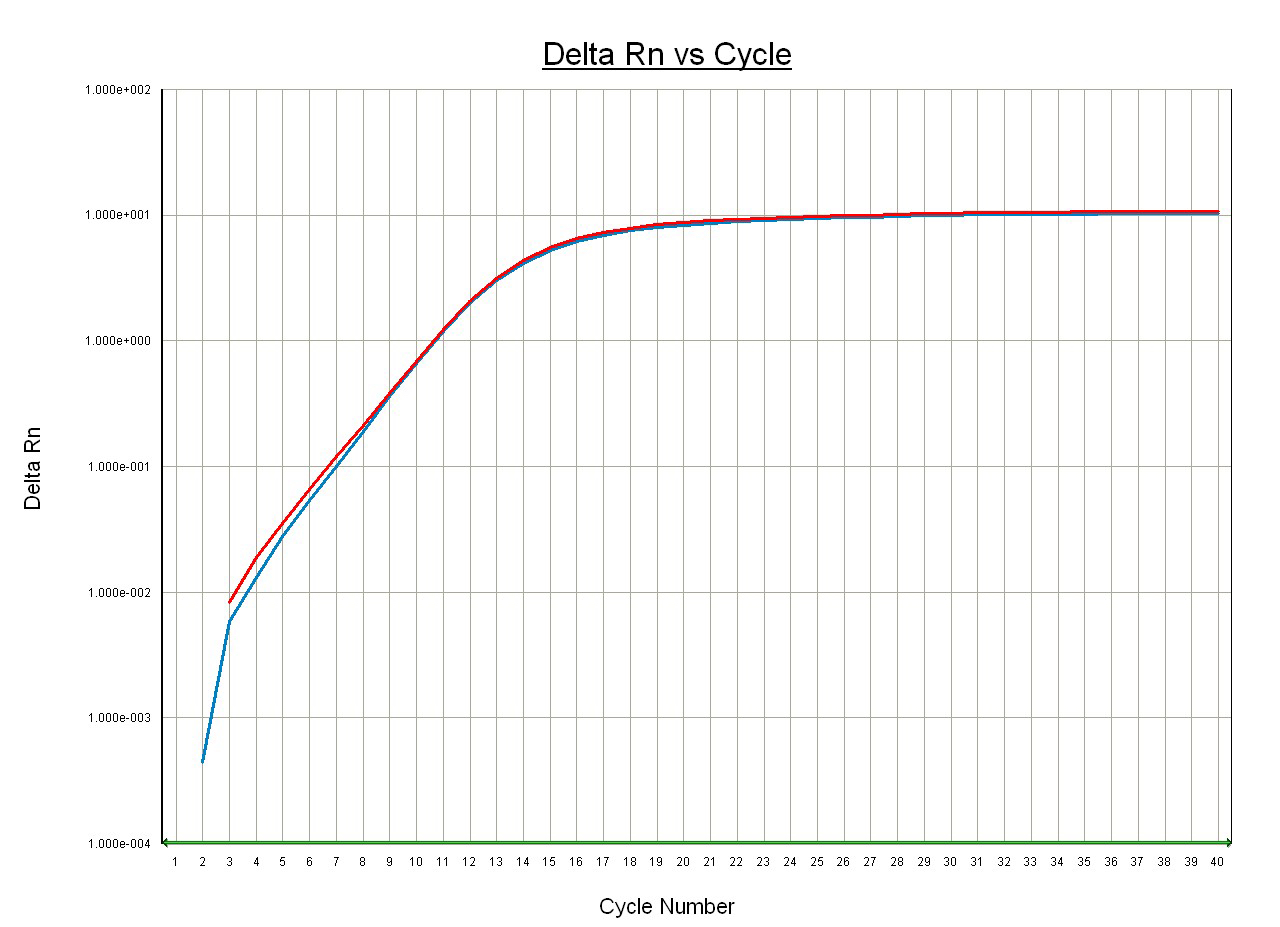
Figure 3. Measurement of ms2 level of mt-tRNATyr in heart tissue of Cdk5rap1 KO mouse. Total RNA was purified from heart tissue of Cdk5rap1 KO mouse that does not contain ms2 modification. RNA sample was adjusted to 100 ng/µl and subjected to analysis as described above. The representative amplification curves using r1 primer (red) and r2 primer (blue) are shown. Ct (r2) = 10.4, Ct (r1) = 10.4. Modification level (dCt) in Cdk5rap1 KO mouse heart = 10.4-10.4 = 0.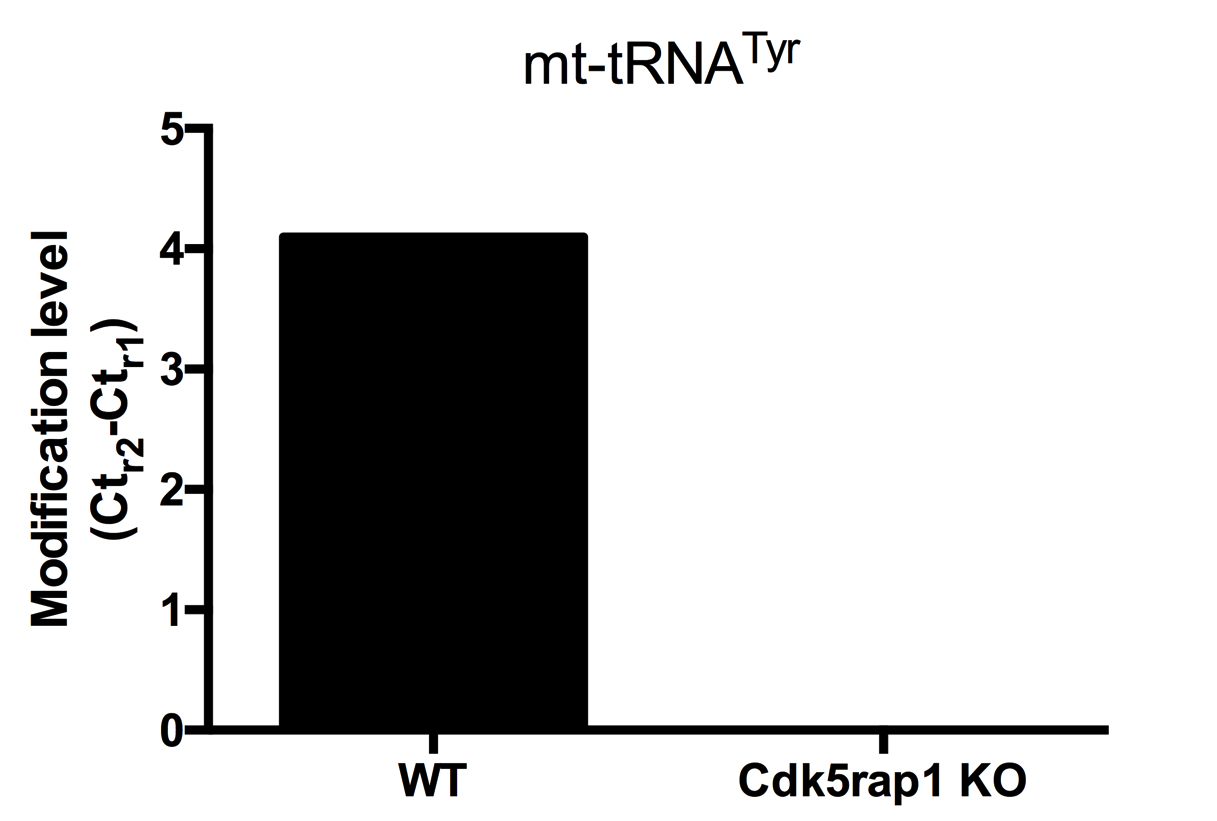
Figure 4. Comparison of the modification levels of mt-tRNATyr in heart tissues of wild-type (WT) and Cdk5rap1 KO mouse
Acknowledgments
The concept of this protocol was adapted from our previous study, in which the quantitative PCR was used to measure ms2 modification in cytosolic tRNALys(UUU) (Xie et al., 2013). We have successfully used this protocol to measure ms2 modification mitochondrial tRNA in our recent study (Wei et al., 2015). This work was supported by a Grant-in-aid for Scientific Research from the Ministry of Education, Culture, Sports, Science and Technology of Japan.
References
- Wei, F. Y., Zhou, B., Suzuki, T., Miyata, K., Ujihara, Y., Horiguchi, H., Takahashi, N., Xie, P., Michiue, H., Fujimura, A., Kaitsuka, T., Matsui, H., Koga, Y., Mohri, S., Suzuki, T., Oike, Y. and Tomizawa, K. (2015). Cdk5rap1-mediated 2-methylthio modification of mitochondrial tRNAs governs protein translation and contributes to myopathy in mice and humans. Cell Metab 21(3): 428-442.
- Xie, P., Wei, F. Y., Hirata, S., Kaitsuka, T., Suzuki, T., Suzuki, T. and Tomizawa, K. (2013). Quantitative PCR measurement of tRNA 2-methylthio modification for assessing type 2 diabetes risk. Clin Chem 59(11): 1604-1612.
Article Information
Copyright
© 2016 The Authors; exclusive licensee Bio-protocol LLC.
How to cite
Wei, F. and Tomizawa, K. (2016). Measurement of 2-methylthio Modifications in Mitochondrial Transfer RNAs by Reverse-transcription Quantitative PCR. Bio-protocol 6(1): e1695. DOI: 10.21769/BioProtoc.1695.
Category
Cancer Biology > Cellular energetics > Biochemical assays > Other compound
Cell Biology > Cell metabolism > Other compound
Molecular Biology > RNA > qRT-PCR
Do you have any questions about this protocol?
Post your question to gather feedback from the community. We will also invite the authors of this article to respond.