- Protocols

- Articles and Issues
- For Authors
- About
- Become a Reviewer

Sample Preparation for Correlative Light and Electron Microscopy (CLEM) Analyses in Cellular Microbiology
Published: Vol 5, Iss 19, Oct 5, 2015 DOI: 10.21769/BioProtoc.1612 Views: 17985
Reviewed by: Fanglian HeAnonymous reviewer(s)
Original research article
The authors used this protocol in:
Sep 2014
Advertisement


Protocol Collections
Comprehensive collections of detailed, peer-reviewed protocols focusing on specific topics


Abstract
Dynamic processes in cells are usually monitored by live cell fluorescence microscopy. Unfortunately, this method lacks the ultrastructural information about the structure of interest (SOI). Currently, electron microscopy (EM) is the best tool to achieve highest spatial resolution. In addition, correlative light and electron microscopy (CLEM) analysis of the same structure allows combining authentic live cell imaging with the resolution power of EM. Additionally the reference space of the SOI is revealed. Our CLEM analyses of HeLa cells allow tracing the morphology and dynamic behavior of intracellular micro-compartments in living cells and their ultrastructure and subcellular organization in a highly resolved manner.
Keywords: Sample preparationMaterials and Reagents
- General lab equipment: Gloves, lab coat, pipettes, 15 and 50 ml centrifuge tubes (e.g., BD Biosciences, Falcon®), microcentrifuge tubes (e.g., Eppendorf), plastic Pasteur pipettes, beakers
- 10 cm plastic Petri dish or a comparable vessel
- 3.5 cm plastic Petri dish or a comparable vessel (Acetone-resistant)
- Eukaryotic cells as biological sample (here: transfected HeLa cells expressing LAMP1-GFP)
- Cell-specific culture medium: DMEM (Biochrom AG, catalog number: FG 0445 ) + 10% Fetal Bovine Serum (FCS) (Thermo Fisher Scientific, GibcoTM, catalog number: 10270 )
- Cell-specific imaging medium: MEM (Biochrom AG, catalog number: F 0475 ) + 30 mM HEPES
- HEPES = 4-(2-hydroxyethyl)-1-piperazineethanesulfonic acid (Carl Roth GmbH, catalog number: HN77.5 )
- Glutaraldehyde [CH2(CH2CHO)2], 25% in H2O (Electron Microscopy Sciences, catalog number: E16221 )
- Glycine, ultra pure (Biomol GmbH, catalog number: 04943.1 )
- Large gelatin capsules, size 13 (Electron Microscopy Sciences, catalog number: 70114 )
- Calcium chloride (CaCl2) (Sigma-Aldrich, catalog number: C 5670 )
- Osmium tetroxide (OsO4), 0.1 g ampules (Electron Microscopy Sciences, catalog number: 19134 )
- Ruthenium red [[(NH3)5RuORu(NH3)4ORu(NH3)5]Cl6] (AppliChem GmbH , catalog number: A34880001 )
- Potassium hexacyanoferrate(III) [K3[Fe(CN)6]] (Sigma-Aldrich, catalog number: 244023 )
- Ethanol p.a. grade (very pure chemical)
- Acetone p.a. grade (very pure chemical)
- EPON 812 (SERVA Electrophoresis GmbH, catalog number: 21045.02 )
- DDSA = Dodecenylsuccinic anhydride (SERVA Electrophoresis GmbH, catalog number: 20755 )
- MNA = Methylnadic anhydride (SERVA Electrophoresis GmbH, catalog number: 29452.03 )
- DMP-30 = 2, 4, 6-Tris(dimethylamino-methyl)phenol (SERVA Electrophoresis GmbH, catalog number: 36975 )
- Uranyl acetate dihydrate [UO2(CH3COO)2.2H2O] (Electron Microscopy Sciences, catalog number: 22400 )
- Lead(II) nitrate [Pb(NO3)2] (Sigma-Aldrich, catalog number: 31137 )
- Trisodium citrate dihydrate (Na3C6H5O7.2H2O) (Carl Roth, catalog number: 3580.1 )
- 1 N Sodium hydroxide (NaOH), carbonate-free (Electron Microscopy Sciences, catalog number: 21170-01 )
- 65% Nitric acid (HNO3)
- Autoclaved ultrapure H2O (MilliQ)
- Liquid nitrogen
- Graded ethanol series (50%, 70%, 80%, 90%, 95%, 100%)
- Mixes of acetone and EPON (3:1 and 1:3 mix)
- 1 M HEPES buffer (see Recipes)
- 2 M CaCl2 in H2O (see Recipes)
- 10% glycine in 0.2 M HEPES buffer (see Recipes)
- 1% ruthenium red in H2O (see Recipes)
- 15% potassium hexacyanoferrate(III) in H2O (see Recipes)
- 2x fixative (see Recipes)
- Post-fixative (see Recipes)
- EPON resin (see Recipes)
- 2% uranyl acetate in H2O (see Recipes)
- Lead citrate according to Reynolds (see Recipes)
- 3% nitric acid (HNO3) (see Recipes)
Equipment
- Cell culture equipment: Cell culture incubator (37 °C, 5% CO2, 90% humidity) and clean bench
- MatTek Glass Bottom Culture Dishes, 35 mm, uncoated, Glass No. 2, gridded (Glass Bottom Dishes, MatTek Corporation, catalog number: P35G-2-14-CGRD )
Attention: Glass No. 2 may be too thick for some objectives with high numerical aperture (NA), but this is the only format available and worked in our application. - Confocal laser-scanning microscope (CLSM) Leica SP5 equipped with an incubation chamber (homemade) maintaining 37 °C and humidity during live cell imaging (Attention: CO2-containing atmosphere can be omitted if using imaging medium buffered with 30 mM HEPES. For carbonate-buffered cell culture media, the atmosphere should contain 5% CO2). The microscope is operated with software package LAS-AF for setting adjustment, image acquisition and image processing
- Several objectives, such as 10x (HC PL FL 10x, NA 0.3, DIC, dry), 20x (HC PL APO CS 20x, NA 0.7, DIC, dry), 40x (HCX PL APO CS 40x, NA 1.25-0.75, DIC, oil immersion) and 100x objective (HCX PL APO CS 100x, NA 1.4-0.7, DIC, oil immersion)
- The polychroic mirror TD 488/543/633 for the three channels GFP/RFP/DIC (Leica Microsystems)
- Several objectives, such as 10x (HC PL FL 10x, NA 0.3, DIC, dry), 20x (HC PL APO CS 20x, NA 0.7, DIC, dry), 40x (HCX PL APO CS 40x, NA 1.25-0.75, DIC, oil immersion) and 100x objective (HCX PL APO CS 100x, NA 1.4-0.7, DIC, oil immersion)
- Fume hood
- Ice or cold metal block
- Scalpel
- Oven, heatable to 60 °C
- Dewar vessel for liquid nitrogen
- Stereo microscope
- Dark permanent marker
- Vice
- Jigsaw
- Universal specimen holder for EPON blocks (Leica Microsystems, catalog number: 16701761 )
- Double edge carbon steel blades (Plano, catalog number: 121-9 )
- Ultramicrotome (Leica EM UC6)
- Diamant knife ultra 45 °C, 2 mm (DIATOME, catalog number: DU4520 )
- Formvar-coated EM cooper slit grids 2 x 1 mm (homemade coating) (Electron Microscopy Sciences, catalog number: G2010-Cu )
- Forceps for EM grids, type 7 stainless steel (Plano GmbH, catalog number: T5039 )
- Storage box for grids (Electron Microscopy Sciences, catalog number: G71138 )
- Large forceps for liquid nitrogen and small forceps for embedding procedure
- Automated staining device (nanofilm surface analysis ultrastainer)
- TEM (ZEISS, model: EFTEM 902 A ), operated at 80 kV and equipped with a 2K wide-angle slow-scan CCD camera (Teacher Retirement System of Texas) with software ImageSP (Teacher Retirement System of Texas, model: image SysProg)
Software
- ImageJ, http://rsbweb.nih.gov/ij/, Photoshop 5.5 (Adobe), or higher or similar software for stitching and overlay of images
- Imaris (Bitplane), ImageJ, ZEN (ZEISS), LASAF (Leica Microsystems), or similar software for processing fluorescence images
Procedure
Due to effort in preparation and limited shelf life the chemicals required have to be prepared at various times:
- Some chemicals can be prepared in advance and stored up to several months. These are 1 M HEPES buffer, 2 M calcium chloride, 10% glycine, 1% ruthenium red, 15% K3[Fe(CN)6], graded ethanol series and autoclaved MilliQ water.
- Some chemicals should be prepared more freshly and stored only up to several weeks. These are the resin components A and B, 2% uranyl acetate, lead citrate and 3% HNO3.
- Some chemicals should be prepared as fresh as possible. At the day of live cell imaging prepare fresh 2x and 1x fixative. One day before use start to prepare the post-fixative, since osmium tetroxide crystals need one night to solve (solved in dark at 4 °C in fume hood), and finish the preparation of the post-fixative shortly before usage by addition of additives. Also at the day of use prepare the EPON resin (stored at -20 °C, but equilibrate to RT before use) and prepare the acetone-EPON mixes shortly before use.
Scheme of procedure
In the following the CLEM work flow from seeding cells to TEM imaging is illustrated.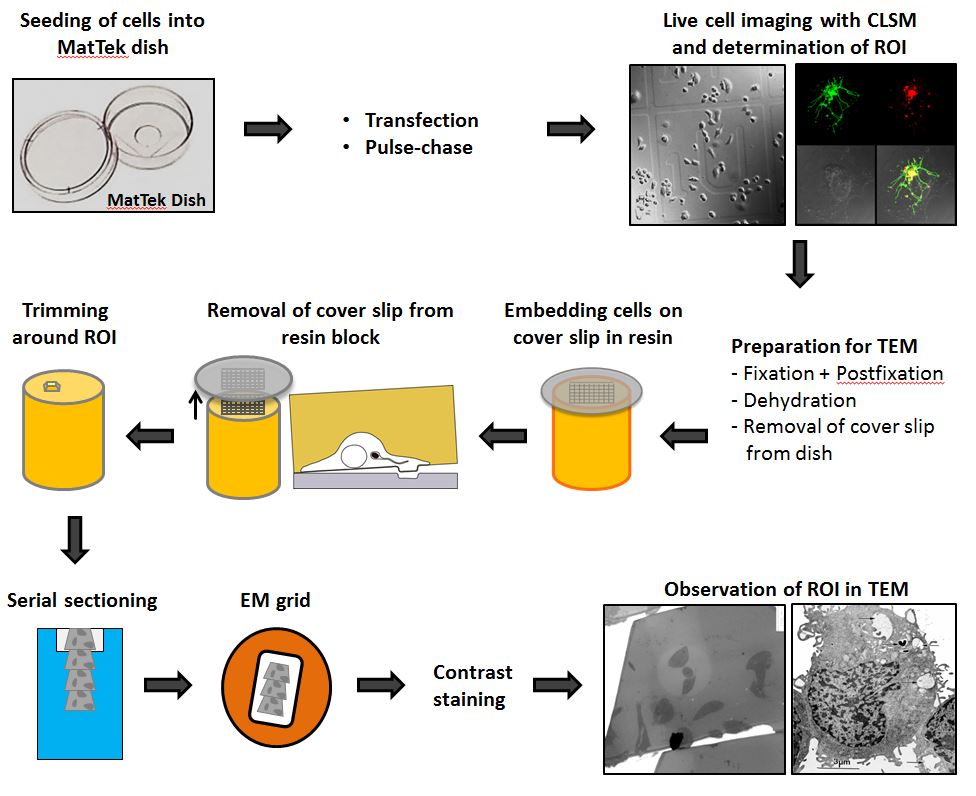
Figure 1. CLEM workflow. HeLa cells are seeded in a MatTek dish with a gridded coverslip. After one day, cells can be transfected or pulse-chased with fluid phase marker. The next day, cells are infected, imaged live and fixed as fast as possible on the microscope stage. The coverslip is removed from the dish and the sample is processed for TEM and flat-embedded in resin. During the removal of the coverslip the engraved coordinates are transferred to the resin surface and allows trimming around the ROI. Serial sections are transferred to EM grids and stained for contrast. The same ROI is imaged in TEM for overlaying with LM image.
- For the experiment HeLa cells are seeded two days prior to live cell imaging into a MatTek dish containing 2 ml cell culture medium and incubated at 37 °C, 5% CO2 and 90% humidity. The cell number per MatTek dish should be app. 4 x 10⁵ cells at the day of imaging. This relative low cell number facilitates the relocation of the cells on the grid. Importantly, at the day of microscopy cells should possess a fluorescent marker for the structure of interest (SOI) to enable correlation of live cell images to ultrastructure. Therefore, cells have to be specifically treated before microscopy, meaning transfection with plasmids for expression of tagged proteins, pulse-chase with fluid phase markers (Krieger et al., 2014), or another labeling method.
- At least 1 h prior to live cell imaging switch on the microscope and the incubation chamber of the microscope to reach the desired temperature and atmosphere at imaging start. Start the imaging software and adjust all required settings to avoid delays before live cell imaging.
- Arrange freshly prepared 2x fixative pre-warmed to 37 °C and equipment (gloves, pipette and timer) as close as possible to the CLSM microscope.
- Directly before imaging of the cells replace cell culture medium by 1 ml imaging medium and transfer the MatTek dish to the pre-warmed microscope stage. Remove the lid from the MatTek dish before imaging and don’t touch the dish until the last image is done.
- A region of interest (ROI) is observed first with the 100x objective, a Z-stack is defined and the acquisition is started. The settings should allow rather fast acquisition (dependent on the dynamics of the SOI), since fast cellular processes, e.g., vesicle movement will complicate correlation with ultrastructure. As soon as the Z-stack is finished (less than 1 min) add 1 ml of warm 2x fixative to 1 ml imaging medium in the dish (ratio 1+1) and mix very gently by pipetting up and down, in order to fix cells as fast as possible directly on the microscope stage. Be careful not to touch the dish with the pipette tip. Start the timer for 1 h. Now acquire all remaining images, i.e., one additional Z-stack with the 100x objective directly after addition of 2x fixative as control for movement of SOI. Next generate overview images, each with 40x, 20x and 10x objectives without Z-stacks, for the localization of the ROI on the dish grid and the eventual re-localization of the ROI on the resin surface. Once the last image is acquired, close lid, remove the MatTek dish from the microscope and transfer to a fume hood. Keep the cells warm.
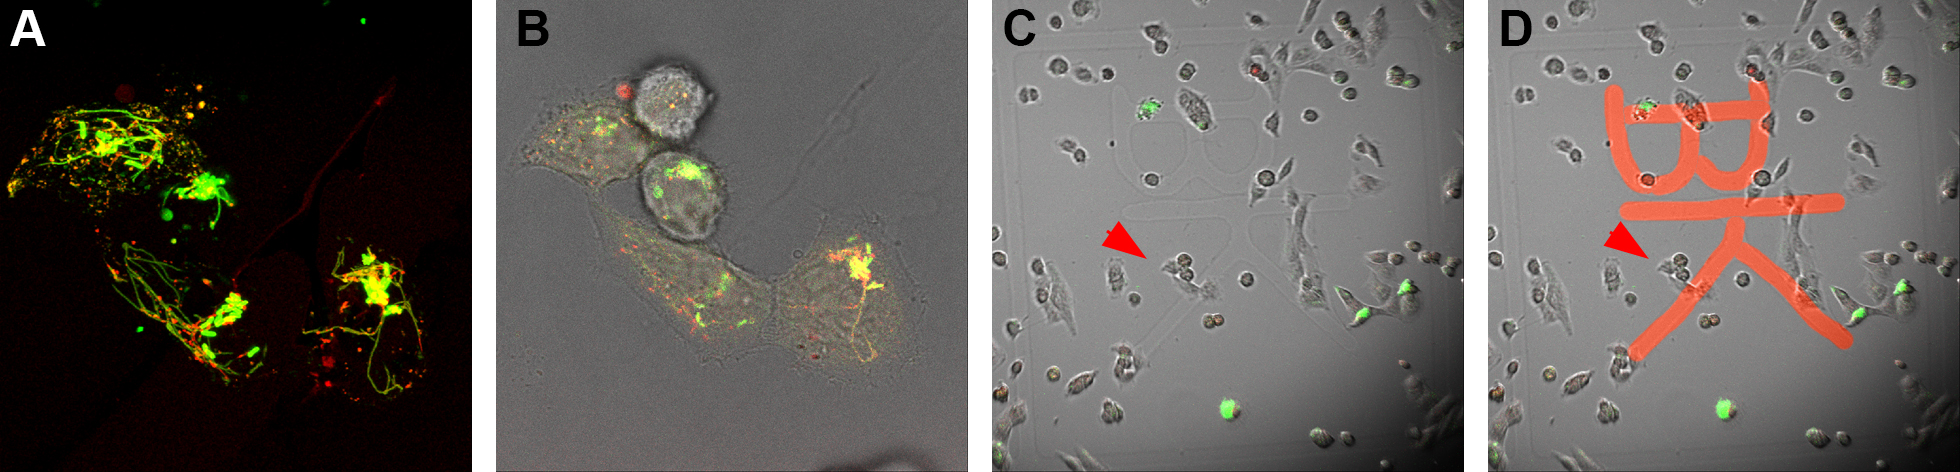
Figure 2. Fluorescence microscopy and localization of the ROI on dish grid. Cells of interest are imaged live and a Z-stack is acquired by CLSM (A). An additional bright field image is acquired for visualization of shape and distribution of cells (B). Using this information, cells of interest are relocated on the dish grid using a lower magnification and engraved coordinates on the coverslip of the MatTek dish are recorded (in this case the coordinates “BK”) (C). Coordinates “BK” were highlighted (D). - Under the fume hood the imaging medium-fixative mixture is replaced by 2 ml fresh pre-warmed 1x fixative and cells are incubated for the remainder of the fixation time of 1 h. At the end of fixation cells should be at room temperature (RT).
- Rinse cells thrice with 2 ml 0.2 M HEPES buffer.
- Incubate cells with 2 ml 50 mM glycine in HEPES buffer for 15 min to block unreacted glutaraldehyde.
- Rinse cells thrice with 2 ml 0.2 M HEPES buffer.
- Cells are cooled to 4 °C in a fridge or on ice, since the next steps have to be performed in the cold.
- This step has to be performed under a fume hood due to very toxic osmium tetroxide! First finish the preparation of cold post-fixative by addition of ruthenium red and potassium hexacyanoferrate (III) to the solved osmium tetroxide crystals. Next remove HEPES buffer from the ice-cold cells, add minimum of 1.5 ml ice-cold post-fixative and incubate for 1 h at 4 °C in the dark in fume hood. The osmium will stain dark the cells as well as the glue between MatTek dish and coverslip.
- Rinse cells five times with 2 ml ice-cold 0.2 M HEPES buffer for 2 min each (in fume hood).
Note: This step may also be extended overnight. - Remove the gridded square coverslip from the MatTak dish. This step can be performed during the dehydration whenever appropriate, but the incubation times of the dehydration are critical and should be adhered to. Prepare a 10 cm plastic Petri dish filled with the solution of the current step (for example, 0.2 M HEPES buffer) on ice. Place the MatTek dish inside the liquid of the 10 cm dish and gently but with continual force insert the sharp edge of a scalpel from the inside between the coverslip and the plastic dish bottom. As the scalpel penetrates deeper between the coverslip and the dish bottom, the coverslip starts to peel off and falls into the buffer-filled 10 cm dish. Using forceps, transfer the coverslip cell-side up into a smaller 3.5 cm plastic dish or comparable vessel (acetone-resistant) already filled with solution of the current step. The volume of all following solutions inside the 3.5 cm dish should be large enough to completely cover the cells. Consider that ethanol and acetone evaporate. Cells should never come in contact with air or dry completely.
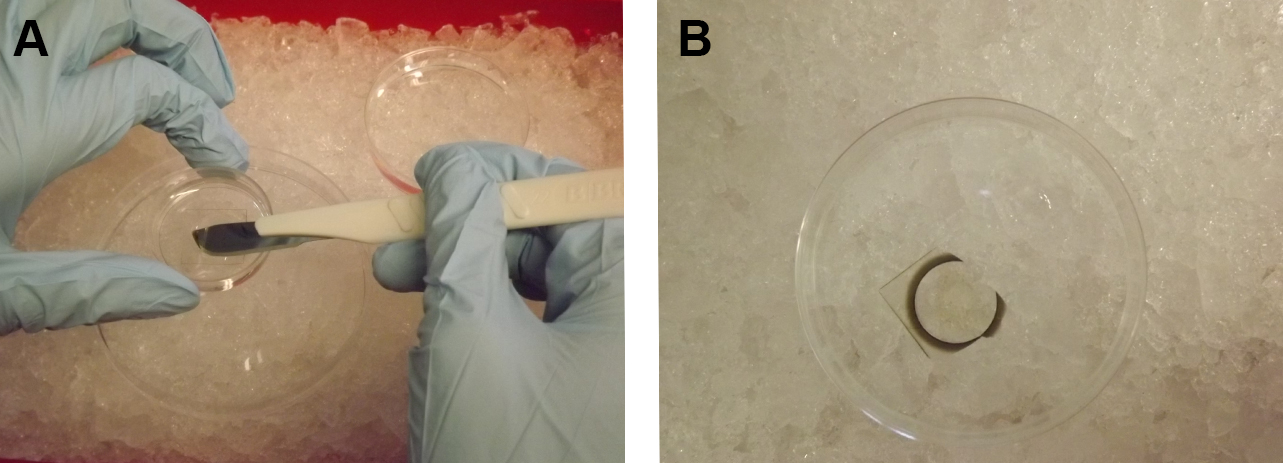
Figure 3. Removal of the coverslip from the MatTek dish. Using a scalpel, the square coverslip glued to the bottom of the dish is removed from the MatTek dish (A), then drops into a buffer-filled 10 cm dish on ice (B). - Prepare mixtures of acetone and EPON (3:1 and 1:3 mix) in the fume hood. This step may be performed during the dehydration whenever appropriate, but should be finished at the latest when the sample is in acetone.
- Remove HEPES buffer from the cells and dehydrate sample in a cold graded ethanol series. In detail, cells are incubated with 50%, 70%, 80%, 90%, 95% and 100% ethanol for 10 min for each step. Cells are kept cold, e.g., by placing a cold metal block under the 3.5 cm dish until the 95% ethanol incubation. From the incubation with 100% ethanol, remove metal block and allow reaching RT.
- Incubate cells in anhydrous ethanol for 10 min at RT.
- Incubate cells in anhydrous acetone twice for 10 min at RT.
- Incubate cells in 3:1 mix of acetone:EPON for 1 h at RT (in fume hood).
- Incubate cells in 1:3 mix of acetone:EPON for 1 h at RT (in fume hood).
- Incubate cells in pure EPON overnight at RT (in fume hood).
- The next day, cells are incubated in fresh pure EPON for 4 h at RT (in fume hood). In the meantime, the oven for EPON polymerization is switched on adjusted to 60 °C. The oven should also be inside a fume hood.
- Fix one half of a gelatin capsule upright with the opening up and fill the capsule with fresh EPON. Avoid air bubbles inside the EPON. Air bubbles may be removed by shortly warming the filled capsule in the oven. With forceps, pick up the square coverslip from the last EPON incubation, hold it upright for approximately 1 min to allow EPON to run off and place the coverslip cell-side down on the filled capsule. Again, avoid air bubbles. Finally place the capsule with the coverslip on top for polymerization of EPON inside the oven heated to 60 °C for 48-72 h. In parallel all materials contaminated with EPON can be wrapped in aluminum foil and placed in the oven polymerization.
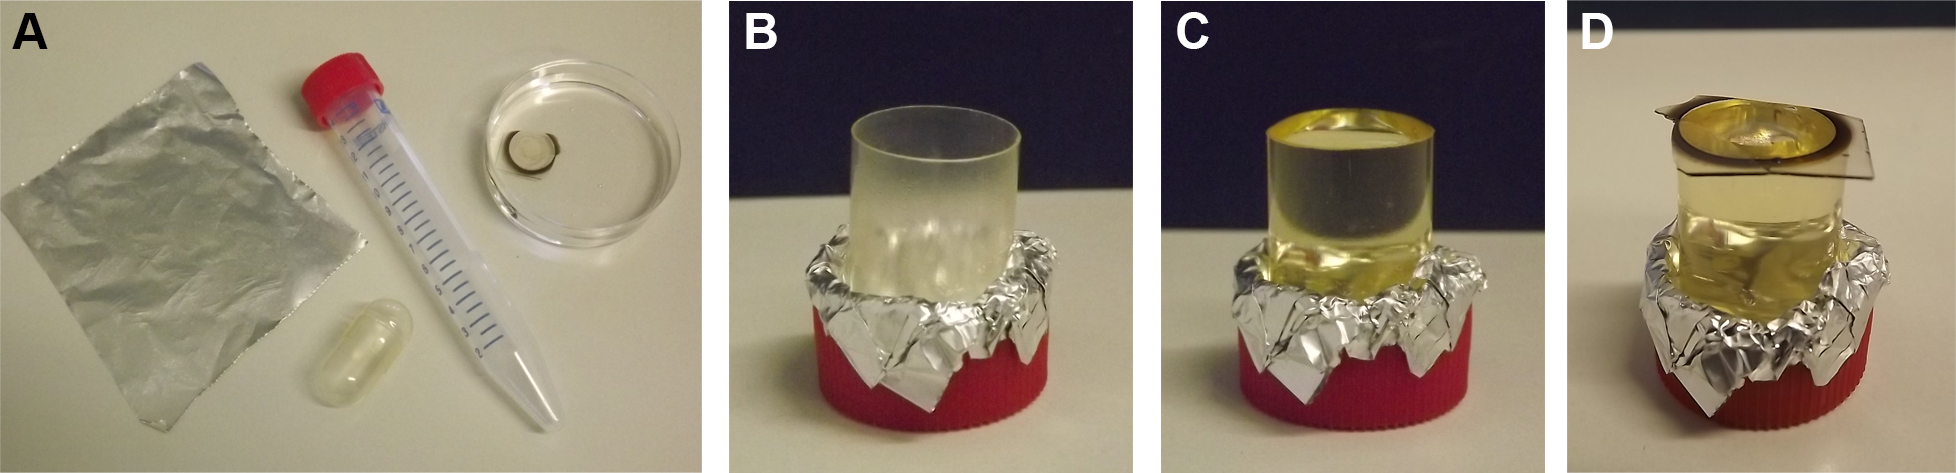
Figure 4. EPON embedding of cells on detached coverslips. A lid of a 15 ml Falcon tube, one half of a large gelatin capsule, aluminum foil, and the coverslip containing cells is required for embedding (A). The half of the gelatin capsule is placed upright with opening facing upwards inside the lid of the Falcon tube and fixed with aluminum foil (B). The capsule is filled with EPON (C). After dehydration and infiltration of sample the coverslip is placed cell-side down on the EPON-filled capsule (D). - After complete polymerization of EPON remove sample from oven and leave to cool to RT.
- Prepare a Dewar vessel with liquid nitrogen, a beaker with hot water and large forceps. With the forceps quickly immerse the EPON block with the coverslip-side down alternately into liquid nitrogen and hot water. The different physical properties of glass and EPON will lead to a separation of the coverslip. During the removal of the gridded coverslip from the EPON block the engraved grid is transferred from the coverslip to the EPON block surface.
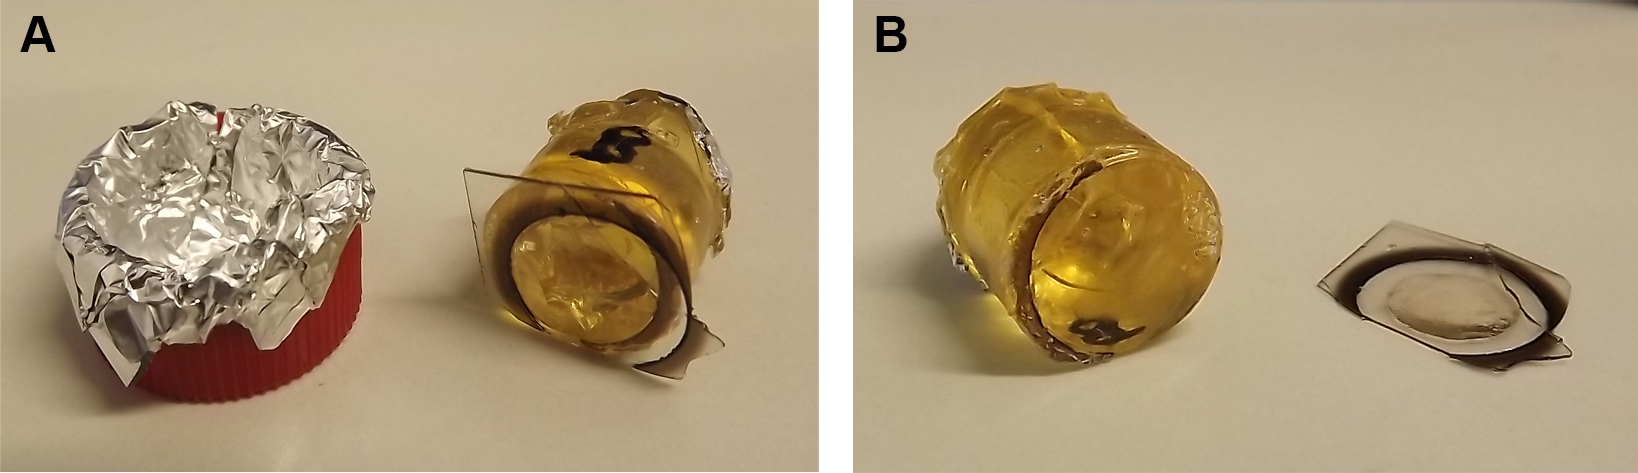
Figure 5. Removal of coverslip from polymerized EPON block. The polymerized EPON block is removed from the oven and Falcon lid for cooling (A). Coverslip is removed from EPON block using the nitrogen-hot water method (B). - Inspect the EPON block surface under a stereo microscope for relocation of the ROI.
Note that the grid pattern will be transferred mirrored. Mark the ROI with a dark permanent marker. - By using a vice and a fine jigsaw roughly remove the excess EPON and form a rectangular EPON block (0.5 x 0.5 x 1.5 cm) with the ROI in the middle of the square surface. Be careful never to damage the EPON surface of the ROI, since the cells are directly under the EPON surface.
- Fix the rectangular EPON block in a metal specimen holder for ultramicrotomes and do not remove until sectioning is done completely.
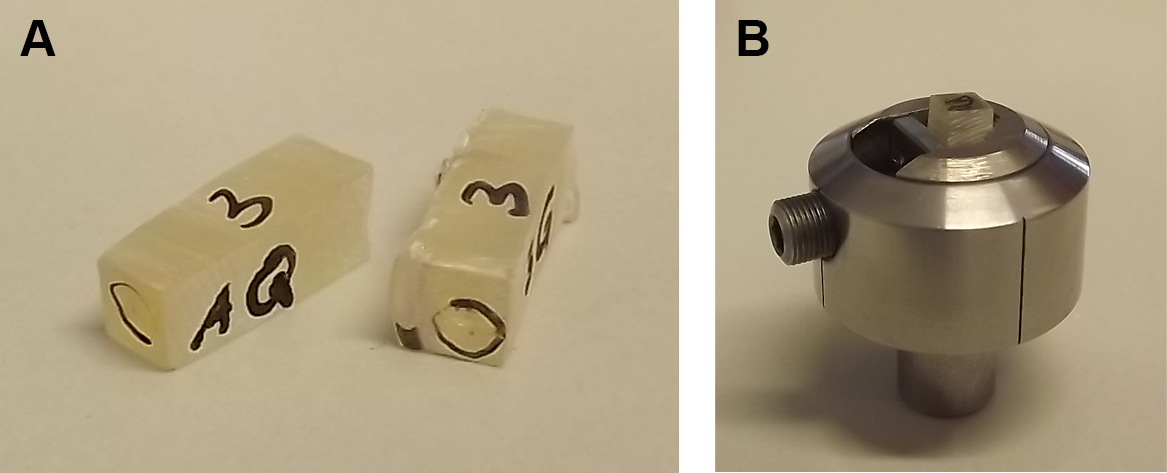
Figure 6. Roughly trimmed EPON blocks are fixed in metal holder. Relocated ROI are marked on the EPON surface and the EPON block is roughly trimmed (A). Trimmed EPON block is fixed in a metal specimen holder for precise trimming and sectioning (B). - Under the stereo microscope manually trim the EPON block sides (not the face!) with a double-edged razor blade so that a pyramid with 45° angled sides and a trapezoidal surface with the ROI in the middle of the trapezoid is formed. The base edge of the trapezoidal surface should be approximately 500 µm and absolutely parallel to the opposite edge. Again, be careful not to damage the EPON face of the ROI.
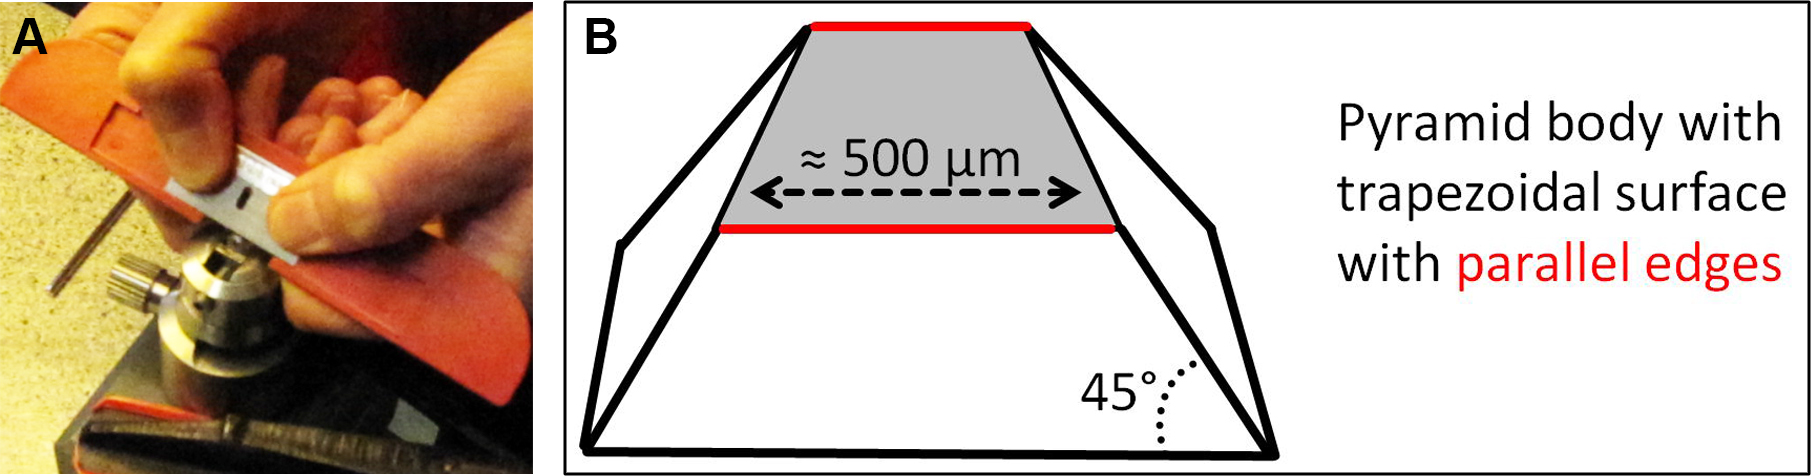
Figure 7. Trimming of EPON block. The EPON block is trimmed with a razorblade (A) so that a pyramid with 45° angled sides and a trapezoidal surface with the ROI in the middle of the trapezoid is formed (B). - Transfer the metal specimen holder to an ultramicrotome equipped with a diamond knife. Essentially, the knife and trapezoidal EPON surface should be aligned parallel to X and Y direction as perfect as possible, since this alignment is most important for the final correlation of images acquired by CLSM and TEM. Pre-sectioning, meaning facing, of the EPON surface is not allowed. For more details on knife alignment, sectioning and collecting sections see Hagler (2007), especially part 3.3.5. Cutting Thin Sections.
- Acquire 70 nm thin serial sections of the trimmed EPON block with the ultramicrotome. Be careful not to lose any section since each section, already the first one, may have important information.
- Collect the serial sections floating on the water surface of the diamond knife reservoir with formvar-coated EM copper slit grids. The order of the sections is very important and should be recorded. Up to eight sections fit on one grid. Formvar coating of the grids may be done in house, but coated grids are also commercially available. Put the grids in the grid storage box. Air dry the grids completely before closing the box.
- For obtaining contrast for TEM, all loaded grids are stained with 2% uranyl acetate for 40 min and lead citrate for 30 min using an automated staining device. For this device also 3% HNO3 and autoclaved water should be at hand. Follow manufacturers manual or one can also stain the grids manually. Keep in mind that lead citrate is CO2-sensitive and follow specific protocols, e.g., Ellis (2004).
- Stained sections are observed with a TEM operated at 80 kV and images are acquired at different magnifications as needed for the final correlation. CLSM images should be at hand for the re-localization of the ROI on the resin section.
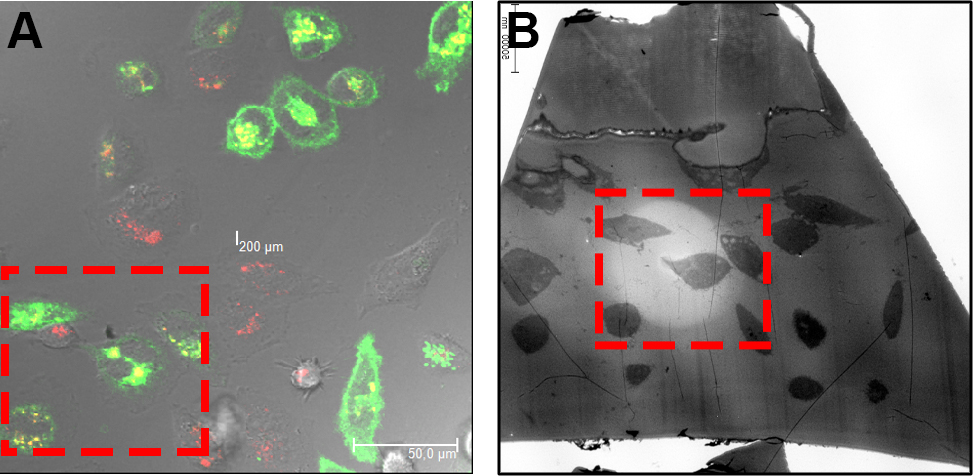
Figure 8. Relocation of ROI on EPON sections. By means of the before acquired CLSM images (A) the cells are relocated according to their orientation and morphology on the EPON sections (B). - Finally, the CLSM and TEM images are overlaid using Photoshop. If necessary, stitching of acquired TEM images is done manually or automated with ImageJ or Photoshop and the processing of CLSM images using microscope-specific software or Imaris. Image processing includes noise reduction, contrast enhancement, or color balance. Note that image processing should be according to proper scientific practice and a good overview on image manipulations can be found in the instructions for authors of the Journal of Cell Biology (http://www.jcb.rupress.org/site/misc/ifora.xhtml).
Representative data
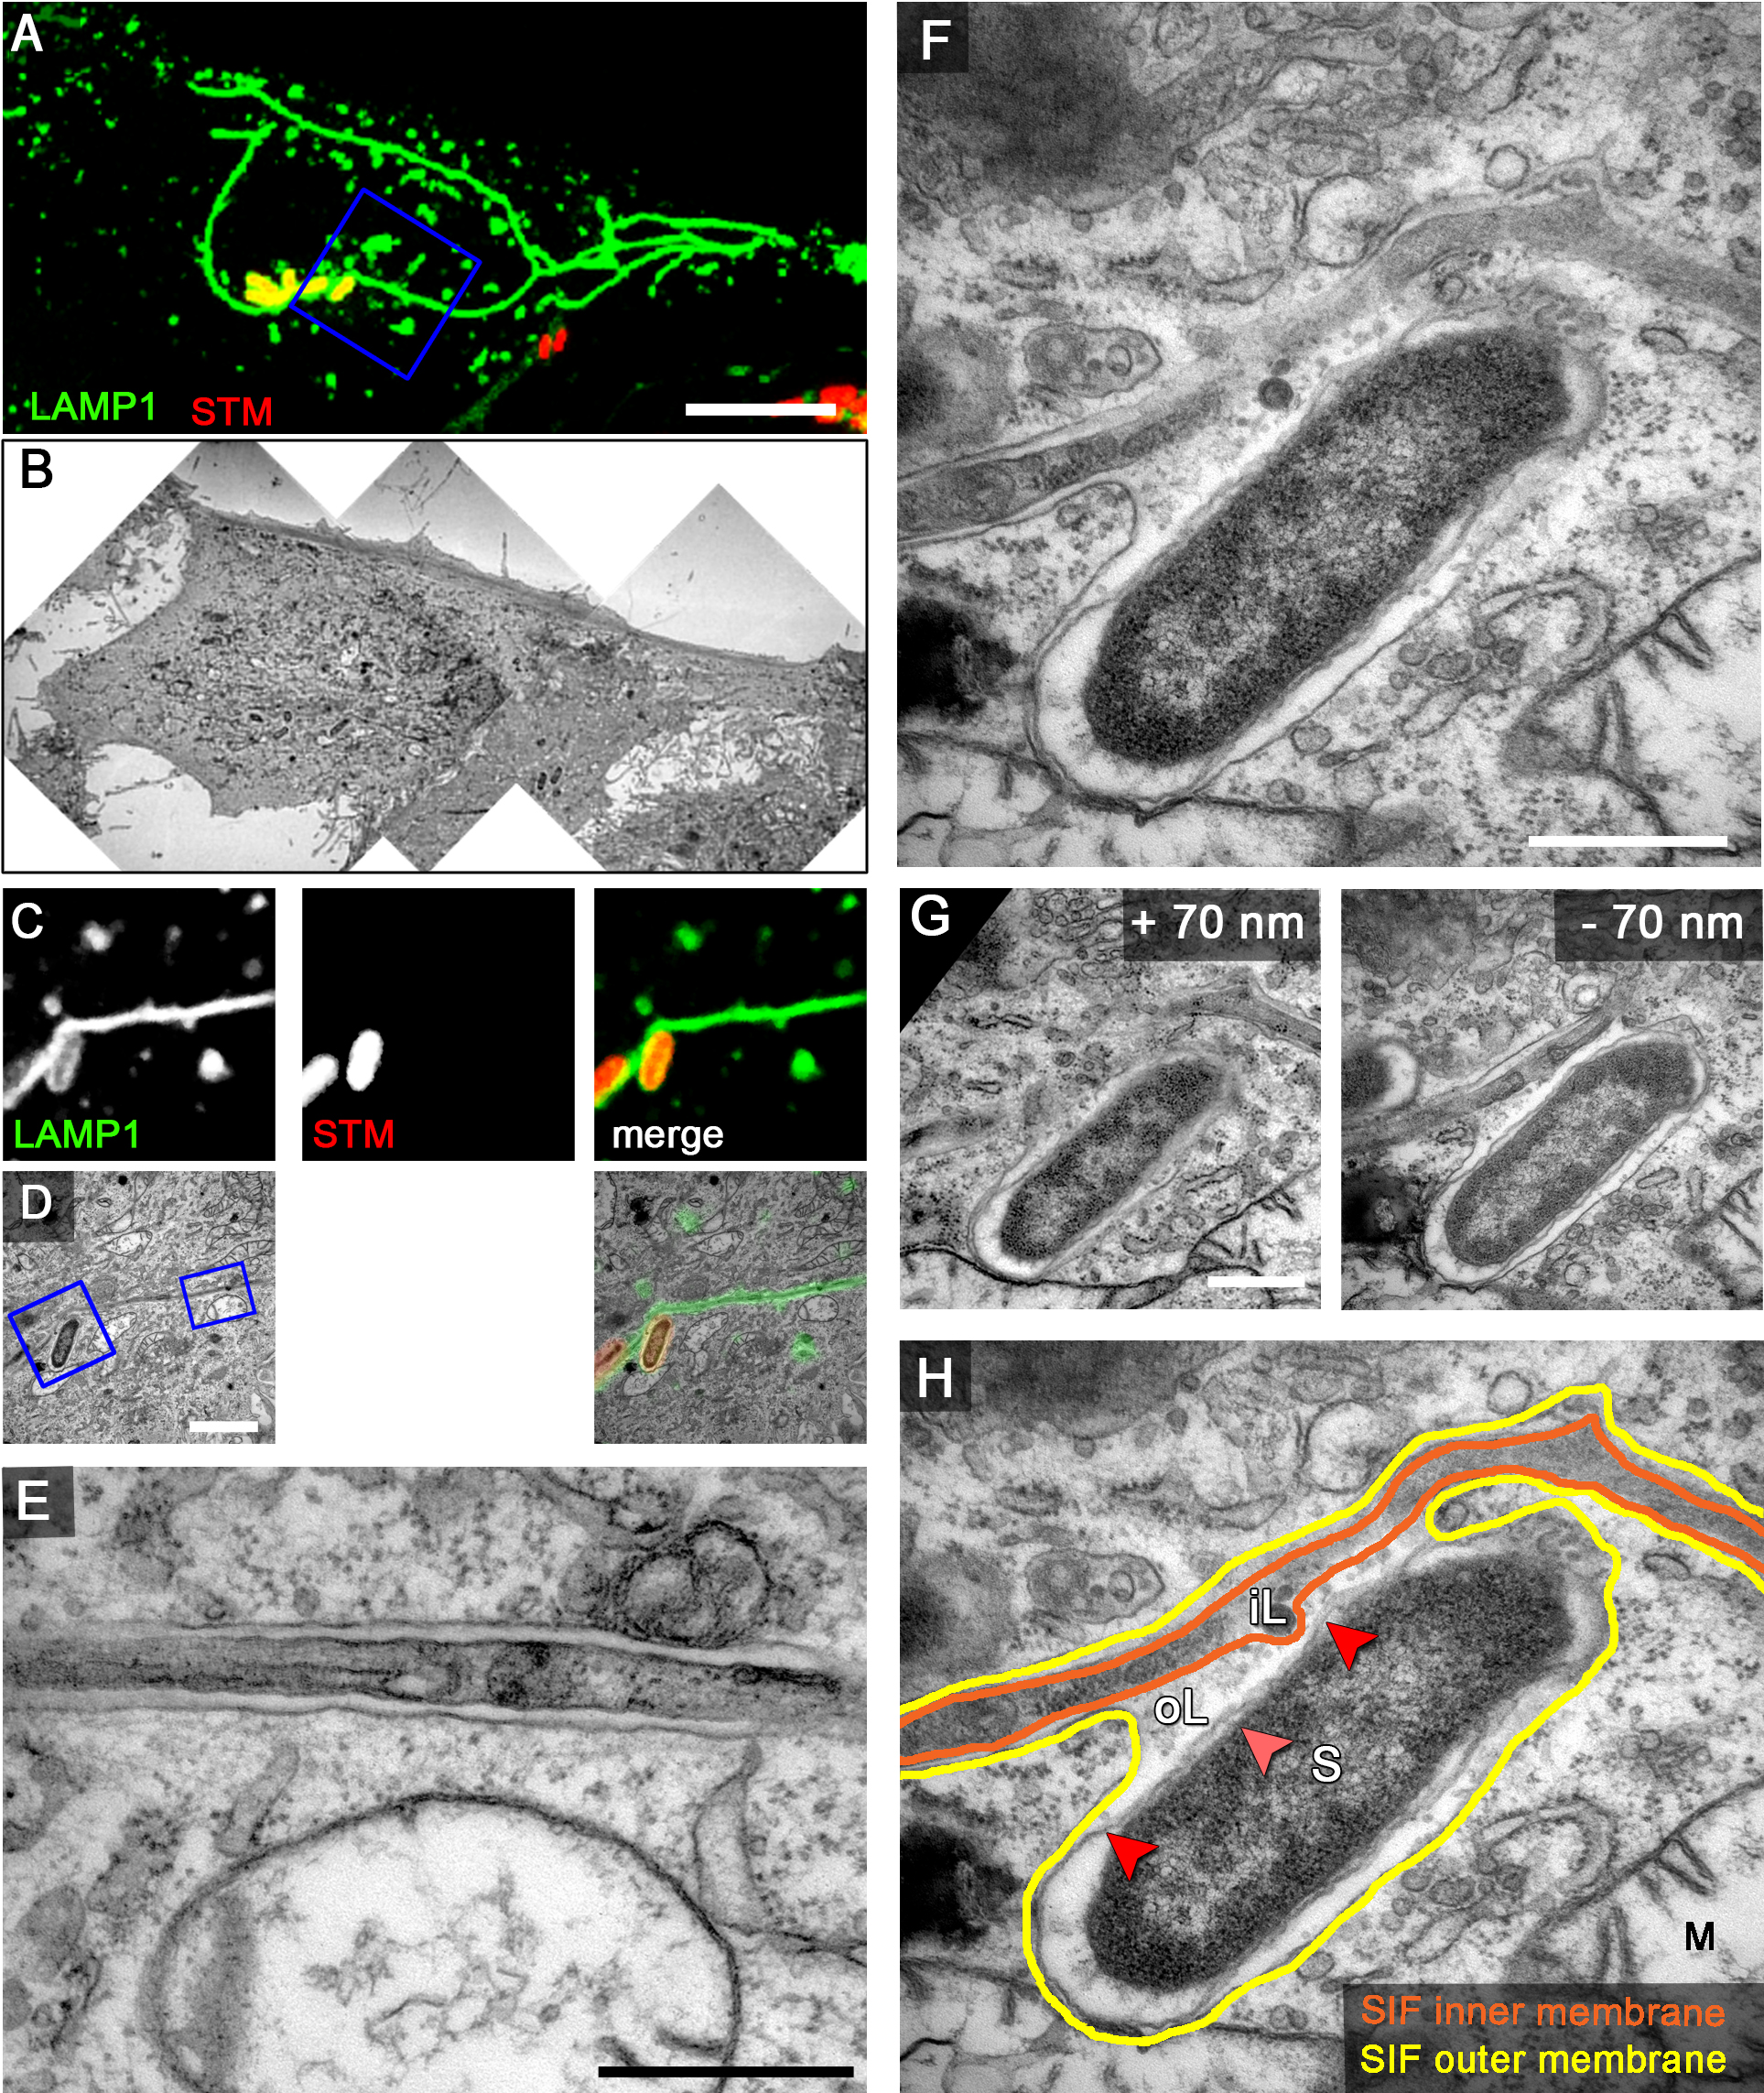
Figure 9. Examples of CLEM analyses of the intracellular lifestyle of Salmonella. HeLa cells expressing LAMP1-GFP (green) were seeded in Petri dishes with a gridded coverslip and infected with Salmonella expressing mCherry (STM, red). Live cell imaging was performed 8 h p.i. to visualize LAMP1-GFP-positive SIF (A. maximum intensity projection [MIP], C. single Z plane). Subsequently, the cells were fixed and processed for CLEM to reveal the ultrastructure of selected cells. Several low magnification images were stitched to visualize the cell morphology (B). Higher magnification images were used to align LM and TEM images (D). Note the formation of double membrane LAMP1-GFP-positive SIF. Details of a LAMP1-GFP-positive SIF (E) and an SCV linked to a SIF (F, G) are shown. G. Two additional ultrathin sections show the membrane organization of the SCV and SIF in corresponding to panel F. H. The inner and outer membrane of a SIF and SCV are outlined in orange and yellow, respectively. Light and dark red arrowheads indicate inner and outer membrane of the Salmonella cell envelope, respectively. Labels: S, Salmonella; M, mitochondria; iL, inner lumen; oL, outer lumen. A cell representative for 10 biological replicates is shown (1–3 technical replicates with each 2–4 cells). Scale bars: 10 µm (A, B), 2 µm (C, D), 500 nm (E, F, G).
Notes
- Be careful with toxic substances such as glutaraldehyde, osmium tetroxide, EPON, uranyl acetate and lead citrate. Familiarize yourself with safety instructions for handling, personal protection, and take care about correct waste disposal.
- Use disposable vessels for every solution containing EPON. It is difficult to clean EPON contaminated vessels, thus use disposable ones in which EPON is neutralized by polymerization in an oven at 60 °C for at least 48 h.
- This protocol is adjusted to investigations in cellular microbiology, in particular intracellular activities of Salmonella in HeLa cells. Other infection models require optimization regarding incubation times, concentrations, temperatures.
- Prepare critical solutions as fresh as possible prior to the experiment.
Recipes
- 1 M HEPES buffer (500 ml)
- Weigh 119.3 g HEPES
- Add autoclaved MilliQ water to 500 ml and mix well
- Adjust pH 7.4 by addition of 5 M HCl
- Autoclave to sterilize
- Buffer can be stored at RT up to several months
- For 0.2 M solution dilute 1:5 with water
- Weigh 119.3 g HEPES
- 2 M CaCl2 in H2O (10 ml)
- Weigh 2.22 g CaCl2
- Add autoclaved MilliQ water to 10 ml and mix well
- Autoclave to sterilize
- Reagent can be stored at 4 °C up to several months
- Weigh 2.22 g CaCl2
- 10% glycine in 0.2 M HEPES buffer (5 ml)
- Weigh 500 mg glycine
- Add 0.2 M HEPES to 5 ml and mix well
- Sterilize by filtration
- Solution can be stored at 4 °C up to several months
- For 50 mM add 37.6 µl of 10% solution to 1 ml 0.2 M HEPES buffer
- Weigh 500 mg glycine
- 1% ruthenium red (RR) in H2O (5 ml)
Note: Harmful if swallowed.- Weigh 50 mg RR
- Add autoclaved MilliQ water to 5 ml and mix well
- Aliquot 500 µl in Eppendorf tubes
- Aliquots can be stored at -20 °C up to several months
- Weigh 50 mg RR
- 15% potassium hexacyanoferrate(III) in H2O (5 ml)
- Weigh 750 mg K3[Fe(CN)6]
- Add autoclaved MilliQ water to 5 ml and mix well
- Aliquot 500 µl in Eppendorf tubes
- Aliquots can be stored at -20 °C up to several months
- Weigh 750 mg K3[Fe(CN)6]
- 2x fixative
5% glutaraldehyde + 10 mM CaCl2 in 0.4 M HEPES buffer (12.5 ml)
Note: Toxic! Dispose as special waste!- Fill 4.938 ml autoclaved MilliQ water in a dark glass flask
- Add 5 ml 1 M HEPES buffer (final 0.4 M)
- Add 2.5 ml from 25% glutaraldehyde (final 5%)
- Add 62.5 µl from 2 M CaCl2 (final 10 mM)
- Reagent can be stored at 4 °C for few days
- For 1x fixative, dilute 1:2 with water
- Fill 4.938 ml autoclaved MilliQ water in a dark glass flask
- Post-fixative
2% osmium tetroxide + 0.1% ruthenium red + 1.5% potassium hexacyanoferrate(III) in 0.2 M HEPES buffer (5 ml)
Note: Very toxic! Dispose as special waste!- Transfer complete content from the 0.1 g OsO4 ampule in a dark glass flask
- Add 3 ml autoclaved MilliQ water
- Add 1 ml 1 M HEPES buffer (final: 0.2 M)
- Close the flask and seal with parafilm
- Store the flask at 4 °C in fume hood overnight to dissolve OsO4 crystals
- The next day add additives: 0.5 ml from 1% ruthenium red (final 0.1%) and 0.5 ml from 15% potassium hexacyanoferrate(III) (final 1.5%)
- Mix well and use immediately at 4 °C
- Transfer complete content from the 0.1 g OsO4 ampule in a dark glass flask
- EPON resin
Note: Toxic! Dispose as special waste!
Solution A- Mix 31 ml of EPON 812 with 50 ml of DDSA in a plastic container
- Stir with wooden stick
- The solution can be stored at -20 °C up to several weeks
- Mix 50 ml of EPON 812 with 42.5 ml of MNA in a plastic vessel
- Stir with wooden stick
- The solution can be stored at -20 °C up to several weeks
- Mix Sol A + B 1:1 in plastic dish with syringe
- Add 1.5 Vol.-% DMP-30 (very viscous)
- Stir with wooden stick
- Reagent can be stored at -20 °C up to several days
- Mix 31 ml of EPON 812 with 50 ml of DDSA in a plastic container
- 2% uranyl acetate in H2O (100 ml)
Note: Very toxic! Chemically toxic and radioactive! Dispose as special waste!- Weigh 2 g uranyl acetate
- Add autoclaved MilliQ water to 100 ml and stir with magnetic stirrer
- Filter the solution with 0.2 µm nitrocellulose filter
- Transfer to dark glass flask
- Reagent can be stored at 4 °C up to several weeks
- Weigh 2 g uranyl acetate
- Lead citrate according to Reynolds (100 ml)
Note: Very toxic! Dispose as special waste!- Weigh 2.66 g lead nitrate and 3.52 g sodium citrate
- Add 60 ml MilliQ water (autoclaved, degassed by evacuation) and stir for 10 min on magnetic stirrer
- Allow to stand at RT for 10 min with intermittent shaking, solution will be of milky white color
- Add 11 ml of 1 N NaOH (carbonate-free) and mix, solution will turn clear
- Measure pH and adjust exactly to pH 12.0 by drop-wise adding 1 N NaOH (carbonate-free)
- Fill to 100 ml with about 28 ml MilliQ water (autoclaved, degased)
- Reagent can be stored at 4 °C up to several weeks
- Weigh 2.66 g lead nitrate and 3.52 g sodium citrate
- 3% nitric acid (HNO3) (1 L)
Note: Acidic!- To 954 ml autoclaved MilliQ water add 46 ml of 65% HNO3
- Filter the solution through 0.2 µm nitrocellulose filter
- The solution can be stored at RT up to several weeks
- To 954 ml autoclaved MilliQ water add 46 ml of 65% HNO3
Acknowledgments
Work in our group was supported by the DFG through grant HE1964/18-1 and the Z project of SFB944 ‘Physiology and dynamics of cellular microcompartments’.
References
- Ellis, E. A. (2014). Staining sectioned biological specimens for transmission electron microscopy: conventional and en bloc stains. Methods Mol Biol 1117: 57-72.
- Hagler, H. K. (2007). Ultramicrotomy for biological electron microscopy. Methods Mol Biol 369: 67-96.
- Krieger, V., Liebl, D., Zhang, Y., Rajashekar, R., Chlanda, P., Giesker, K., Chikkaballi, D. and Hensel, M. (2014). Reorganization of the endosomal system in Salmonella-infected cells: the ultrastructure of Salmonella-induced tubular compartments. PLoS Pathog 10(9): e1004374.
Article Information
Copyright
© 2015 The Authors; exclusive licensee Bio-protocol LLC.
How to cite
Readers should cite both the Bio-protocol article and the original research article where this protocol was used:
- Liss, V. and Hensel, M. (2015). Sample Preparation for Correlative Light and Electron Microscopy (CLEM) Analyses in Cellular Microbiology. Bio-protocol 5(19): e1612. DOI: 10.21769/BioProtoc.1612.
- Krieger, V., Liebl, D., Zhang, Y., Rajashekar, R., Chlanda, P., Giesker, K., Chikkaballi, D. and Hensel, M. (2014). Reorganization of the endosomal system in Salmonella-infected cells: the ultrastructure of Salmonella-induced tubular compartments. PLoS Pathog 10(9): e1004374.
Category
Cell Biology > Cell imaging > Electron microscopy
Cell Biology > Cell imaging > Live-cell imaging
Do you have any questions about this protocol?
Post your question to gather feedback from the community. We will also invite the authors of this article to respond.