- Protocols

- Articles and Issues
- For Authors
- About
- Become a Reviewer

Camalexin Quantification in Arabidopsis thaliana Leaves Infected with Botrytis cinerea


Published: Vol 5, Iss 2, Jan 20, 2015 DOI: 10.21769/BioProtoc.1379 Views: 11818
Reviewed by: Tie LiuSollapura J. Vishwanath
Original research article
The authors used this protocol in:

Jul 2014
Advertisement


Protocol Collections
Comprehensive collections of detailed, peer-reviewed protocols focusing on specific topics


Related protocols

Abstract
Phytoalexins are heterogeneous low molecular mass secondary metabolites with antimicrobial activity produced at the infection site in response to pathogen invasion and represent an important part of the plant defense repertoire. Camalexin (3-Thiazol-2′-yl-indole) is a known phytoalexin first detected and isolated in Camelina sativa, from which it takes its name, infected with Alternaria brassicae (Browne et al., 1991). Production of camalexin is also induced in Arabidopsis thaliana leaves by a range of biotrophic and necrotrophic plant pathogens (bacteria, oomycetes, fungi and viruses) (Ahuja et al., 2012) as well as by abiotic stresses, such as UV and chemicals (e.g. acifluorfen, paraquat, chlorsulfuron and α-amino butyric acid) (Zhao et al., 1998; Tierens et al., 2002). Camalexin originates from tryptophan and CYP79B2 and CYP71B15 (PAD3) are P450 enzymes that catalyze important steps in its biosynthetic pathway (Glawischnig, 2007).
The detection and quantification of camalexin content is required to understand how it is produced upon various stress conditions. Here we describe an easy method for camalexin extraction from Arabidopsis leaves infected with the necrotrophic fungus Botrytis cinerea, and further determination of camalexin levels by liquid chromatography–mass spectrometry (LC-MS). The method is sensitive enough to trace amount of camalexin down to the low pico-gram (10 pg/mg FW) range.
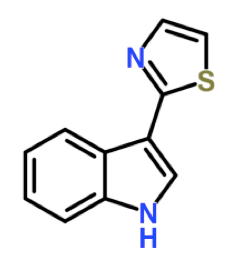
Figure 1. The structural formula of camalexin
Materials and Reagents
- Arabidopsis leaves
- Liquid nitrogen
- Dichloromethane (DCM) (Sigma-Aldrich, catalog number: 270997 )
- Methanol (LC/MS grade) (Carlo Erba Reagents, catalog number: 414831 )
- Formic acid (gradient grade) (Sigma-Aldrich, catalog number: F0507 )
- Water with 0.1% formic acid (LC/MS grade) (Sigma-Aldrich, catalog number: 34673 )
- Camalexin standard (Sigma-Aldrich, catalog number: SML1016 )
- Extraction buffer (see Recipes)
Equipment
- Mortar and pestle
- Spatula
- Glass Pasteur pipettes
- Tube adapters
- Screw cap round bottom borosilicate glass culture tubes (16 x 125 mm) (Pyrex) (Sigma-Aldrich, catalog number: Z653594-40EA )
- Disposable borosilicate glass culture tubes (Pyrex)
- Spin-X centrifuge tube filters with nylon membranes (Sigma-Aldrich, catalog number: CLS8170-200EA )
- Glass vials with cap (capacity: 100 µl)
- Vortex mixer
- Rocking shaker
- Nitrogen evaporator (e.g. sample concentrator with dry block DB-3D) (Techne) (Figure 1)
- Balance
- Variable speed refrigerated centrifuge with rotor having number of rotor cavities x nominal largest load (capacity: 8 x 50 ml) (e.g. Beckman Coulter)
- HPLC (e.g. Thermo Fisher Scientific, model: UltiMate 3000 HPLC )
- High performance reversed-phase columns C18 for the separation of small molecules (e.g. Acclaim120 C18 Reverse-phase column-3 μm, 200 Å, 2.1 x 150 mm) (Thermo Fisher Scientific, catalog number: 059130 )
- ESI-Mass Spectrometer (e.g. Orbitrap XL Discovery, Thermo Fisher Scientific)
Software
- Analysis software (e.g. Thermo Xcalibur software 2.10, Thermo Fisher Scientific)
Procedure
- Preparation of plant material
Notes:
- At least 50-100 mg of 4-week-old Arabidopsis plant leaves are required.
- Arabidopsis leaves should be weighed before freezing in liquid nitrogen.
- At least 4 biological replicates for each sample should be analyzed.
- Prepare and pre-cool the extraction buffer.
- Pre-cool centrifuge rotor at 4 °C.
- Freeze weighed Arabidopsis leaves in liquid nitrogen.
- Grind the leaf tissue into powder by using mortar and pestle.
- Transfer each sample into a round bottom screw-capped borosilicate glass tube (Pyrex) by using the spatula.
- Keep the sample in ice.
- At least 50-100 mg of 4-week-old Arabidopsis plant leaves are required.
- Camalexin extraction
- Add extraction buffer in each tube, keeping the ratio 1:10 [tissue (mg): extraction buffer (µl)].
- Vortex the samples for 20 sec.
- Shake tubes on the rocking shaker (30 min, 100 rpm, 4 °C).
- Add DCM in each sample keeping the ratio 1:2 [extraction buffer (µl): DCM (µl)].
- Shake tubes on the rocking shaker (30 min, 100 rpm, 4 °C).
- Centrifuge (10 min, 5,000 x g, 4 °C).
Note: After centrifugation two phases will form. Camalexin is contained in the lower green phase while the upper phase contains mostly DCM. Plant debris will be present between the two layers.
- Collect the lower phase by using a glass Pasteur pipette and transfer it into disposable borosilicate glass culture tubes (Pyrex).
Note: Special attention should be paid not to recover any material floating in the interface between the two phases.
- Concentrate the collected lower phase under nitrogen gas flow (10 bar) and heating the tubes at 42 °C.
- Allow sample to completely dry and then suspend it in methanol with a ratio 1:1 [tissue (mg): methanol (µl)].
- Filter samples by using spin-X centrifuge tube (5 min, 10,000 x g, 4 °C).
- Transfer the filtered samples into glass-capped vials.
- Add extraction buffer in each tube, keeping the ratio 1:10 [tissue (mg): extraction buffer (µl)].
- Camalexin detection and quantification
HPLC coupled to MS
- Inject 20 µl per sample in an Ultimate3000 HPLC system equipped with a Acclaim120 C18 Reverse-phase column. The mobile phase consists of water with 0.1% formic acid (LC/MS grade), as solvent A, and methanol with 0.1% formic acid (LC/MS grade), as solvent B. Settings:
Flow rate: 0.2 ml/min
Column temperature: 35 °C
Solvent gradient for chromatographic separation:
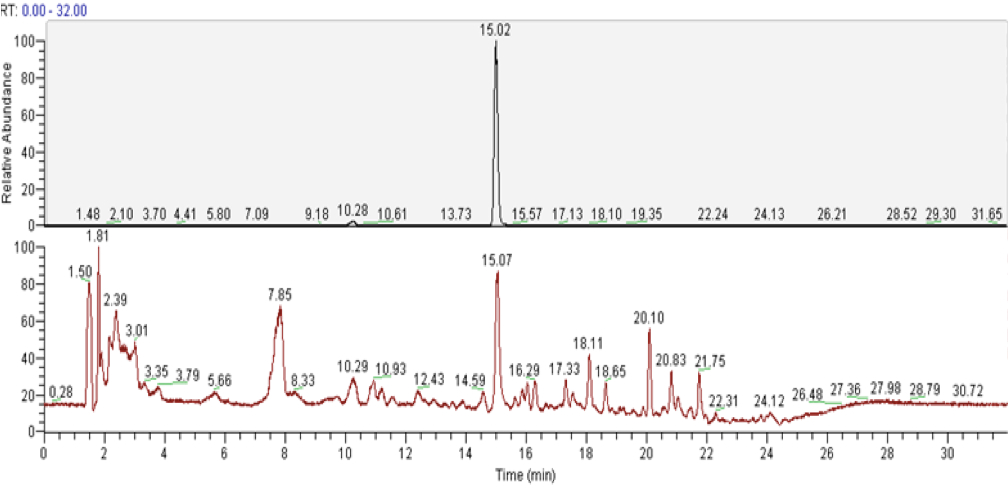
In these conditions camalexin will elute with a retention time of 15 min (see Figure 3).
- Electrospray the effluent from the HPLC directly into the mass spectrometer (Orbitrap XL Discovery) operating in full-scan MS with resolution R = 30,000. Collect data in centroid mode at mass range of m/z 120-310. Settings:
Ionization mode: positive
Ion spray voltage: 4.5 kV
Capillary temperature: 250 °C
Sheath Gas Flow rate 35 (arbitrary units)
Aux Ga flow rate 25 (arbitrary units)
- Determine the abundance of camalexin by using the calibration curve method. Use a concentration of camalexin 800-400-200-100-50-25-12.5-6.25-3.12 ng/ml for the preparation of standard curve solutions (see Figure 4).
- Inject 20 µl per sample in an Ultimate3000 HPLC system equipped with a Acclaim120 C18 Reverse-phase column. The mobile phase consists of water with 0.1% formic acid (LC/MS grade), as solvent A, and methanol with 0.1% formic acid (LC/MS grade), as solvent B. Settings:
Representative data
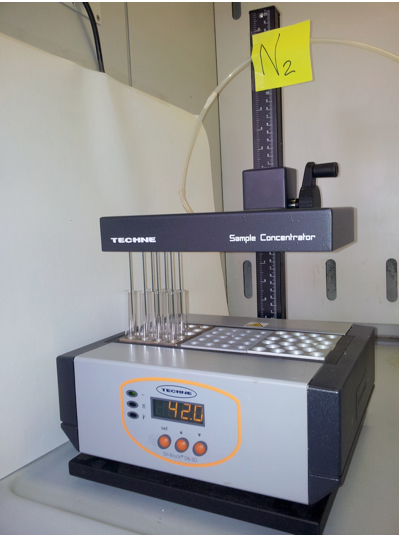
Figure 2. Sample concentration. Evaporation is increased by passing an inert gas (N2) over the surface of the sample to remove the solvent. The gas travels through the gas chamber to the samples via the needles.
A
B
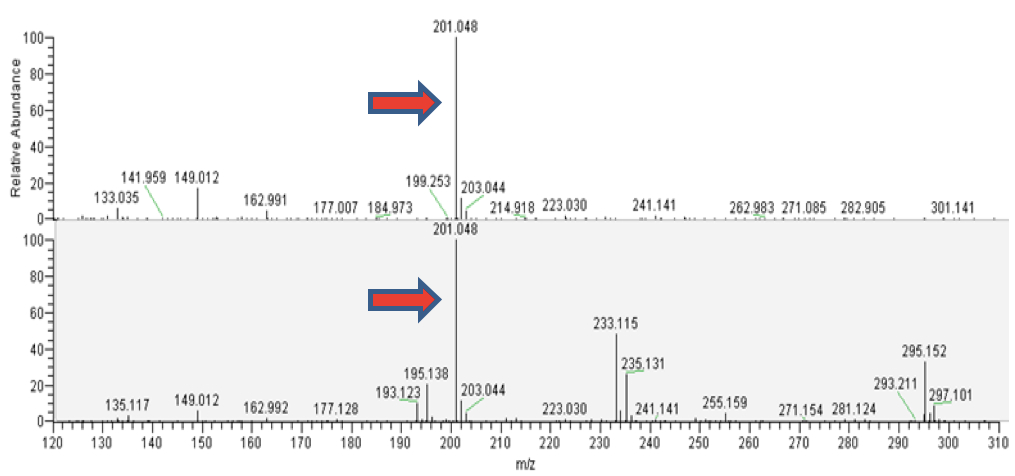
Figure 3. LC-MS analyisis of camalexin from external standard (upper panels) and from the plant tissue (lower panels). A. Total ion chromatograms (TICs). B. ESI mass spectra in positive ionization mode. The mass of 201.048 corresponds to C11H9N2S, the protonated form of camalexin [M+H]+ (red arrows).
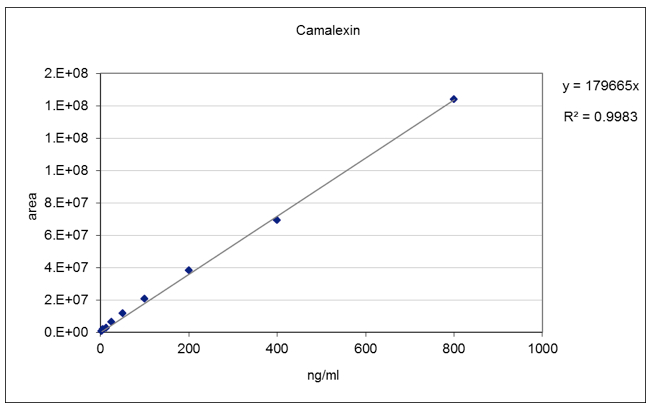
Figure 4. Camalexin standard curve. A linear standard curve was obtained in the concentration range between 3.12 - 800 ng/ml.
Recipes
- Extraction buffer
2-propanol: H2O: HCl 37% (2:1:0.002, vol/vol/vol)
Acknowledgments
This work was supported by the European Research Council (advanced grant no. 233083). Part of the procedures were adapted from a previously described protocol for quantitative analysis of major plant hormones from crude plant extracts (Pan et al., 2010).
References
- Ahuja, I., Kissen, R. and Bones, A. M. (2012). Phytoalexins in defense against pathogens. Trends Plant Sci 17(2): 73-90.
- Browne, L. M., Conn, K. L., Ayert, W. A. and Tewari, J. P. (1991). The camalexins: New phytoalexins produced in the leaves of camelina sativa (cruciferae). Tetrahedron 47(24): 3909-3914.
- Glawischnig, E. (2007). Camalexin. Phytochemistry 68(4): 401-406.
- Pan, X., Welti, R. and Wang, X. (2010). Quantitative analysis of major plant hormones in crude plant extracts by high-performance liquid chromatography-mass spectrometry. Nat Protoc 5(6): 986-992.
- Tierens, K. F. J., Thomma, B. P., Bari, R. P., Garmier, M., Eggermont, K., Brouwer, M., Penninckx, I. A., Broekaert, W. F. and Cammue, B. (2002). Esa1, an Arabidopsis mutant with enhanced susceptibility to a range of necrotrophic fungal pathogens, shows a distorted induction of defense responses by reactive oxygen generating compounds. Plant J 29(2): 131-140.
- Zhao, J., Williams, C. C. and Last, R. L. (1998). Induction of Arabidopsis tryptophan pathway enzymes and camalexin by amino acid starvation, oxidative stress, and an abiotic elicitor. Plant Cell 10(3): 359-370.
Article Information
Copyright
© 2015 The Authors; exclusive licensee Bio-protocol LLC.
How to cite
Readers should cite both the Bio-protocol article and the original research article where this protocol was used:
- Savatin, D. V., Bisceglia, N. G., Gravino, M., Fabbri, C., Pontiggia, D. and Mattei, B. (2015). Camalexin Quantification in Arabidopsis thaliana Leaves Infected with Botrytis cinerea. Bio-protocol 5(2): e1379. DOI: 10.21769/BioProtoc.1379.
- Savatin, D. V., Bisceglia, N. G., Marti, L., Fabbri, C., Cervone, F. and De Lorenzo, G. (2014). The Arabidopsis NUCLEUS- AND PHRAGMOPLAST-LOCALIZED KINASE1-Related Protein Kinases Are Required for Elicitor-Induced Oxidative Burst and Immunity. Plant Physiol 165(3): 1188-1202.
Category
Plant Science > Plant immunity > Perception and signaling
Plant Science > Plant biochemistry > Other compound
Microbiology > Microbe-host interactions > In vivo model > Plant
Do you have any questions about this protocol?
Post your question to gather feedback from the community. We will also invite the authors of this article to respond.