- Protocols

- Articles and Issues
- For Authors
- About
- Become a Reviewer

Hypoxia Studies with Pimonidazole in vivo


Published: Vol 4, Iss 19, Oct 5, 2014 DOI: 10.21769/BioProtoc.1254 Views: 28884
Reviewed by: Ralph BottcherHongLok Lung
Original research article
The authors used this protocol in:
Feb 2014
Advertisement


Protocol Collections
Comprehensive collections of detailed, peer-reviewed protocols focusing on specific topics


Abstract
Therapy-induced hypoxia drives changes in the tumor microenvironment that contribute to the poor response to therapy. Hypoxia is capable of driving the expression and/or activation of specific signaling cascades (e.g., c-Met, Axl, CTGF), the recruitment of tumor promoting immune cells, and the induction of cell survival pathways including autophagy (Phan et al., 2013; Hu et al., 2012; Ye et al., 2010). We have recently shown that anti-VEGF therapy-induced hypoxia can result in changes in the extracellular matrix that contribute to the aggressiveness of tumors post therapy (Aguilera et al., 2014). Importantly, therapies that induce hypoxia do not always increase epithelial plasticity and tumor aggressiveness (Ostapoff et al., 2013; Cenik et al., 2013). We have used pimonidazole to evaluate hypoxia in tumors and herein provide a detailed protocol for this useful tool to interrogate the levels of hypoxia in vivo.
The utility of the HypoxyprobeTM (pimonidazole hydrochloride) immunohistochemical analysis approach allows for the assessment of hypoxia in different tissues as well as cell types. Pimonidazole is a 2-nitroimidazole that is reductively activated specifically in hypoxic cells and forms stable adducts with thiol groups in proteins, peptides, and amino acids (Cenik et al., 2013; Arnold et al., 2010; Raleigh and Koch, 1990; Raleigh et al., 1998). Furthermore, the amount of pimonidazole that is detected is directly proportional to the level of hypoxia within tumors.
Materials and Reagents
- HypoxyprobeTM-1 Plus Kit (HypoxyprobeTM, catalog number: HP1-1000Kit )
- A rabbit, FITC-conjugated, secondary reagent is included in the HypoxyprobeTM-1 Plus Kit (HypoxyprobeTM, catalog number: HP1-1000Kit)
- Sodium chloride ACS reagent (Sigma-Aldrich, catalog number: S9888 )
- Milli Q H2O
- Corning bottle-top vacuum filter system (Sigma-Aldrich, catalog number: CLS430769 )
- PBS (Sigma-Aldrich, catalog number: P-4417 )
- Anti-CD31 antibody (Dianova GmbH, catalog number: DIA-310 )
- Anti-Meca32 antibody (Abcam, catalog number: ab27853 )
- Anti-Endomucin antibody (Millipore, catalog number: MAB2624 )
- Cy3-conjugated secondary IgG (Jackson ImmunoResearch Laboratories)
- Tissue-Tek OCT compound (Ted Pella, catalog number: 27050 )
- Liquid nitrogen
- IsoFlo (isoflurane, USP) (Abbott Laboratories, catalog number: 05260-05 )
- Carbon dioxide (Sigma-Aldrich, catalog number: 295108 -227G)
- Superfrost plus; white microscope slides (Thermo Fisher Scientific, catalog number: 12-550-15 )
- Liquid scintillation vials, plastic (Sigma-Aldrich, catalog number: M2026 -1000EA)
- Prolong gold antifade mountant (Life Technologies, catalog number: P10144 )
- Aqua Block/EIA/WB (EastCoast Bio, catalog number: PP82 )
- Acetone (Sigma-Aldrich, catalog number: 320110 )
- Micro cover glasses, rectangular, No. 1 (VWR International, catalog number: 48393-106 )
- Tween 20 (Sigma-Aldrich, catalog number: P9416 -50ML)
- 0.9% saline (see Recipes)
- 30 mg/ml pimonidazole in 0.9% saline (see Recipes)
- Antibody diluent (see Recipes)
- 20% aqua block (see Recipes)
- PBS-t (see Recipes)
Equipment
- Cryostat (Leica, catalog number: CM3050 S )
- Low profile microtome blades (Accu Edge, catalog number: 4689 )
- Surgical equipment (Braintree Scientific)
- Fluorescent or bright-field microscope (Nikon Eclipse, model: E600 )
- Fluorescent microscope camera (Photometrics, Cool Snap HQ)
- Nikon filters (FITC: 96170M F HQ, Cy3/TRITC: 96171M R HG, DAPI/nuclei: 96101M UV-2E/C)
- 30 G x 1/2 in. precision glide needles (BD Biosciences, catalog number: 305106 )
- Tuberculin syringe only (BD Biosciences, catalog number: 309659 )
- Tailveiner restrainer for mice (Braintree Scientific, catalog number: TV-150 STD )
Software
- NIS Elements software, ImageJ (open source software: http://imagej.nih.gov/ij/), or other image analysis software
Procedure
The following procedure measures hypoxia in tumor-bearing mice and can be used at any respective end point of an animal experiment.
- The HypoxyprobeTM (pimonidazole hydrochloride) is resuspended at a concentration of 30 mg/ml in 0.9% sterile saline.
- Multiple mice (n = 5 per group is optimal for statistical relevance) are injected intravenously (tail vein) with 60 mg/kg of the pimonidazole solution.
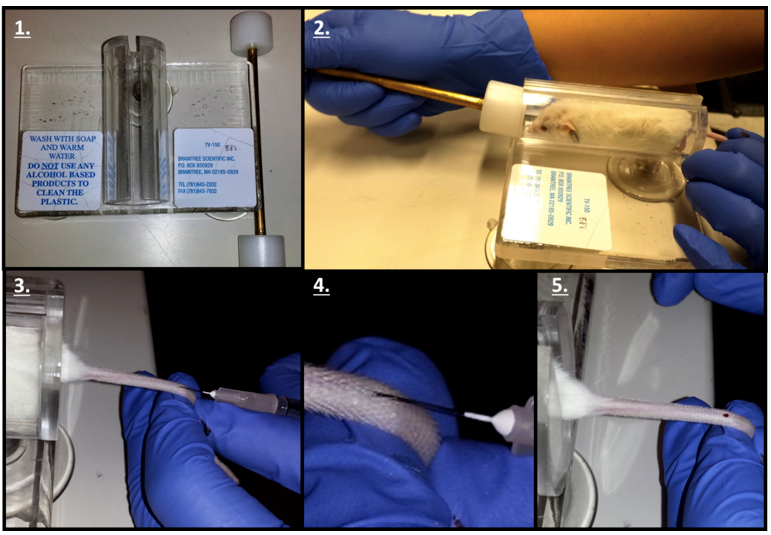
Figure 1. Tail Vein Injection protocol. 1. Obtain a Tailveiner Restrainer. 2. Insert mouse and push the restrainer to set the mouse in position. 3. Rotate the tail 45 degrees in order to find and inject the tail vein with the needle. 4. Close representation of the tail vein injection. 5. The appearance of blood validates a successful tail vein injection. - Let circulate in vivo for 90 min before the mice are euthanazied with isoflurane or carbon dioxide (CO2).
Note: For animal euthanasia: In compliance with proper IACUC protocols, animals are placed in a drop jar or vaporizer in the presence of controlled concentrations of isoflurane or CO2 in order to ensure proper inhalation. Animals are then sacrificed by a secondary method with cervical dislocation. - Organs are then removed, weighed, snap-frozen, and stored in plastic scintillation vials at -80 °C.
Note: The pimonidazole stain can work on paraffin-embedded tissue, frozen tissue, and cell lines. - Organs are then taken out of the scintillation vials, embedded in OCT, placed in a cryostat, and cut into 10 µm-thick sections. Sections are placed on microscope slides for staining.
Notes:
Cryostat settings- Temperature used can range from -10 to -50 °C depending on tissue type, though -20 °C is recommended for the majority of tissues.
- Alternate between “Trimming mode” (cuts 5 - 150 µm) and “Sectioning mode” (0.5 - 50 µm) in order to adjust the tissue for the beginning of section collection.
- The speed of sectioning is dependent of the researcher’s own speed.
- As many sections as necessary can be cut per organ used.
- To achieve a proper representation of the sample, cut non-serial sections of the tissue.
- Temperature used can range from -10 to -50 °C depending on tissue type, though -20 °C is recommended for the majority of tissues.
- Frozen tissue sections are then interrogated with FITC-conjugated anti-pimonidazole primary antibody (included in kit) and endothelial cell markers (CD31, Meca-32, or endomucin) followed by respective Cy3-conjugated secondary IgG. Use a slide incubated with only antibody diluent as its primary antibody as a negative control.
- The Hypoxyprobe™-1 Plus Kit recommends a 1:50 - 100 dilution of the secondary rabbit anti-FITC horseradish peroxidase conjugated antibody.
- For other primary antibodies a 1:50 - 1:100 dilution is recommended, unless otherwise specified by respective primary antibody data sheets.
Notes:- Any suitably labeled, secondary anti-FITC antibody can be used which would bind to the pimonidazole adducts in hypoxic cells within the tissues.
- This staining should be done within a week of harvesting the organs as the signal will begin to fade.
- The interrogation of hypoxia within animal tissues is not limited to fluorescent staining as it can be done with brown stain (DAB) as well. Respective primary and secondary antibodies can be utilized to achieve both types of staining.
- Any suitably labeled, secondary anti-FITC antibody can be used which would bind to the pimonidazole adducts in hypoxic cells within the tissues.
- The Hypoxyprobe™-1 Plus Kit recommends a 1:50 - 100 dilution of the secondary rabbit anti-FITC horseradish peroxidase conjugated antibody.
- Example of a fluorescent tissue-staining protocol for frozen sections:
- Air dry frozen slides.
- Fix the slides with Acetone for 30 sec - 2 min.
- Briefly air dry sections a few seconds (do not let tissue dry completely).
- Rehydrate sections with PBS-t 2 times, 5 min each.
Note: Once the tissue is rehydrated, do not let the slides dry out. - Block in your favorite blocking solution (typically 20% aqua block in PBS) 10 - 30 min.
- Pour off the blocking solution, add primary antibody and incubate 1 h at room temperature-overnight at 4 °C.
- Wash the slides with PBS-t 3 times, 5 min each.
- Incubate the slides with secondary antibody 1 h at room temperature.
- Wash with PBS-t 4 times, 5 min each.
- Mount the slides with prolong gold mounting solution and coverslip.
- Apply sealant (e.g. clear nail polish) along the edges of the coverslips to preserve the slides.
- Image the slides.
- Air dry frozen slides.
- Imaging of tissue sections should then be obtained with 20x or 40x microscopic magnification as desired and analyzed using NIS Elements software or ImageJ (open source software).
Notes:- The filters on the microscope should include the following wavelengths for fluorescent microscopy:
- FITC (green 470-520 nm)
- Cy3/TRITC (red 530-570 nm)
- DAPI/nuclei (blue 345-455 nm)
- FITC (green 470-520 nm)
- Six to eight images per tissue area are recommended in order to capture the variable signal intensity in a wide representative sample of the respective tissue.
- The negative control slide from step 6 should be used as a background control. With the image analysis software, once the threshold of “background” is calculated use this threshold to image the remaining sections and ultimately normalize them to this threshold to eliminate the background.
- The filters on the microscope should include the following wavelengths for fluorescent microscopy:
Representative data

Figure 2. Representative data (taken from Reference 1). 6-week-old KIC mice were treated with saline or mcr84 for 1 week. Animals were sacrificed 1 h after pimonidazole injection (i.v.). Tissue was stained for endothelial cells (MECA32, red) and pimonidazole adducts (Hypoxyprobe, green). Hypoxic area was quantified and is presented on the right. Error bars: *P<0.05, one-way ANOVA with Tukey multiple comparison test. Pancreata from 6 animals were sectioned per treatment group, an average intensity value was determined for each organ and the intensities were averaged and the SEM was calculated. Please view this reference for more information on the model and context of the representative data.
Figure 3. Representative data (taken from Aguilera et al., 2014). The amount of hypoxia within tumors was quantified using an antibody, FITC-conjugated mouse anti-pimonidazole, directed against an adduct that forms when Hypoxyprobe-1 enters hypoxic tissue. The percentage of threshold area was quantified and two separate experiments were combined by normalization to data from Sparc+/+ mice. Images display hypoxia (green) near the vasculature (red) stained with the rat antimouse endothelial cell (Meca-32) antibody within tumors. Nuclei are marked with DAPI (blue). Error bars: *P<0.05, student’s t-test. Please view this reference for more information on the model and context of the representative data.
- Representative data from our experiments are published in Aguilera et al. (2014), Arnold et al. (2010), Cenik et al. (2013) and Ostapoff et al. (2013).
- Other representative data in a tumor-bearing model can be found in Graves et al. (2010), and background information on the establishment of this assay can be found in Raleigh et al. (1998) defining the use of pimonidazole as a marker of hypoxia.
Recipes
- 0.9% saline
Mix 0.9 grams of sodium chloride (NaCl) in 100 ml milli Q H2O
Filter - 30 mg/ml pimonidazole in 0.9% saline
30 mg of pimonidazole in 1 ml of filtered 0.9% saline - Antibody diluent (unless otherwise specified in the HypoxyprobeTM-1 Plus Kit)
5% BSA in PBS - 20% aqua block
20 ml aqua block in 80 ml PBS - PBS-t
200 µl of Tween 20 in 99.8 ml PBS
Acknowledgments
Drs. Bercin Kutluk Cenik and Shanna Arnold for information on this assay, Dr. Miao Wang for the tail vein injection procedure, and Dr. Michael Dellinger for the frozen slide staining protocol. This work is supported in part by a sponsored research agreement from Affitech AS (RAB), the NIH (R01CA118240 to RAB; F31CA168350 to KYA; U01CA141576 and R01CA137181 to DHC), and the Effie Marie Cain Scholarship for Angiogenesis Research (RAB).
References
- Aguilera, K. Y., Rivera, L. B., Hur, H., Carbon, J. G., Toombs, J. E., Goldstein, C. D., Dellinger, M. T., Castrillon, D. H. and Brekken, R. A. (2014). Collagen signaling enhances tumor progression after anti-VEGF therapy in a murine model of pancreatic ductal adenocarcinoma. Cancer Res 74(4): 1032-1044.
- Arnold, S. A., Rivera, L. B., Miller, A. F., Carbon, J. G., Dineen, S. P., Xie, Y., Castrillon, D. H., Sage, E. H., Puolakkainen, P., Bradshaw, A. D. and Brekken, R. A. (2010). Lack of host SPARC enhances vascular function and tumor spread in an orthotopic murine model of pancreatic carcinoma. Dis Model Mech 3(1-2): 57-72.
- Cenik, B. K., Ostapoff, K. T., Gerber, D. E. and Brekken, R. A. (2013). BIBF 1120 (nintedanib), a triple angiokinase inhibitor, induces hypoxia but not EMT and blocks progression of preclinical models of lung and pancreatic cancer. Mol Cancer Ther 12(6): 992-1001.
- Graves, E. E., Vilalta, M., Cecic, I. K., Erler, J. T., Tran, P. T., Felsher, D., Sayles, L., Sweet-Cordero, A., Le, Q. T. and Giaccia, A. J. (2010). Hypoxia in models of lung cancer: implications for targeted therapeutics. Clin Cancer Res 16(19): 4843-4852
- Hu, Y.-L., Jahangiri, A., DeLay, M. and Aghi, M. K. (2012). Tumor cell autophagy as an adaptive response mediating resistance to treatments such as antiangiogenic therapy. Cancer Res 72(17): 4294-4299.
- Ostapoff, K. T., Awasthi, N., Cenik, B. K., Hinz, S., Dredge, K., Schwarz, R. E. and Brekken, R. A. (2013). PG545, an angiogenesis and heparanase inhibitor, reduces primary tumor growth and metastasis in experimental pancreatic cancer. Mol Cancer Ther 12(7): 1190-1201.
- Phan, V. T., Wu, X., Cheng, J. H., Sheng, R. X., Chung, A. S., Zhuang, G., Tran, C., Song, Q., Kowanetz, M., Sambrone, A., Tan, M., Meng, Y. G., Jackson, E. L., Peale, F. V., Junttila, M. R. and Ferrara, N. (2013). Oncogenic RAS pathway activation promotes resistance to anti-VEGF therapy through G-CSF-induced neutrophil recruitment. Proc Natl Acad Sci U S A 110(15): 6079-6084.
- Raleigh, J. A. and Koch, C. J. (1990). Importance of thiols in the reductive binding of 2-nitroimidazoles to macromolecules. Biochem Pharmacol 40(11): 2457-2464.
- Raleigh, J. A., Calkins-Adams, D. P., Rinker, L. H., Ballenger, C. A., Weissler, M. C., Fowler, W. C., Novotny, D. B. and Varia, M. A. (1998). Hypoxia and vascular endothelial growth factor expression in human squamous cell carcinomas using pimonidazole as a hypoxia marker. Cancer Res 58(17): 3765-3768.
- Ye, X., Li, Y., Stawicki, S., Couto, S., Eastham-Anderson, J., Kallop, D., Weimer, R., Wu, Y. and Pei, L. (2010). An anti-Axl monoclonal antibody attenuates xenograft tumor growth and enhances the effect of multiple anticancer therapies. Oncogene 29(38): 5254-5264.
Article Information
Copyright
© 2014 The Authors; exclusive licensee Bio-protocol LLC.
How to cite
Aguilera, K. Y. and Brekken, R. A. (2014). Hypoxia Studies with Pimonidazole in vivo. Bio-protocol 4(19): e1254. DOI: 10.21769/BioProtoc.1254.
Category
Cancer Biology > Cellular energetics > Tumor microenvironment > Metabolism
Cancer Biology > General technique > Biochemical assays > Protein analysis
Cell Biology > Cell metabolism > Other compound
Do you have any questions about this protocol?
Post your question to gather feedback from the community. We will also invite the authors of this article to respond.