
- Home
- Protocols

-

Myotube morphology, surface area and fusion index quantification
Last updated date: Oct 21, 2021 Views: 964 Forks: 0
Detail protocol for the quantification of myotube fusion index and morphology:
C2C12 myoblast cells were cultured on 6 well cell culture plates and after 7 days of differentiation either cells were fixed with 2% PFA (For fusion index) or cells were directly imaged under the IX73 microscope (10X objective, Olympus, Japan). For each experimental condition, 5- 6 bright field images were captured randomly from 6 well plate.
For fusion index, differentiated myotube growing on coverslip were washed with 1X PBS and fixed with 2% PFA. After washing with 1XPBS 3 times, cells were permeabilized with 0.1% TritonX100 for 5 minutes at room temperature and subsequently blocking was done with 5% goat serum for 30 minutes. Cells were stained with DAPI (1uM) for 15 minutes and after washing with 1X PBS, coverslip were mounted on slides with ProLong Diamond anti-fading agent. Cells were imaged with Olympus IX73 microscope (10X objective, Olympus, Japan) with bright field and DAPI filter. For the quantification of Fusion index (number of nuclei incorporated within the myotube/ total number of nuclei present in that view field), all acquired Tiff Image were open in Fiji (ImageJ) as steps follows here:
- Make merged image file with Bright field and DAPI stained image and adjust brightness or contrast so that it can delineate the boundary of the differentiated myotube and incorporated nuclei (Step1).
- To determine the total number of nuclei in the merged image, convert Tiff DAPI merged file image to type 8-bit image (Step2).
- Apply threshold selection tool for 8-bit image (keep threshold-set, Minimum=70, maximum= 255, Background= B&W)(Step3).
- Sometimes we can see two or many close nuclei, and very difficult to count distinctly, for that- go to Process→Binary→ Apply Watershed. This will helps for the counting of closely spaced nuclei. If we are not applying watershed then it will show image of fused nuclear area, which is also helpfulsometime for the identification of closely spaced nuclear region, especially for the crowded cells field of view.
- To analyze the results, go to Analyzep article tool: Set size- 50 to Infinity, Circularity- 0.00- 1.00, Show- Outlines; and Check parameter on Display results, Clear results, Exclude on edges, summarize. Hit Ok, to get the final quantification results and corresponding representative image. The output result will only represent the total nuclei number in the particular field of view, subsequently, nuclei number within the myotubes were counted by visualizing the merged image. To calculate fusion index, the myotube associated nuclei were divided to the total number of nuclei for one field of view.
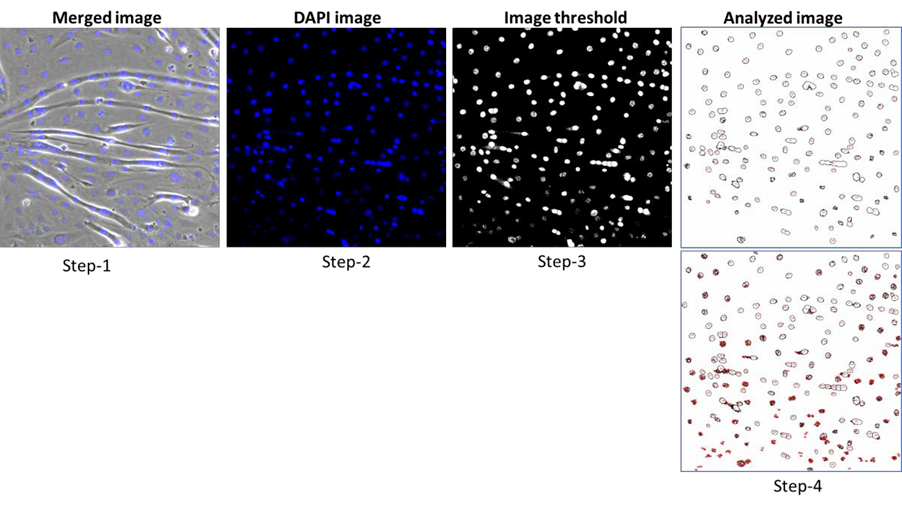
Fig 1: Representing all steps for fusion index image quantification by Fiji (ImageJ). Step 4, top image showing without applying watershed, and bottom with watershed.
For the quantification of Myotube surface area, Tiff image pixel value were converted to micrometer scale. Myotube area were quantified manually by drawing a selection tool option of ImageJ. Only clearly visible myotube were considered for quantification. For all fields of view, myotube area were measured and averaged for quantification. The morphometric quantification was carried out by an independent observer who was blinded to the experimental conditions.
- Kumar, A and Sah, R(2021). Myotube morphology, surface area and fusion index quantification. Bio-protocol Preprint. bio-protocol.org/prep1413.
- Kumar, A., Xie, L., Ta, C. M., Hinton, A. O., Gunasekar, S. K., Minerath, R. A., Shen, K., Maurer, J. M., Grueter, C. E., Abel, E. D., Meyer, G. and Sah, R.(2020). SWELL1 regulates skeletal muscle cell size, intracellular signaling, adiposity and glucose metabolism. eLife. DOI: 10.7554/eLife.58941
Category
Do you have any questions about this protocol?
Post your question to gather feedback from the community. We will also invite the authors of this article to respond.